

Higher timeframe context
The chip sector has been hot with NVDA leading the way into consistent new all-time highs in the recent weeks. We're experiencing the AI rush first hand. The avid reader knows I've been trading a lot of these names lately, as they're obviously “In Play”.
Today I want to go over a trade that failed. It's important for trades and trends in general to fail. That's part of how charts move after all. If we didn't have failures prices would only go in one direction. So here's a story on failures.
Weekly chart
We've gone over this chart a few times already so I'll just focus on recent action. Feel free to take a look at previous posts for deeper insights on the higher timeframes.
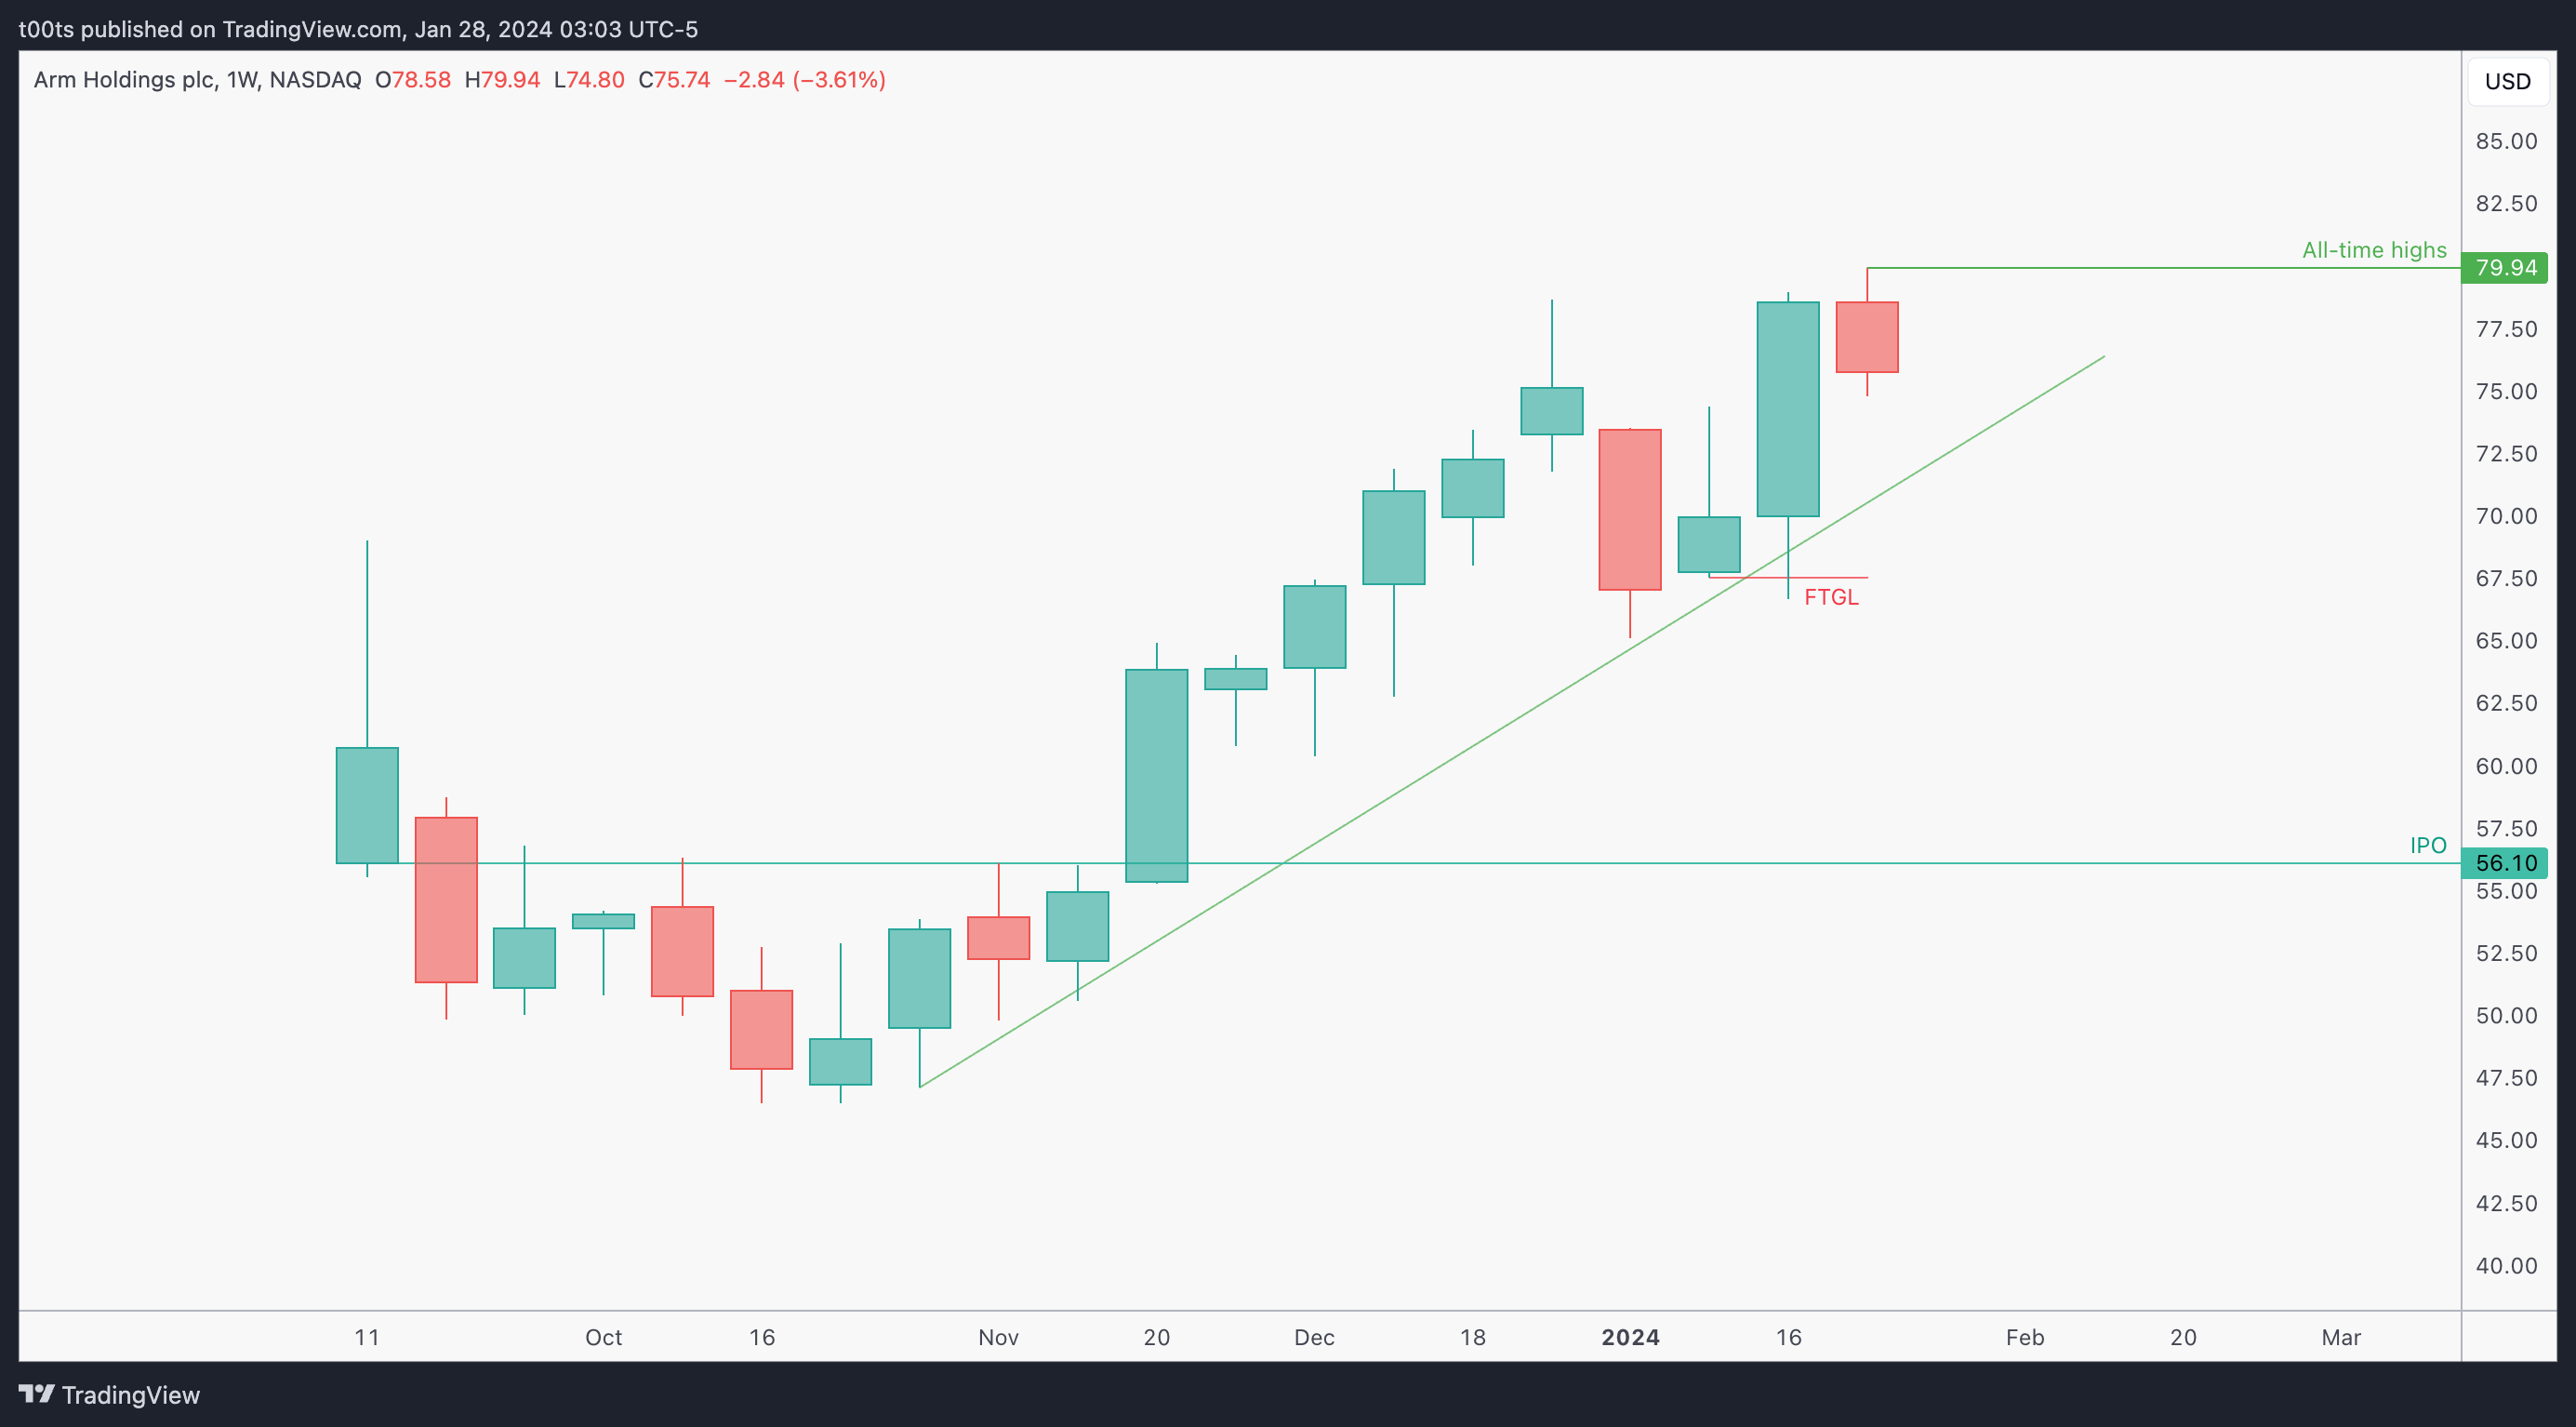
The weekly chart displays a clear uptrend. In recent action we can observe how price traded below the previous bar lows and, just as the trend was about to give up, bulls picked it up and the stock bounced, indicating strong momentum and the will from buyers to keep things going. This week we've just made a new all-time high and are now pulling back slightly.
Daily chart
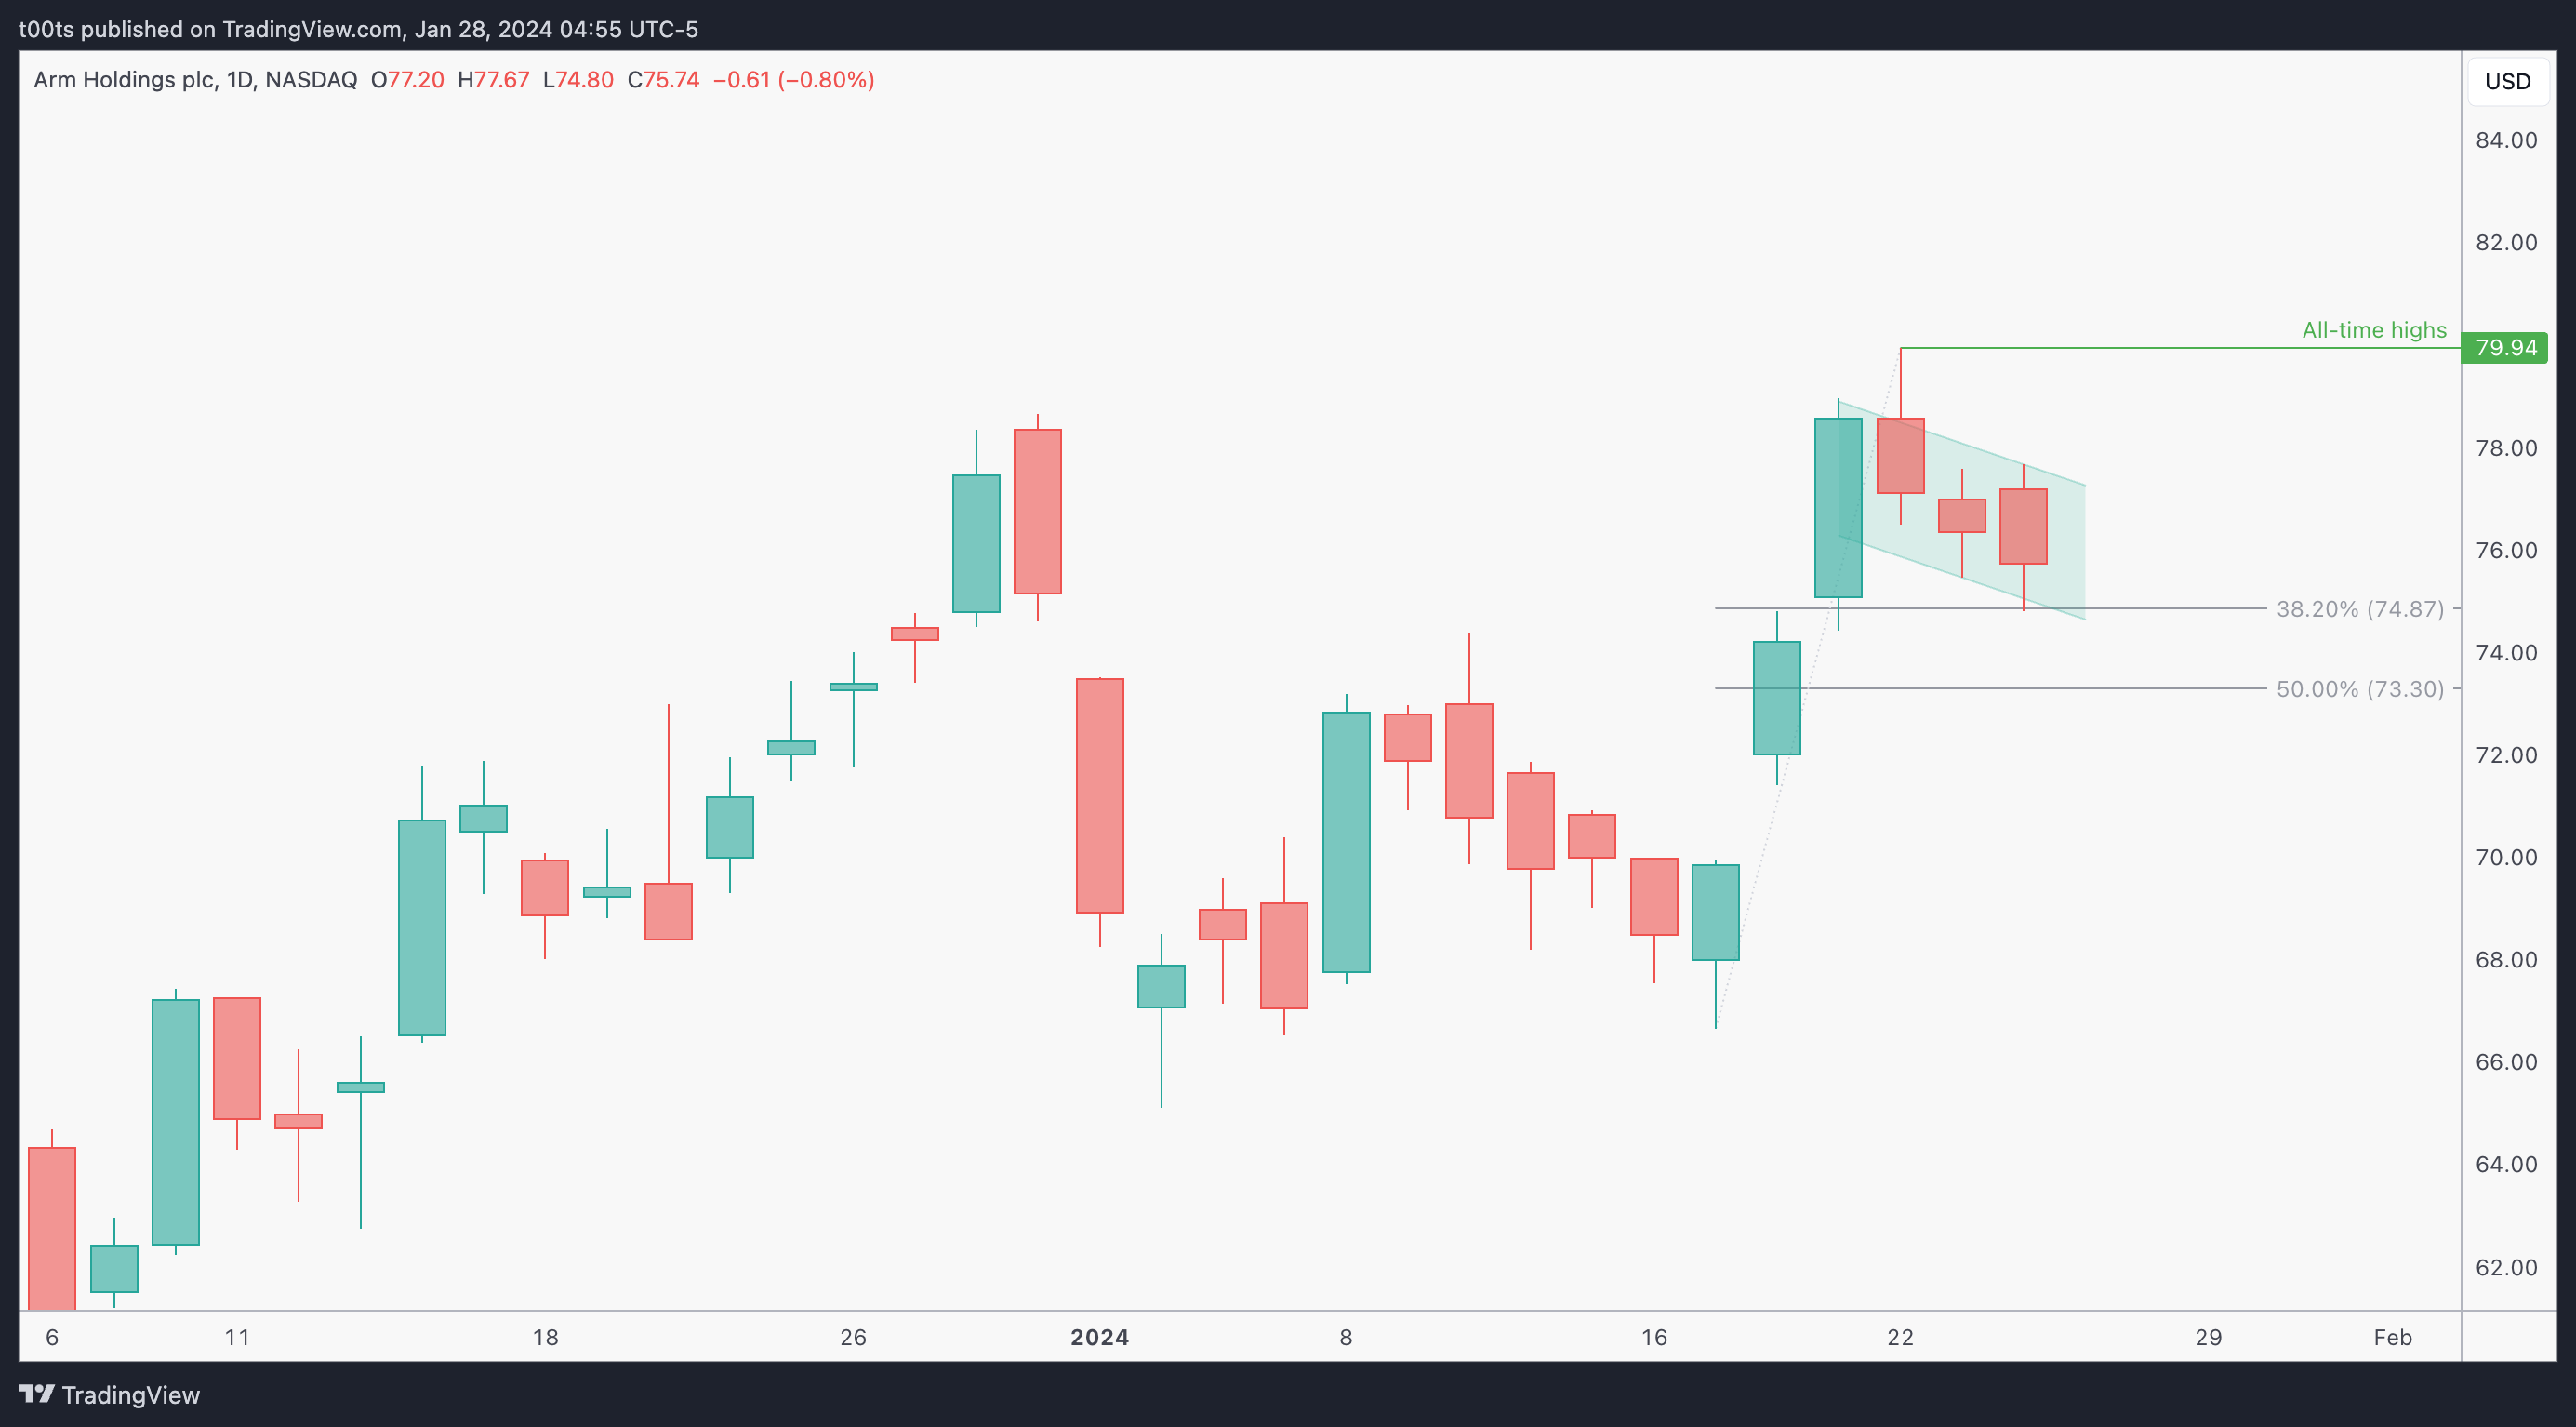
This daily chart gives us a more detailed zoomed-in view of this recent pullback from all-time highs. Price is quite conveniently bouncing off the 38.2% FIB retracement of this last leg up. This usually indicates strong momentum. I went over what each FIB level I use means on this post in case you missed it.
Regardless of any FIB's, to my eyes this is a bull flag after the weekly failure pattern. Price rejected at all-time highs but bulls are setting things up to attack again, possibly soon.
Hourly chart
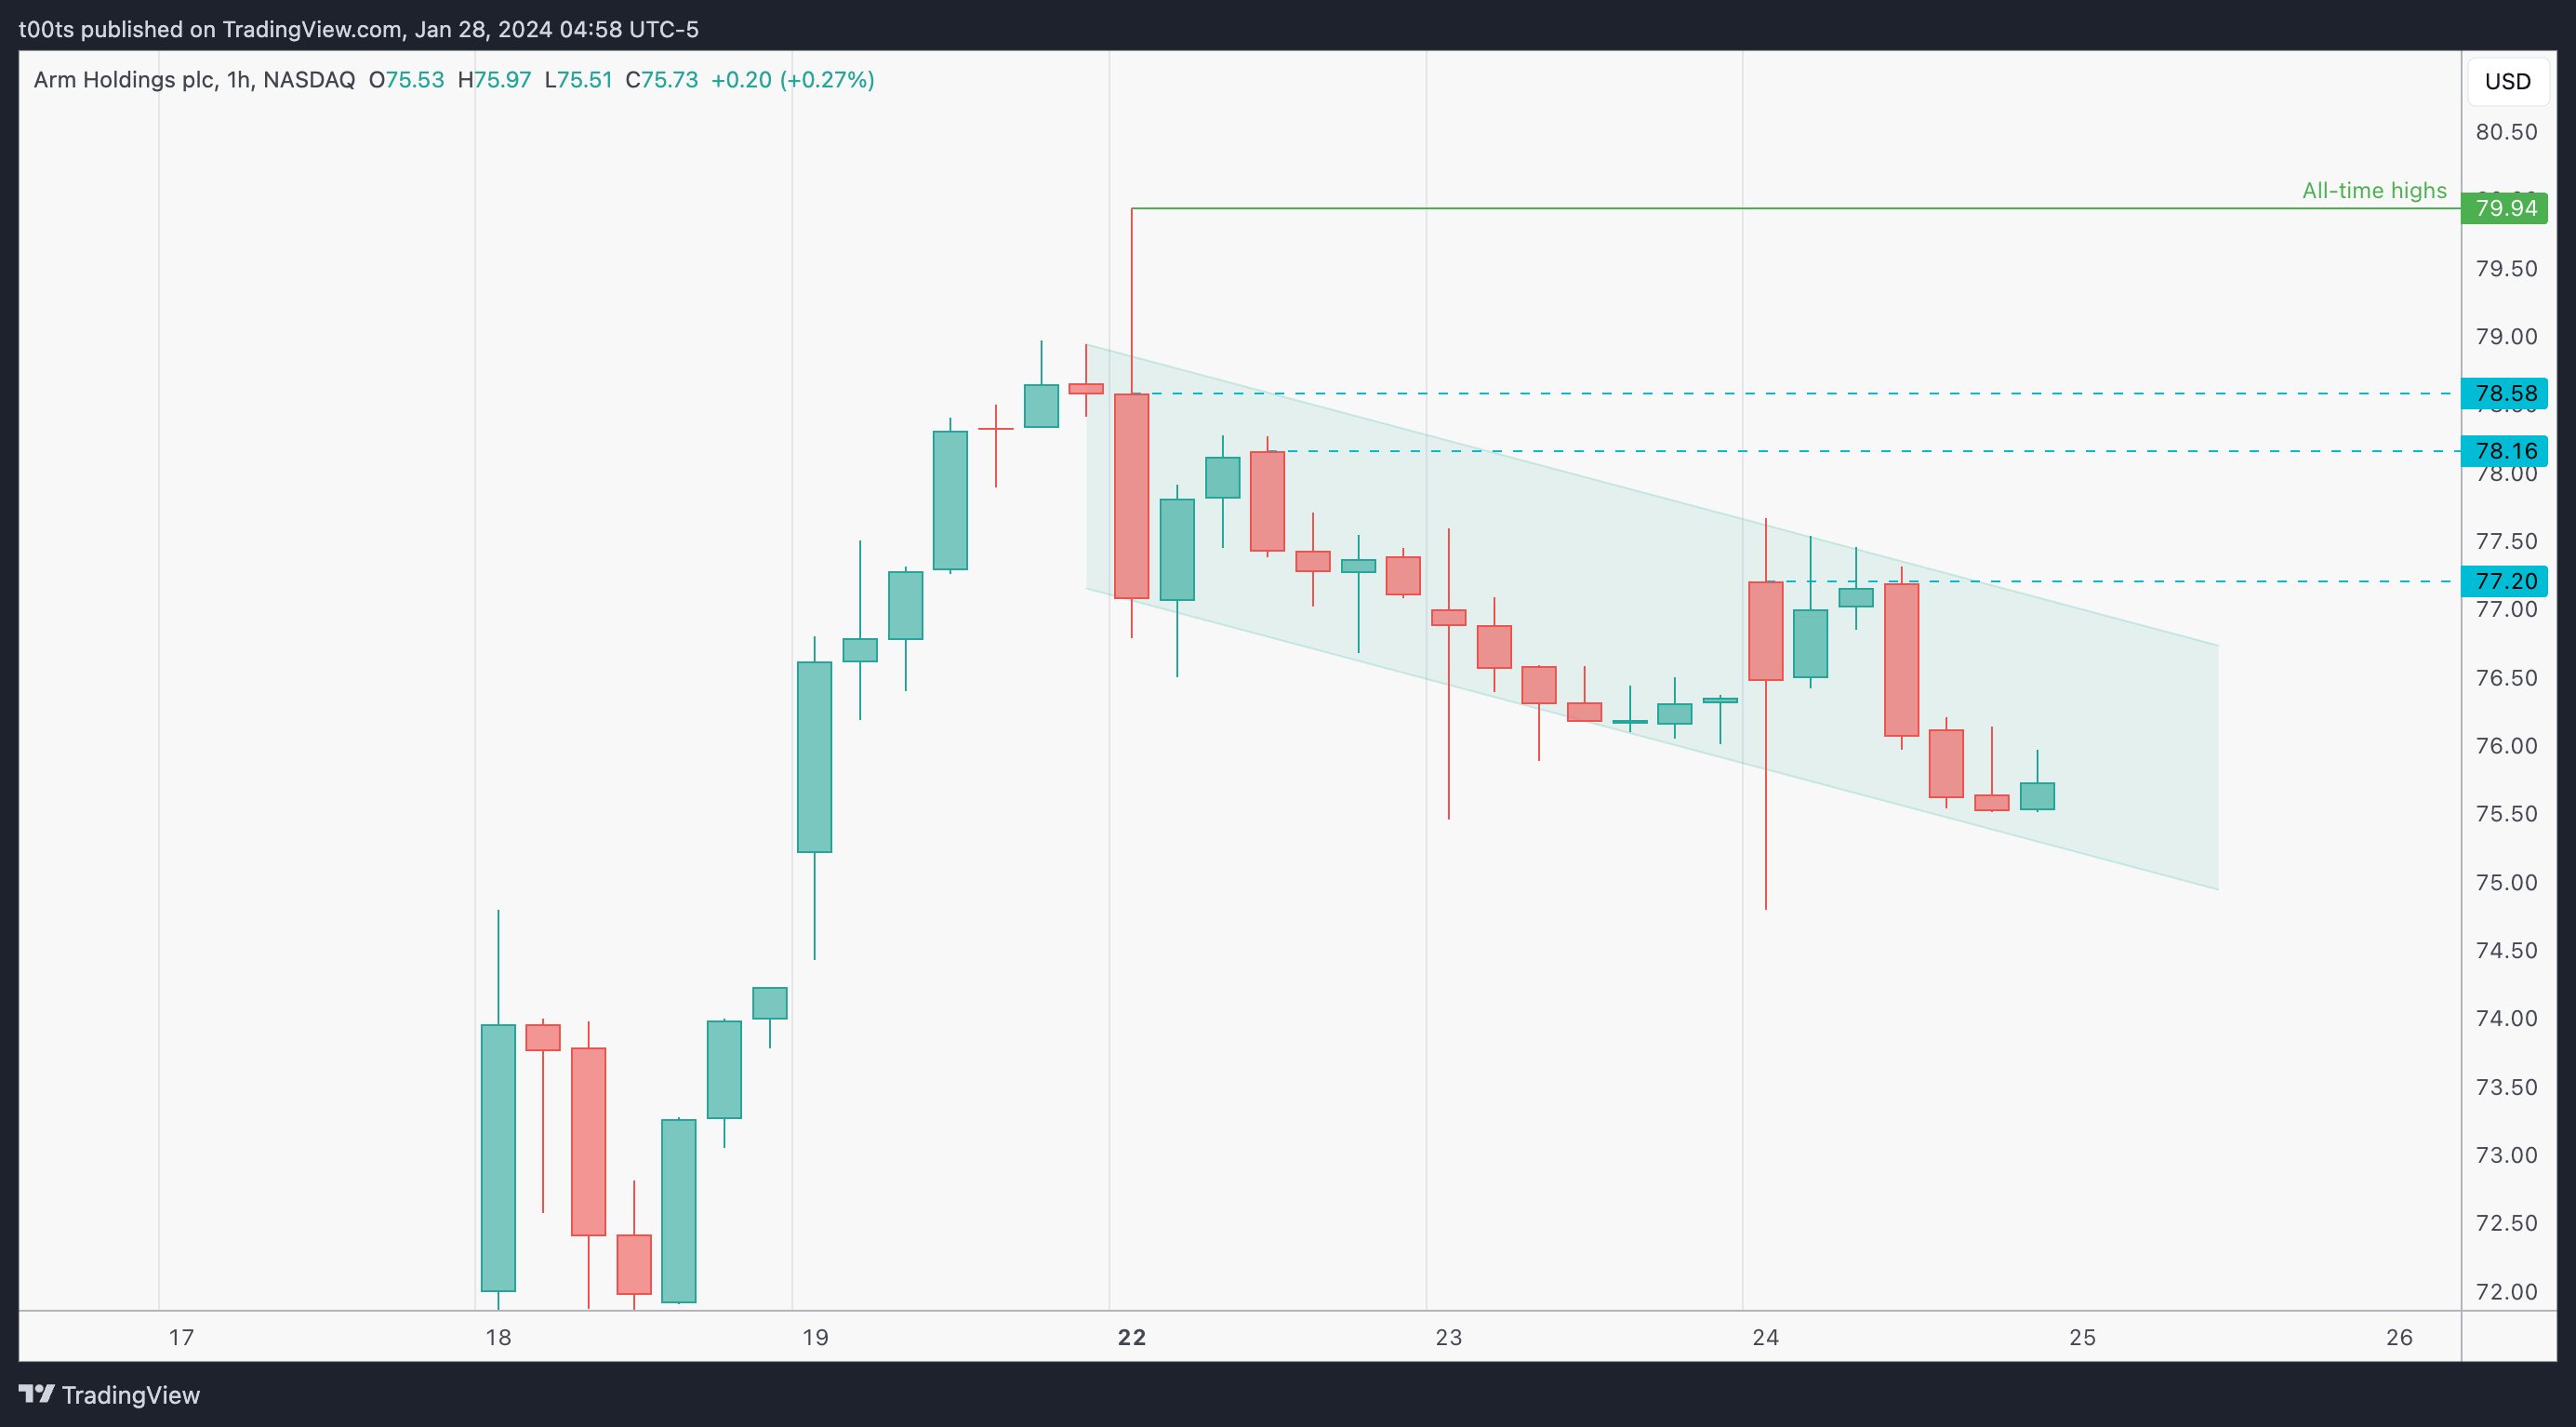
As usual, we get a few levels of reference from our hourly chart. We can also appreciate in greater detail the price channel that's forming the flag. Price trading above the $77.20 level should get things interesting to consider longs.
Pre-market action
Pre-market action was irrelevant to this trade.
The trade
Today's post will be slightly different as I'm going over a loss. Not sure how it'll turn out, but I'll do my best to make it worth your time.
Around 10am, ARM started taking off. This is a stock I've been watching a lot lately, but on this day TSLA had just reported its much awaited Q4 earnings, so many eyes were on her, including mine.
At a certain point in the day, I saw that ARM was the strongest stock in my watchlist. At the same time, I was giving up on my attempt to catch a sub-200 TSLA long with shares.
So I check out ARM and this is what I see:
All i'm seeing is strength, momentum, and FOMO.
Yes, FOMO. It's a stock I like to trade, but it's also a stock I've wanted to own for a while. I've been trying to get a fair entry with shares on this one a couple times and every time I've placed a limit order it somehow bounced close enough not to hit it.
So, after a move like that, first thing I do is draw a FIB to get some references of where it would make sense to get involved. I got my levels ready as well.
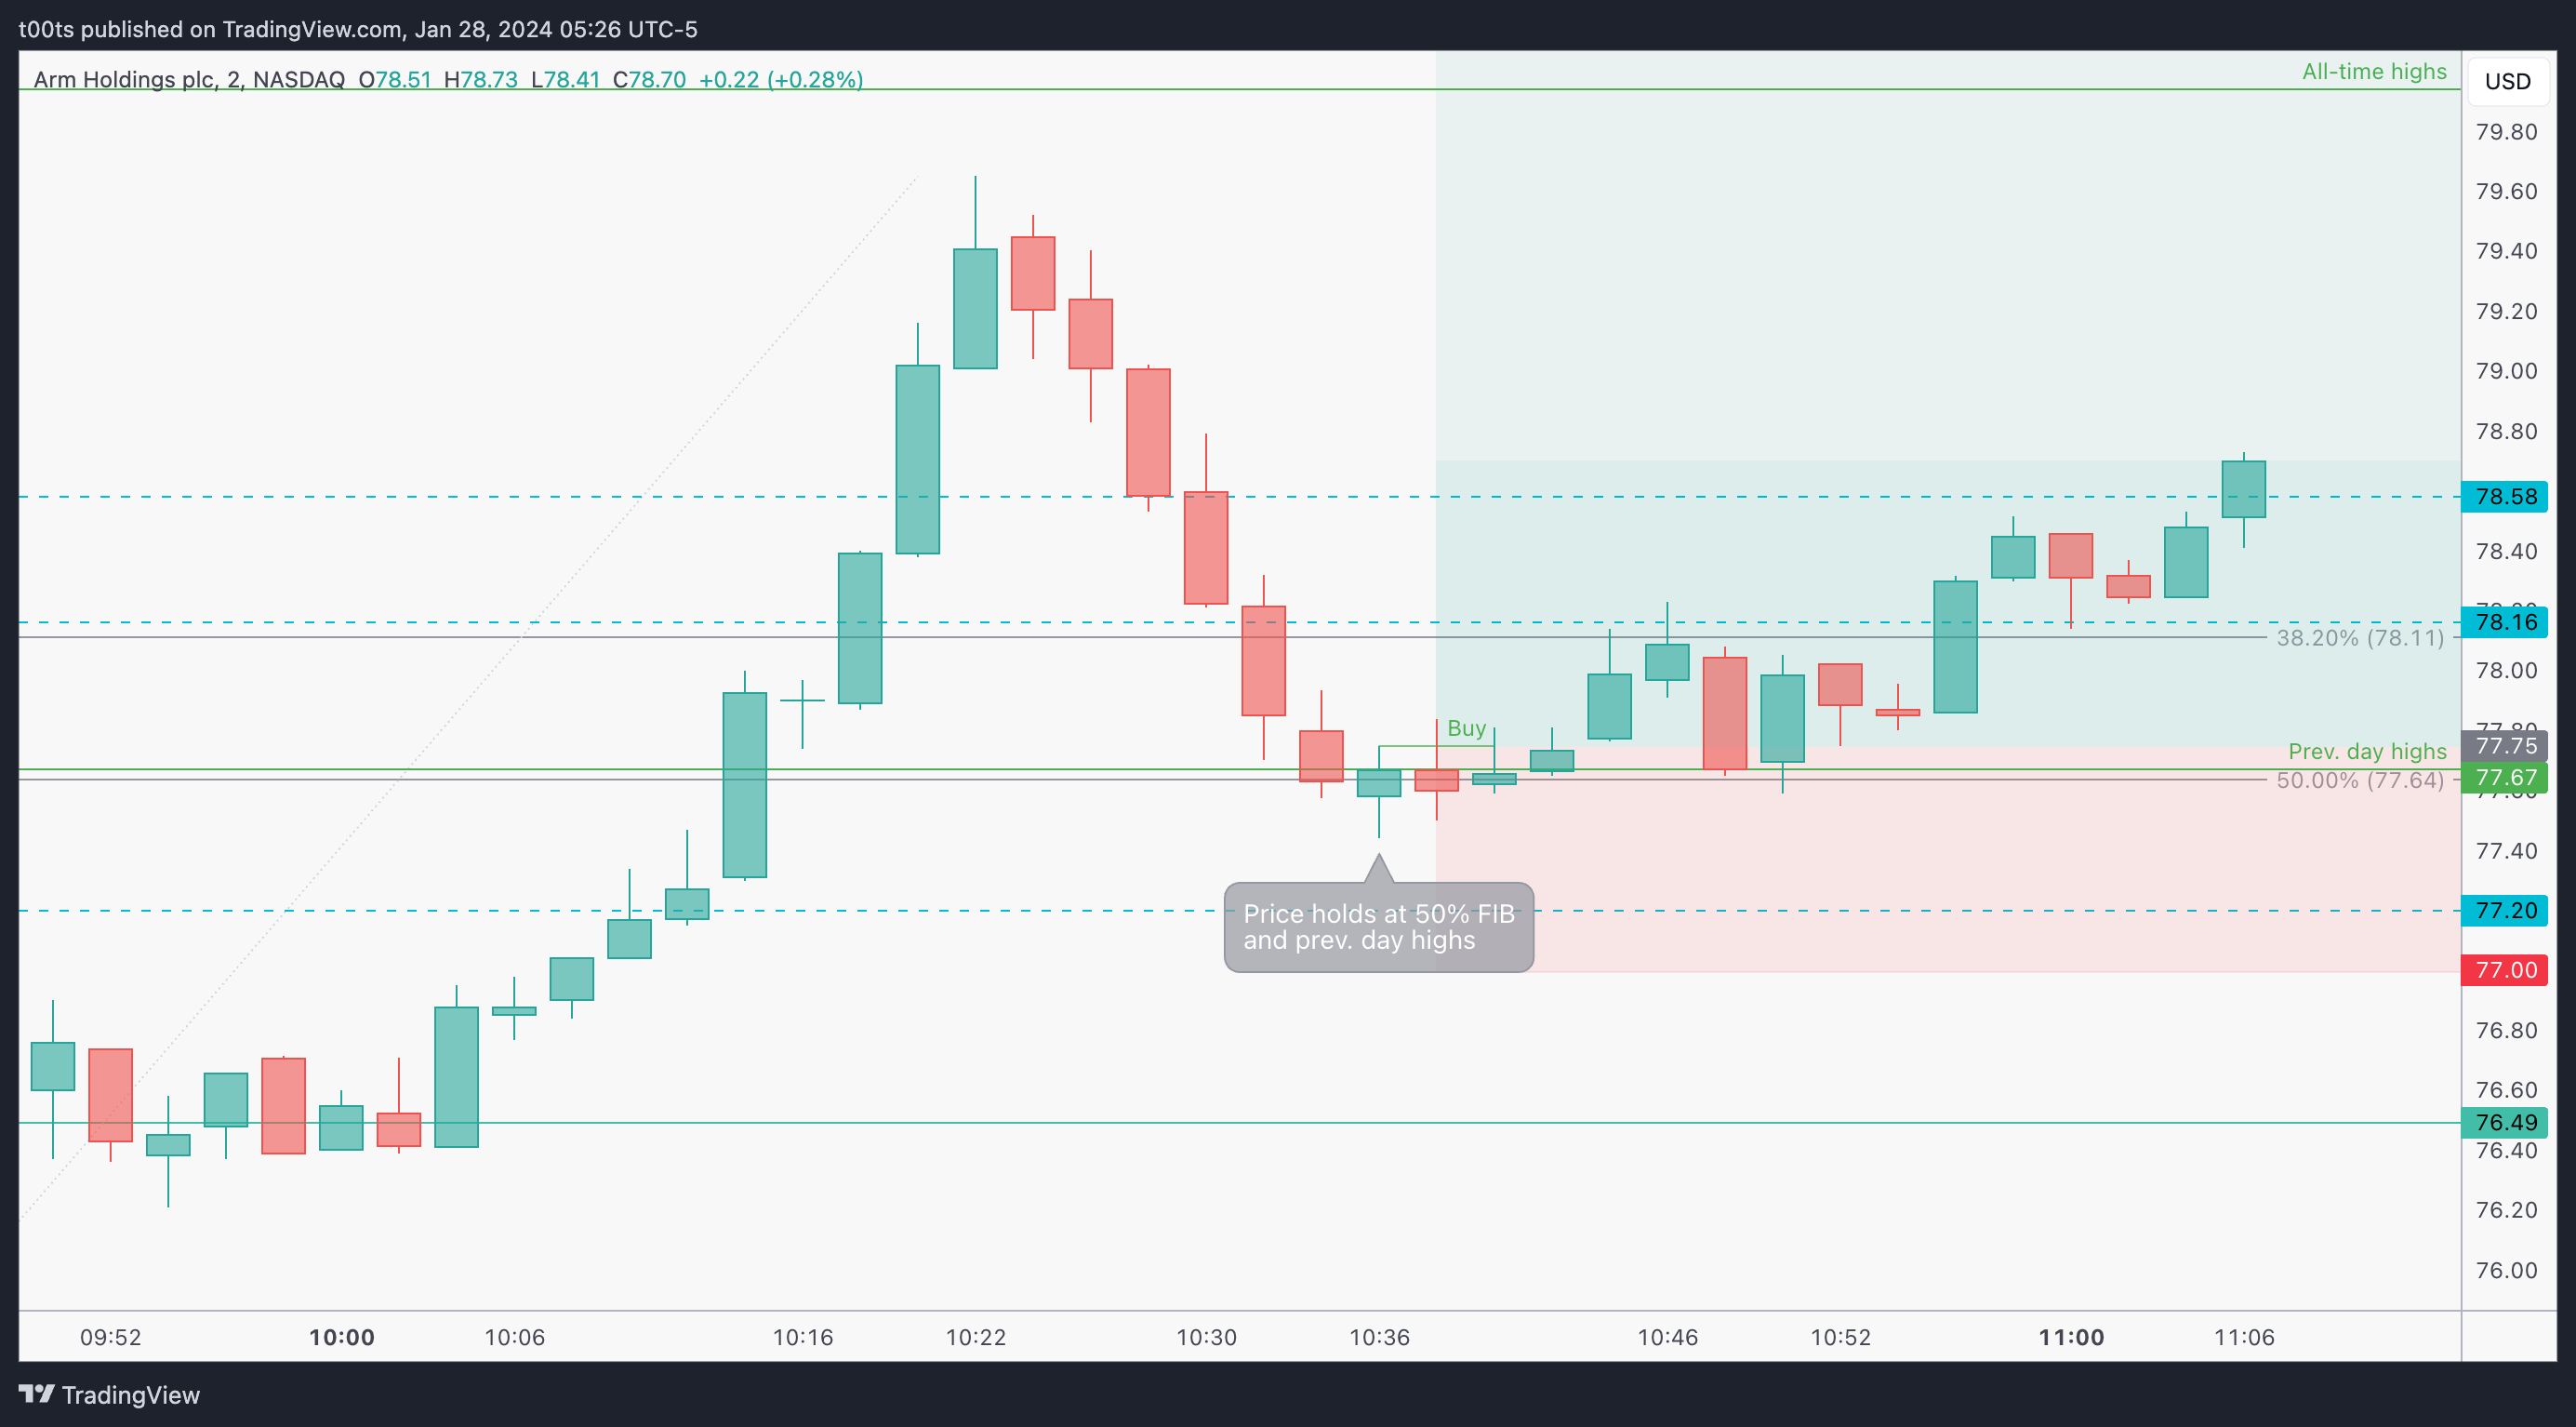
First thing I notice is that there's a level at $78.16 that's quite in-line with the 38.2% FIB retracement. I'm watching closely for an entry there but price doesn't even try to hold, so I sit tight.
On the 50% retracement area, price seems to hold. It aligns almost exactly with the previous day highs. I get involved using the 2m buy setup, arguably rushing into the trade. Here’s my entry:
At this point, this was my CPT:
Cue(s)
Strongest stock in my watchlist that day
Daily bull flag breaking out
Retest of daily bull flag breakout level aligned with intraday 50% retracement
Emotional cue: Been chasing an entry on this stock with no luck
Emotional cue: Gave up on a TSLA entry
Plan
Wait for price to give the slightest sign of holding and buy shares with a stop at $77 to give it room in case it pulls back a little more. There's a level at $77.20 that ideally holds if this area gives up.
Trigger
Price trading above the first signal bar.
Outcome
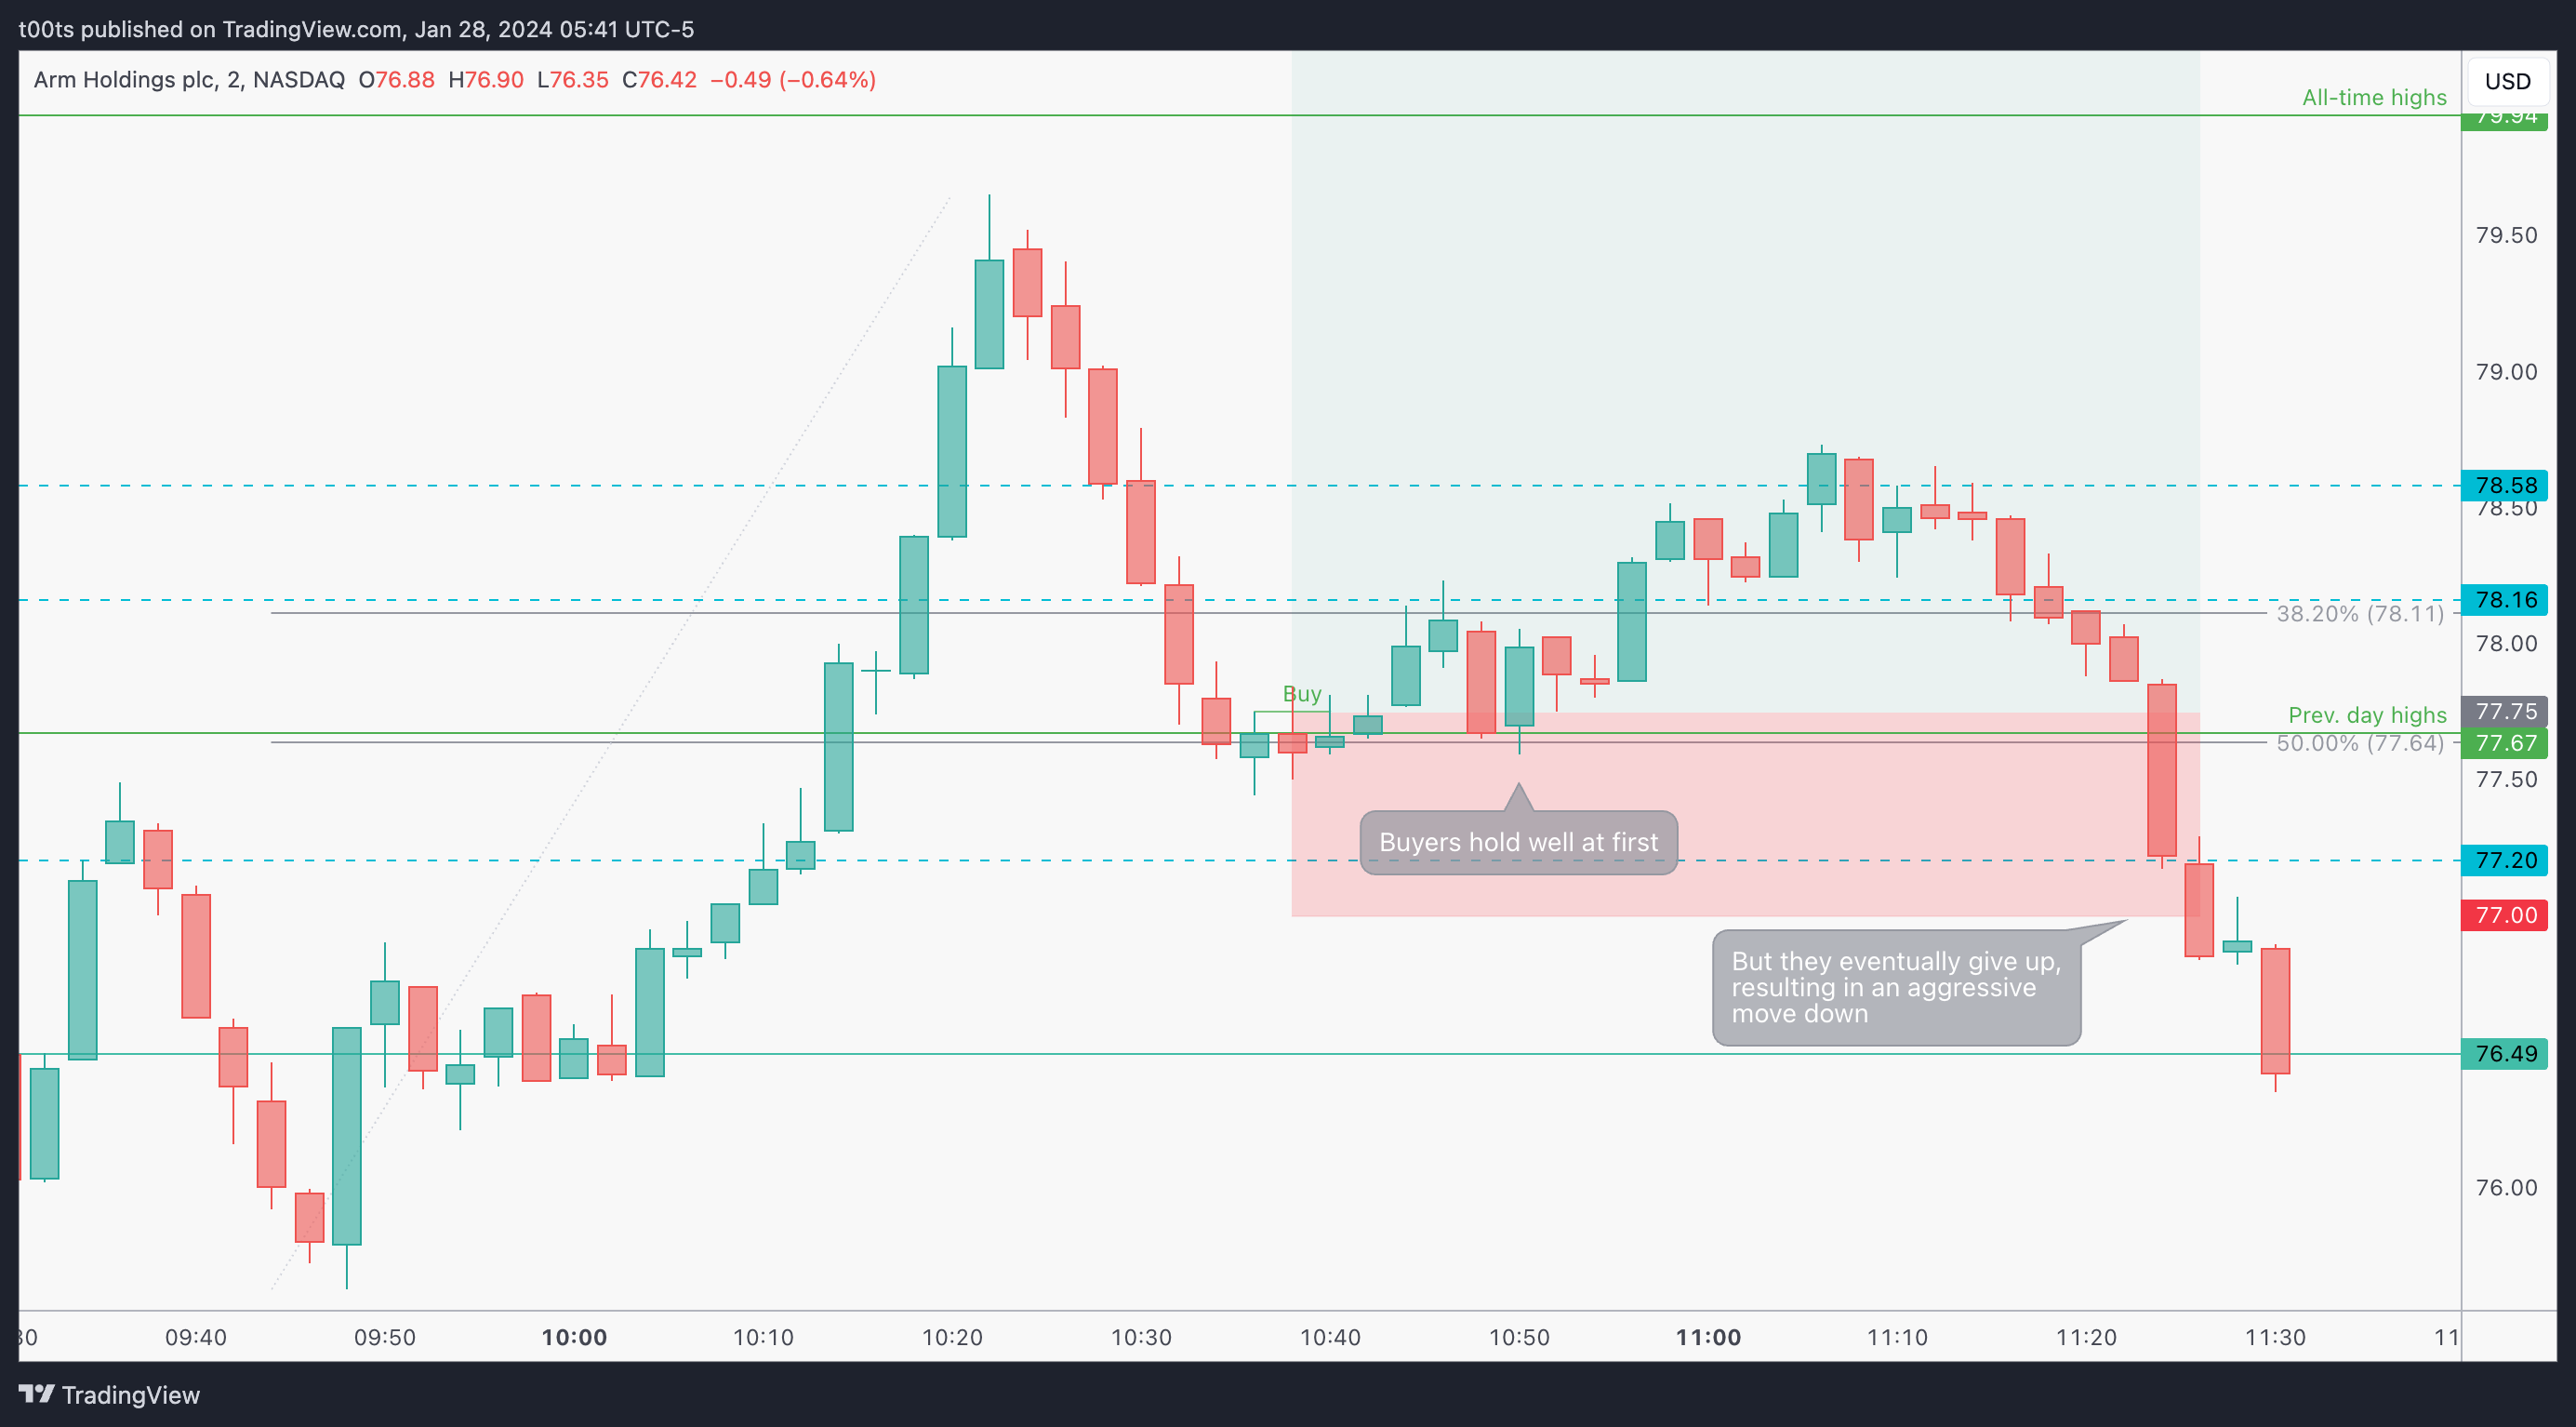
This is a 2m just to be consistent with the previous entry chart I used above. I wasn't even watching when I got stopped out. I don't usually babysit my common stock trades. The risk is defined beforehand so unless I'm doing something wrong I'm cool with my stop loss order being triggered. However, I was quite surprised with how quickly things turned around.
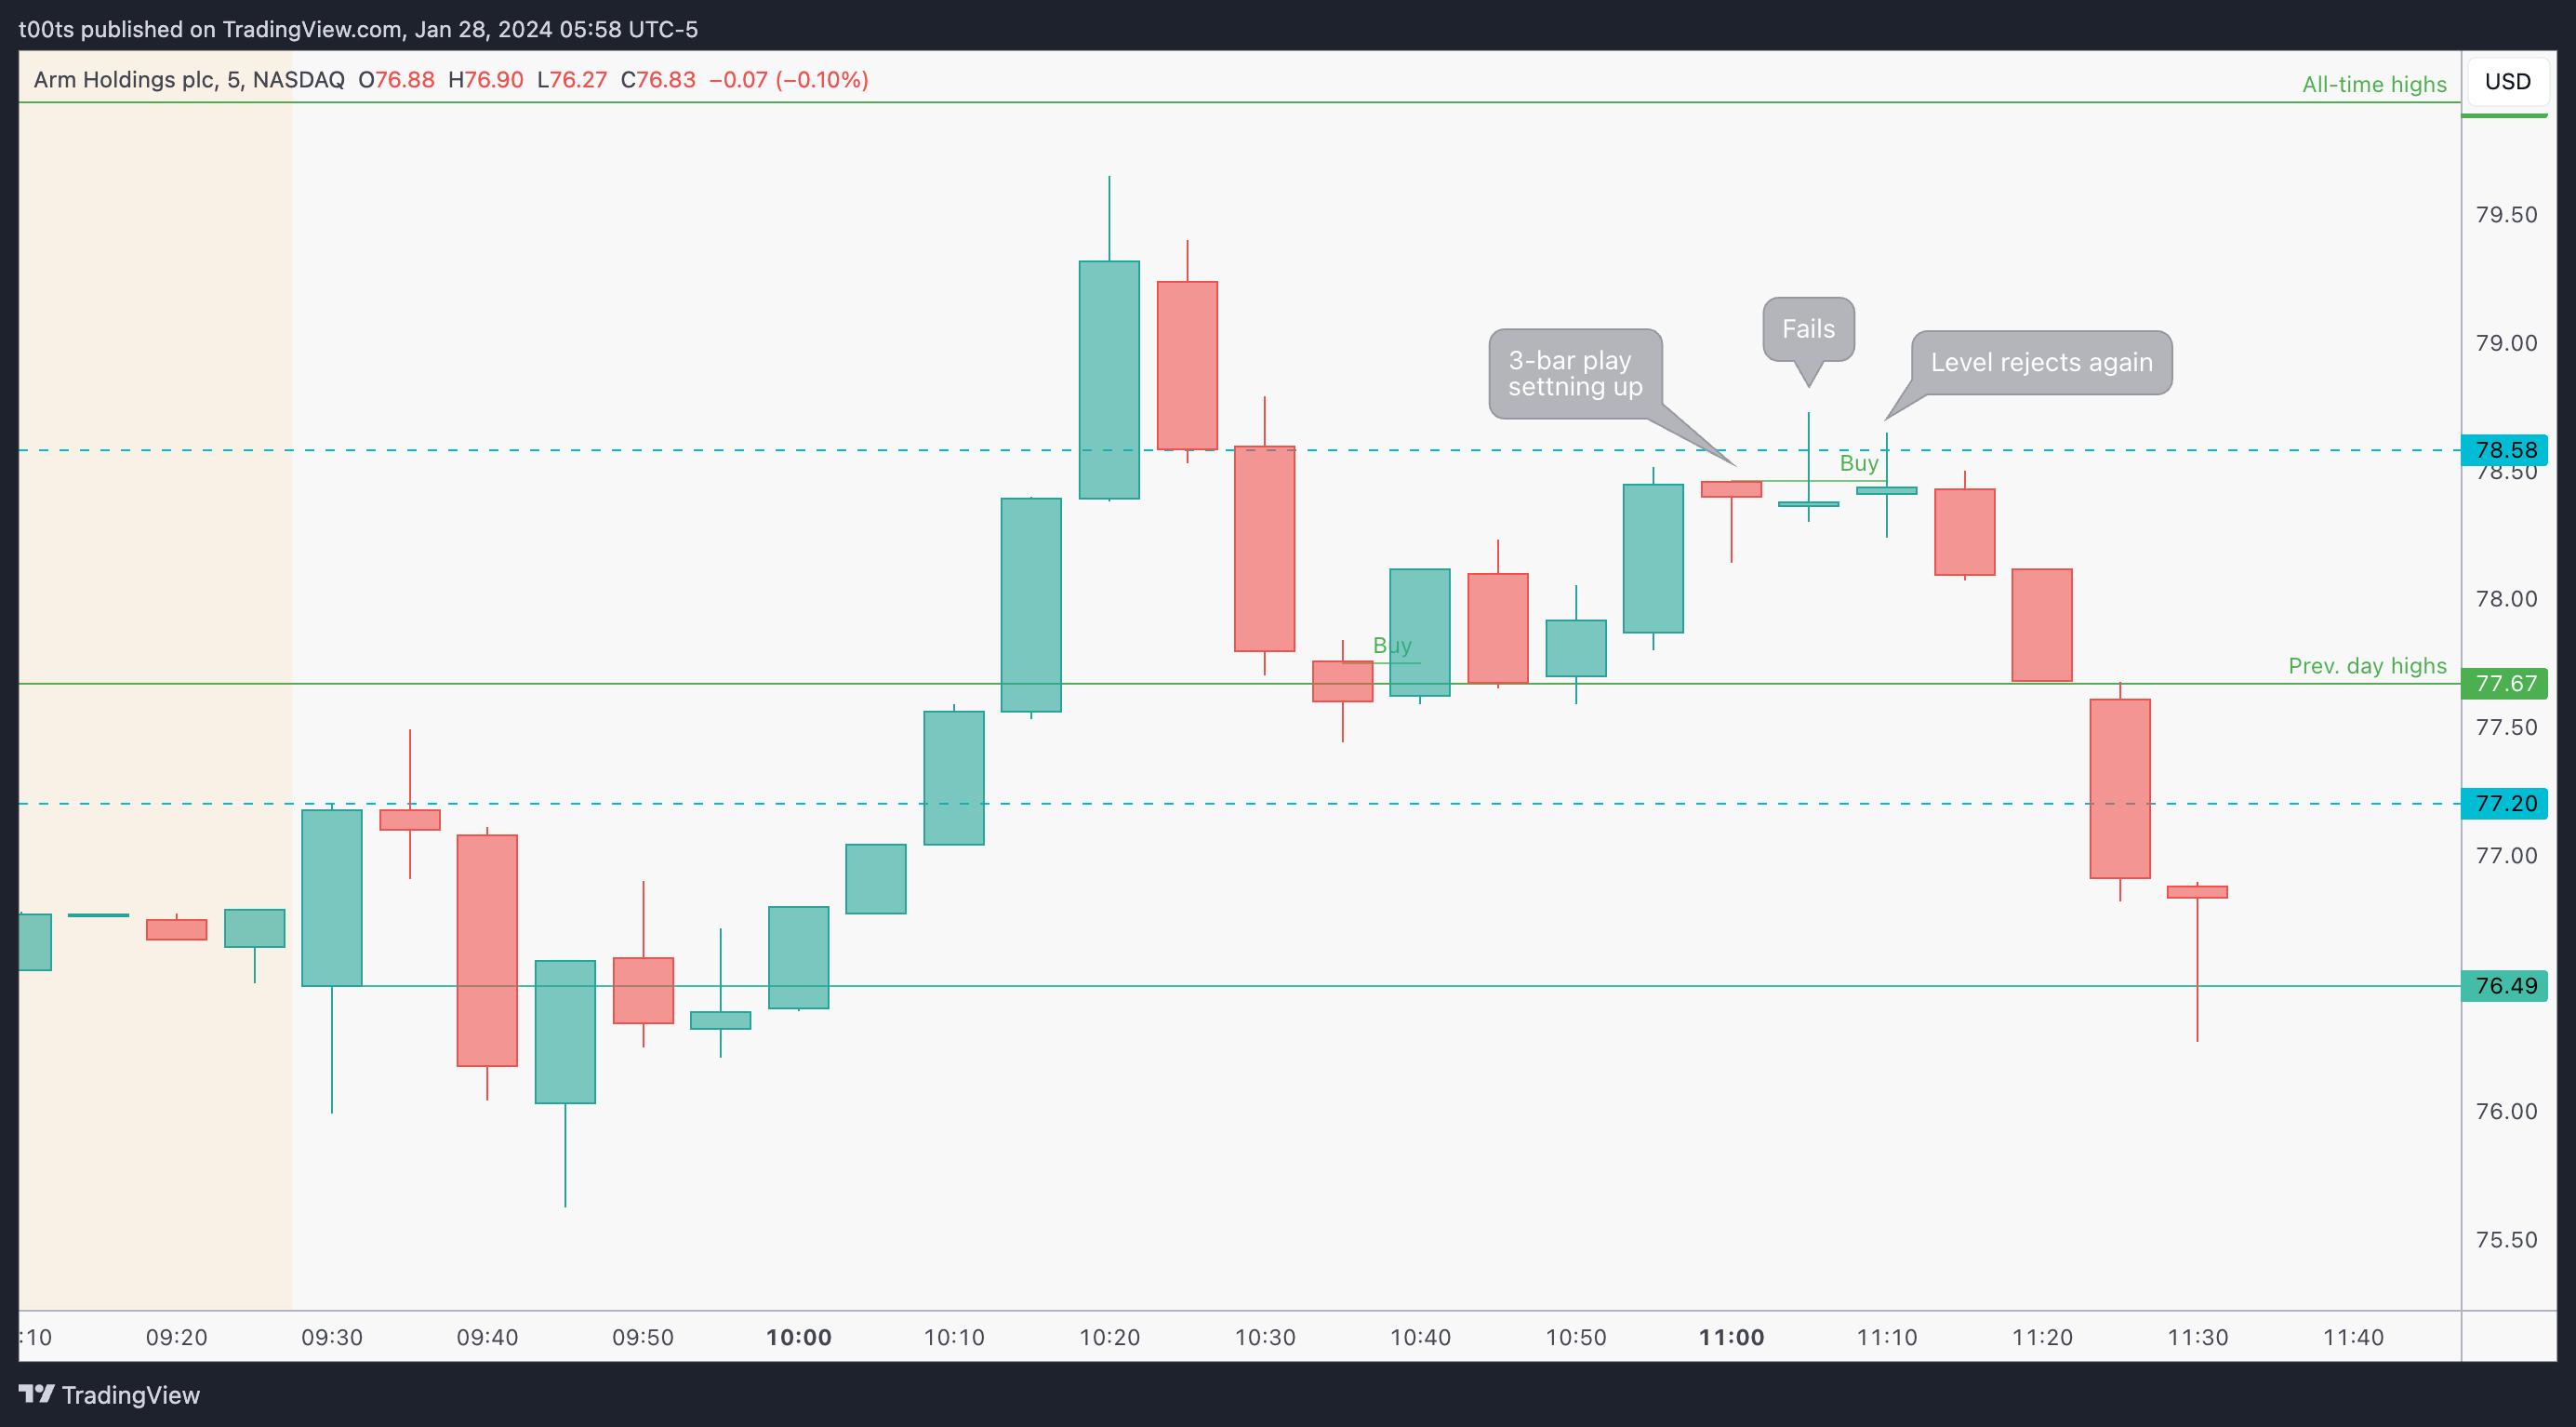
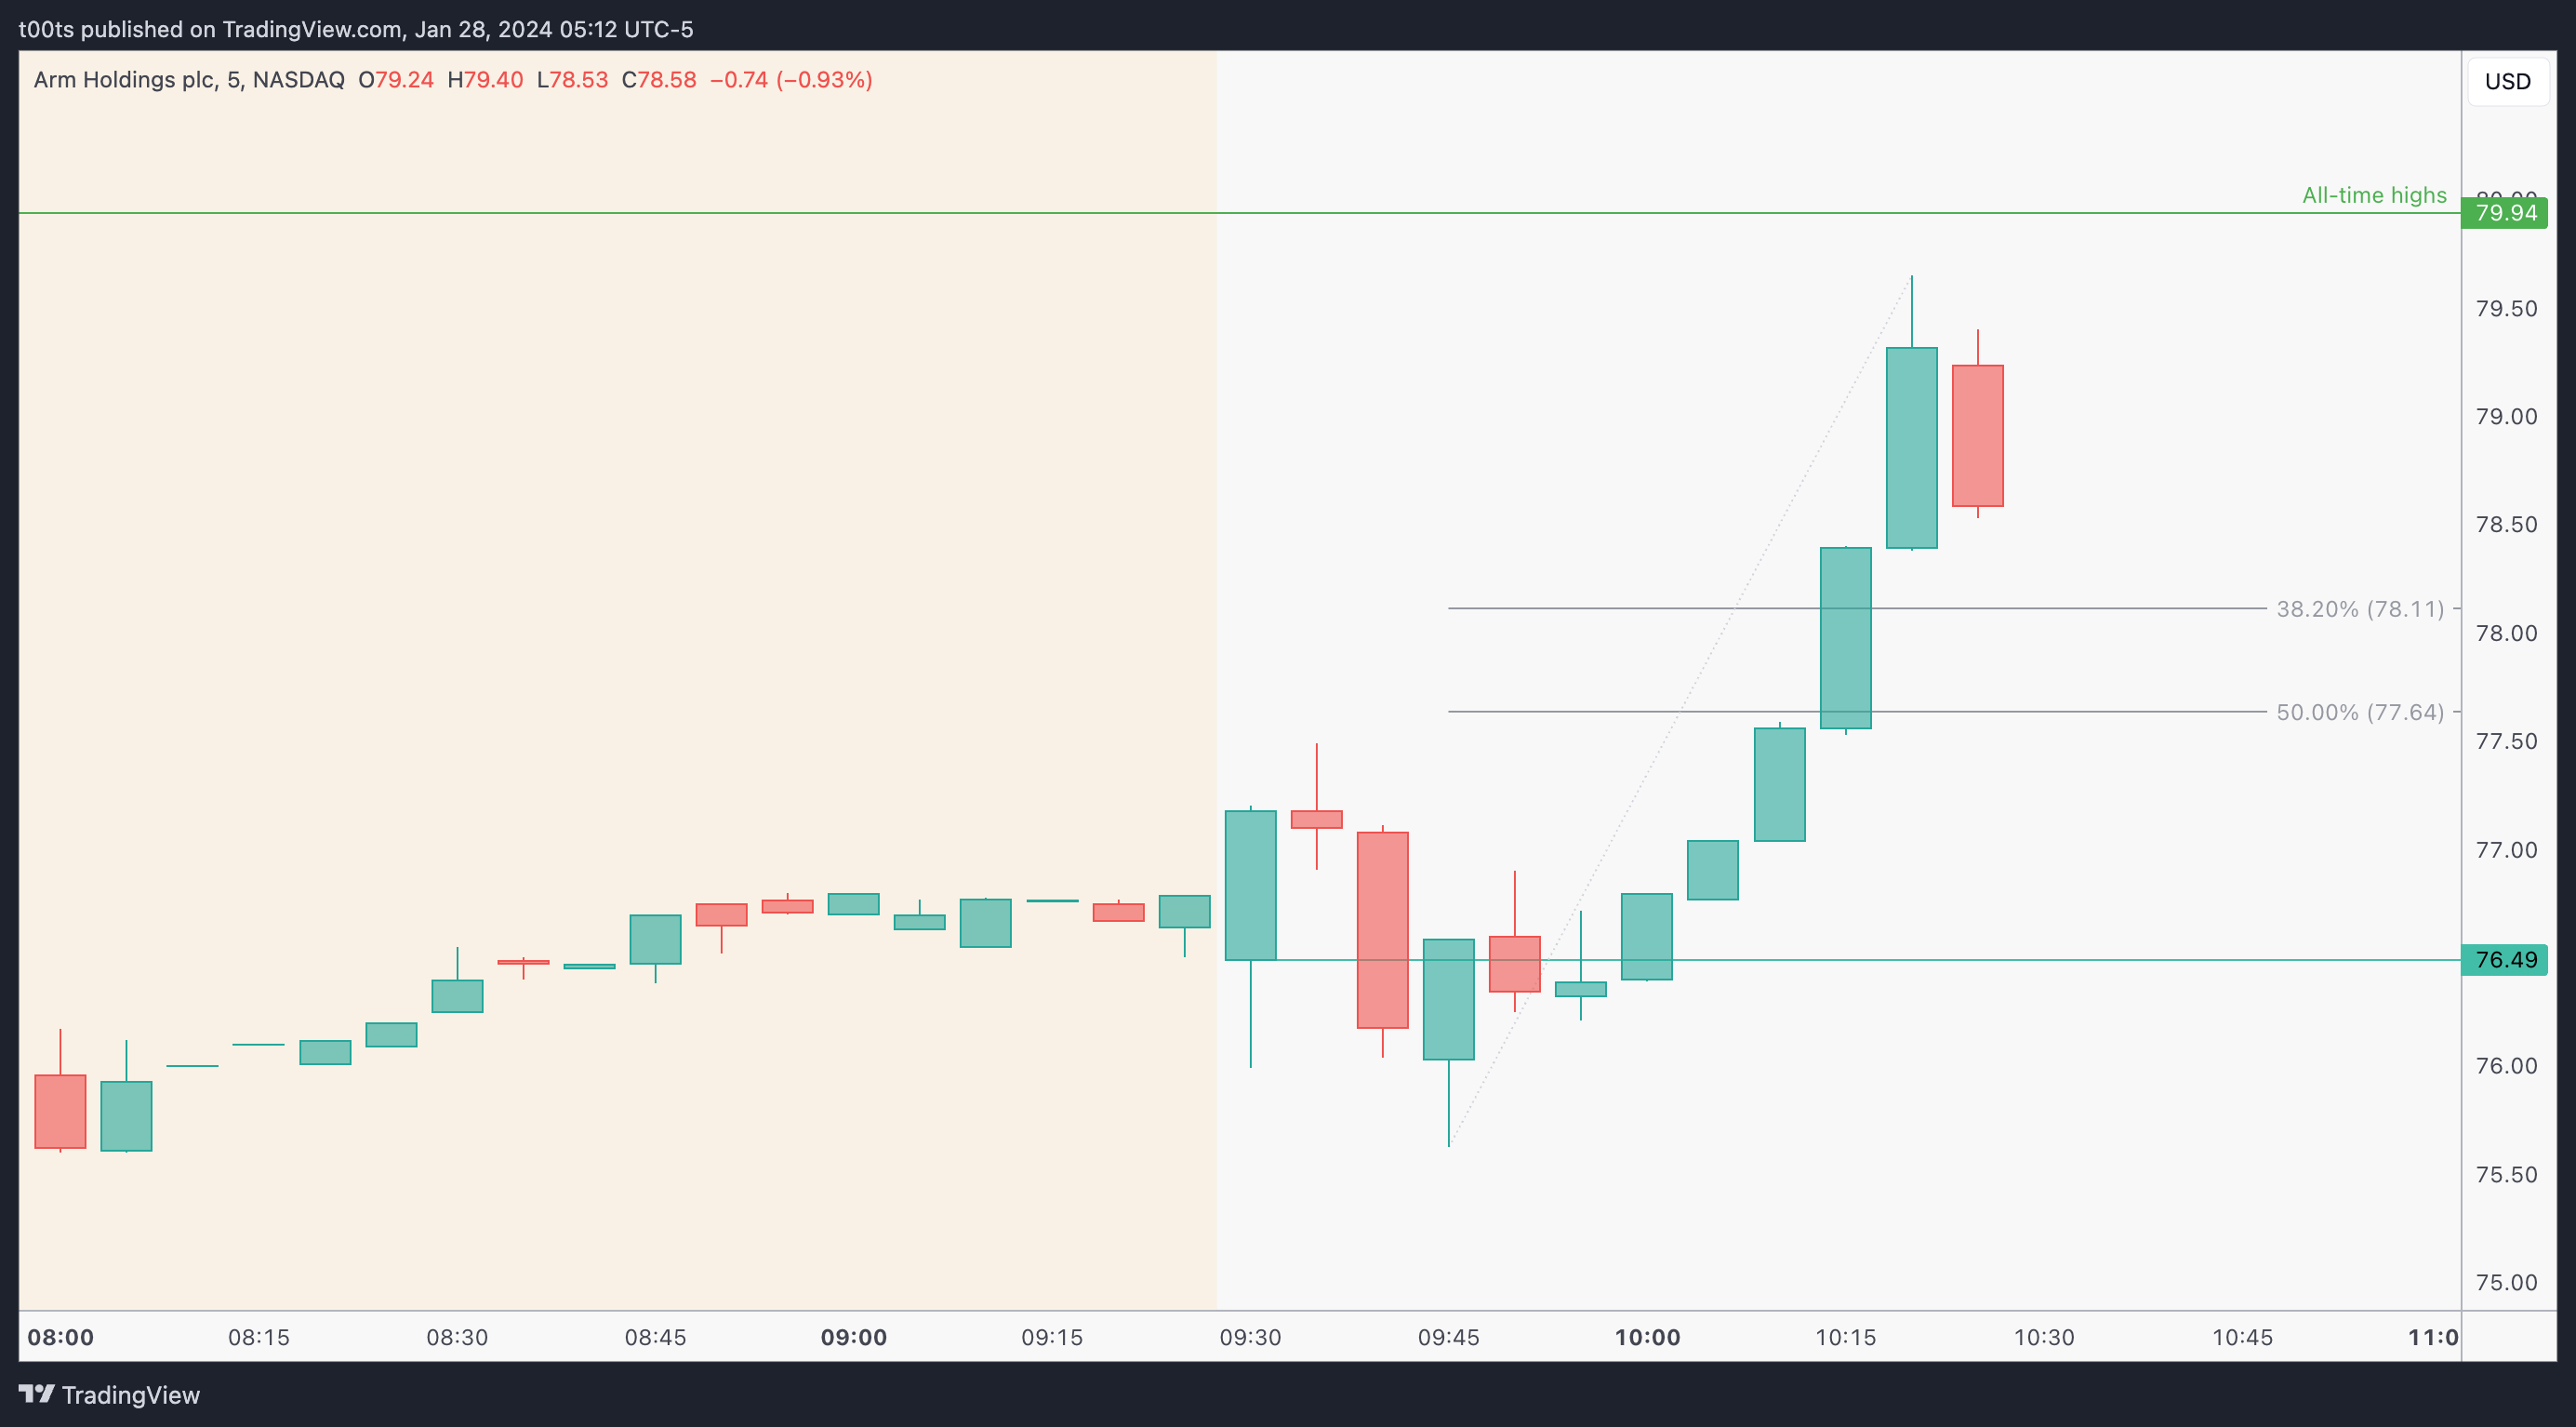
Here's a 5m chart so we can zoom out and get a little bit of context. I rarely trade off a 2m chart past 10am. Again, there was some FOMO involved in this trade. Anyways, check how that beautifully set up 3-bar play failed. Right after that failure, the level where it failed at rejects again. That's two failures at a level, which as we know often lead to good counter-trend moves. Big warning sign there for longs, which I obviously missed.
Closing notes
I'm frankly quite happy with this stock pulling back as I would like to keep looking for long-term entries. The fact that this daily bull flag failed can also lead to solid trades to the downside. If you pull up a daily chart, this is the second failure after price failed to close above previous all-time highs on the 22nd of this month.
We know that second entries are usually good counter-trend entries. So I bet some shorts will be jumping in for this pullback. We'll have to see how far it goes. I personally believe there won't be that many long-term investors selling their positions so early, so I'm weary about trading this name short for now.
I am posting one trade writeup every day throughout 2024. I focus on large caps using levels and price action. The subscription is absolutely free and will always be. I will strive to provide value by offering clues and ideas for you to enhance your edge. Let’s grow together!