
Arm Holdings (ARM) - Jan 18th 2024
Choosing the right vehicle to take advantage of sector momentum

Higher timeframe context
This is one of those stocks I've been wanting to buy for my long-term portfolio, and it somehow manages to bounce right above my orders lately.
On one hand, investors want to get exposure in chip stocks and are waiting for a dip so they can buy more with limited risk. On the other hand, bears are waiting for that same dip so they can exit with a smaller loss. When everyone wants the same thing, it won't happen because both sides will start buying earlier than they'd want to, preventing the larger pullback from happening.
Weekly chart
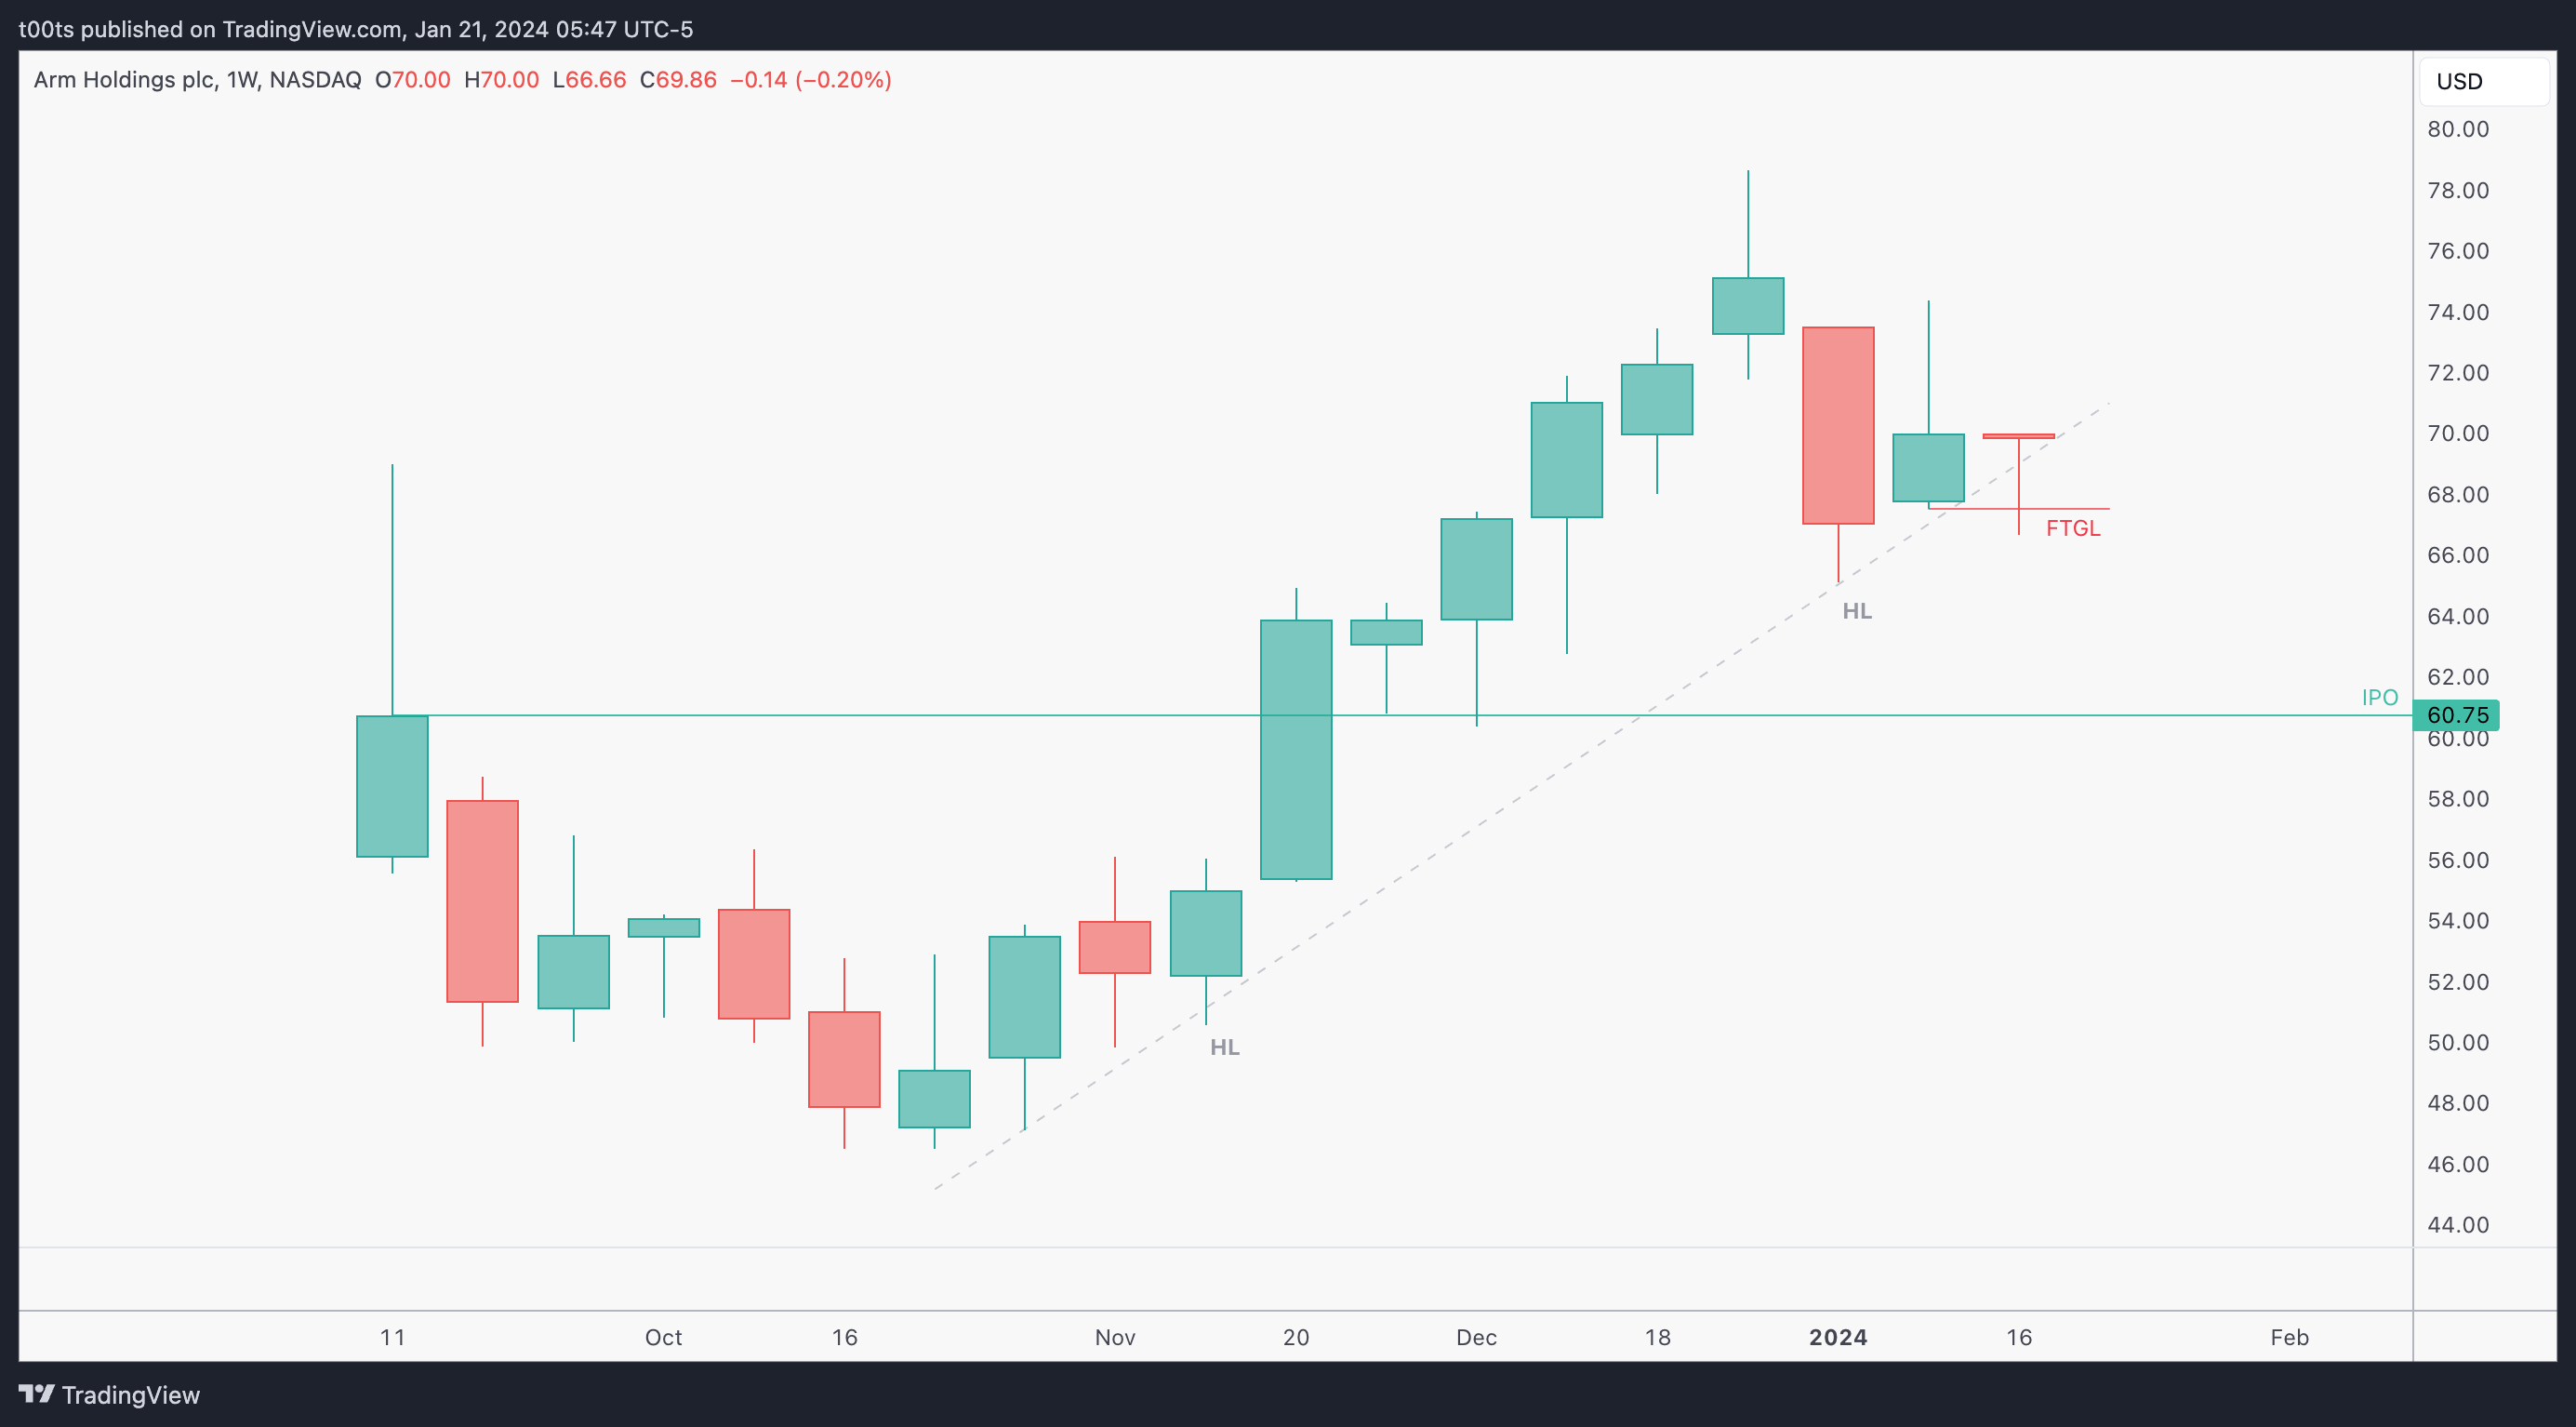
The weekly chart displays a clear uptrend. We can see how the stock broke out the original IPO price with strength, and then consolidated for a couple weeks before resuming the uptrend. We can appreciate the market-wide pullback at the start of this year, and in more recent action we can observe how price traded below the previous bar lows and, just as the trend was about to give up, bulls picked it up and the stock bounced.
Daily chart
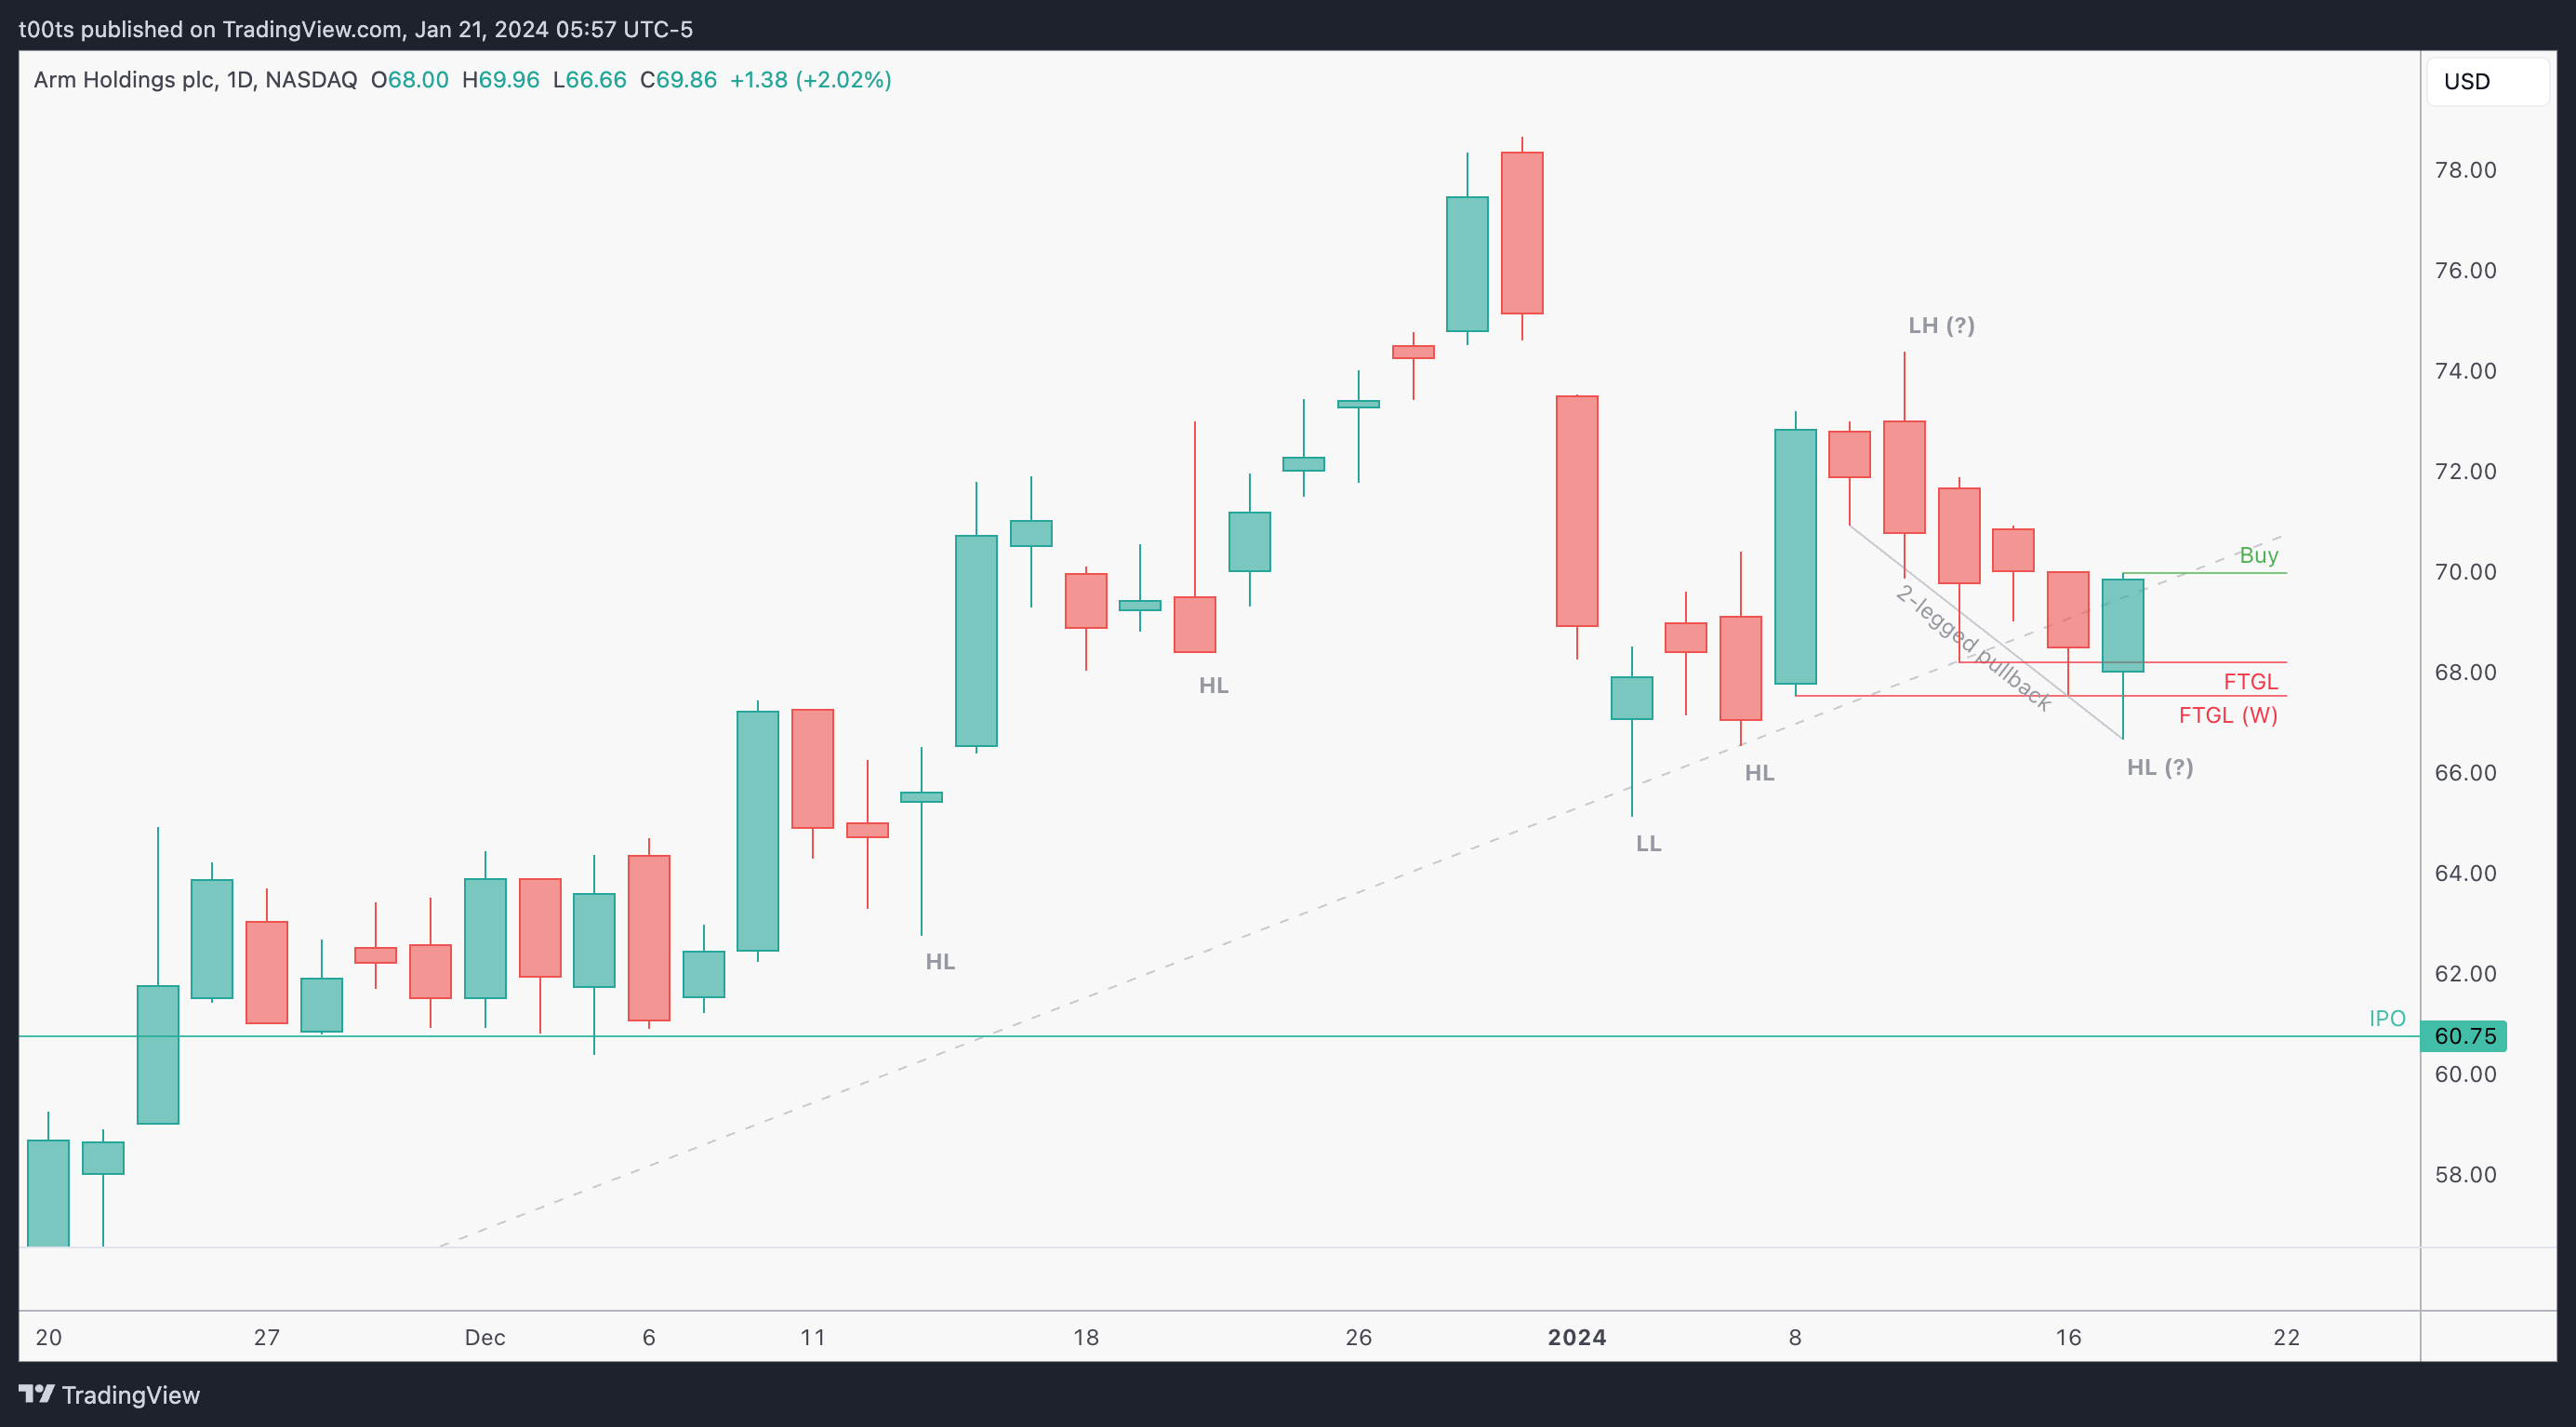
In the daily chart it looks even better. The trendline was about to break but buyers managed to get a very strong close slightly above it.
Of course, drawing trend lines is sometimes highly subjective. This is one of those cases, but it serves us as a good reference.
Regardless of any trend line, if you look closely, there's a few other interesting clues. Namely, the two-legged pullback after that single bar trend (it's two legs because of the inside bar in the middle) and the failure to trade below the first leg's low as well as previous weekly lows. Finally, this daily bar is potentially setting a new higher low, giving us a solid with trend buy setup.
Hourly chart
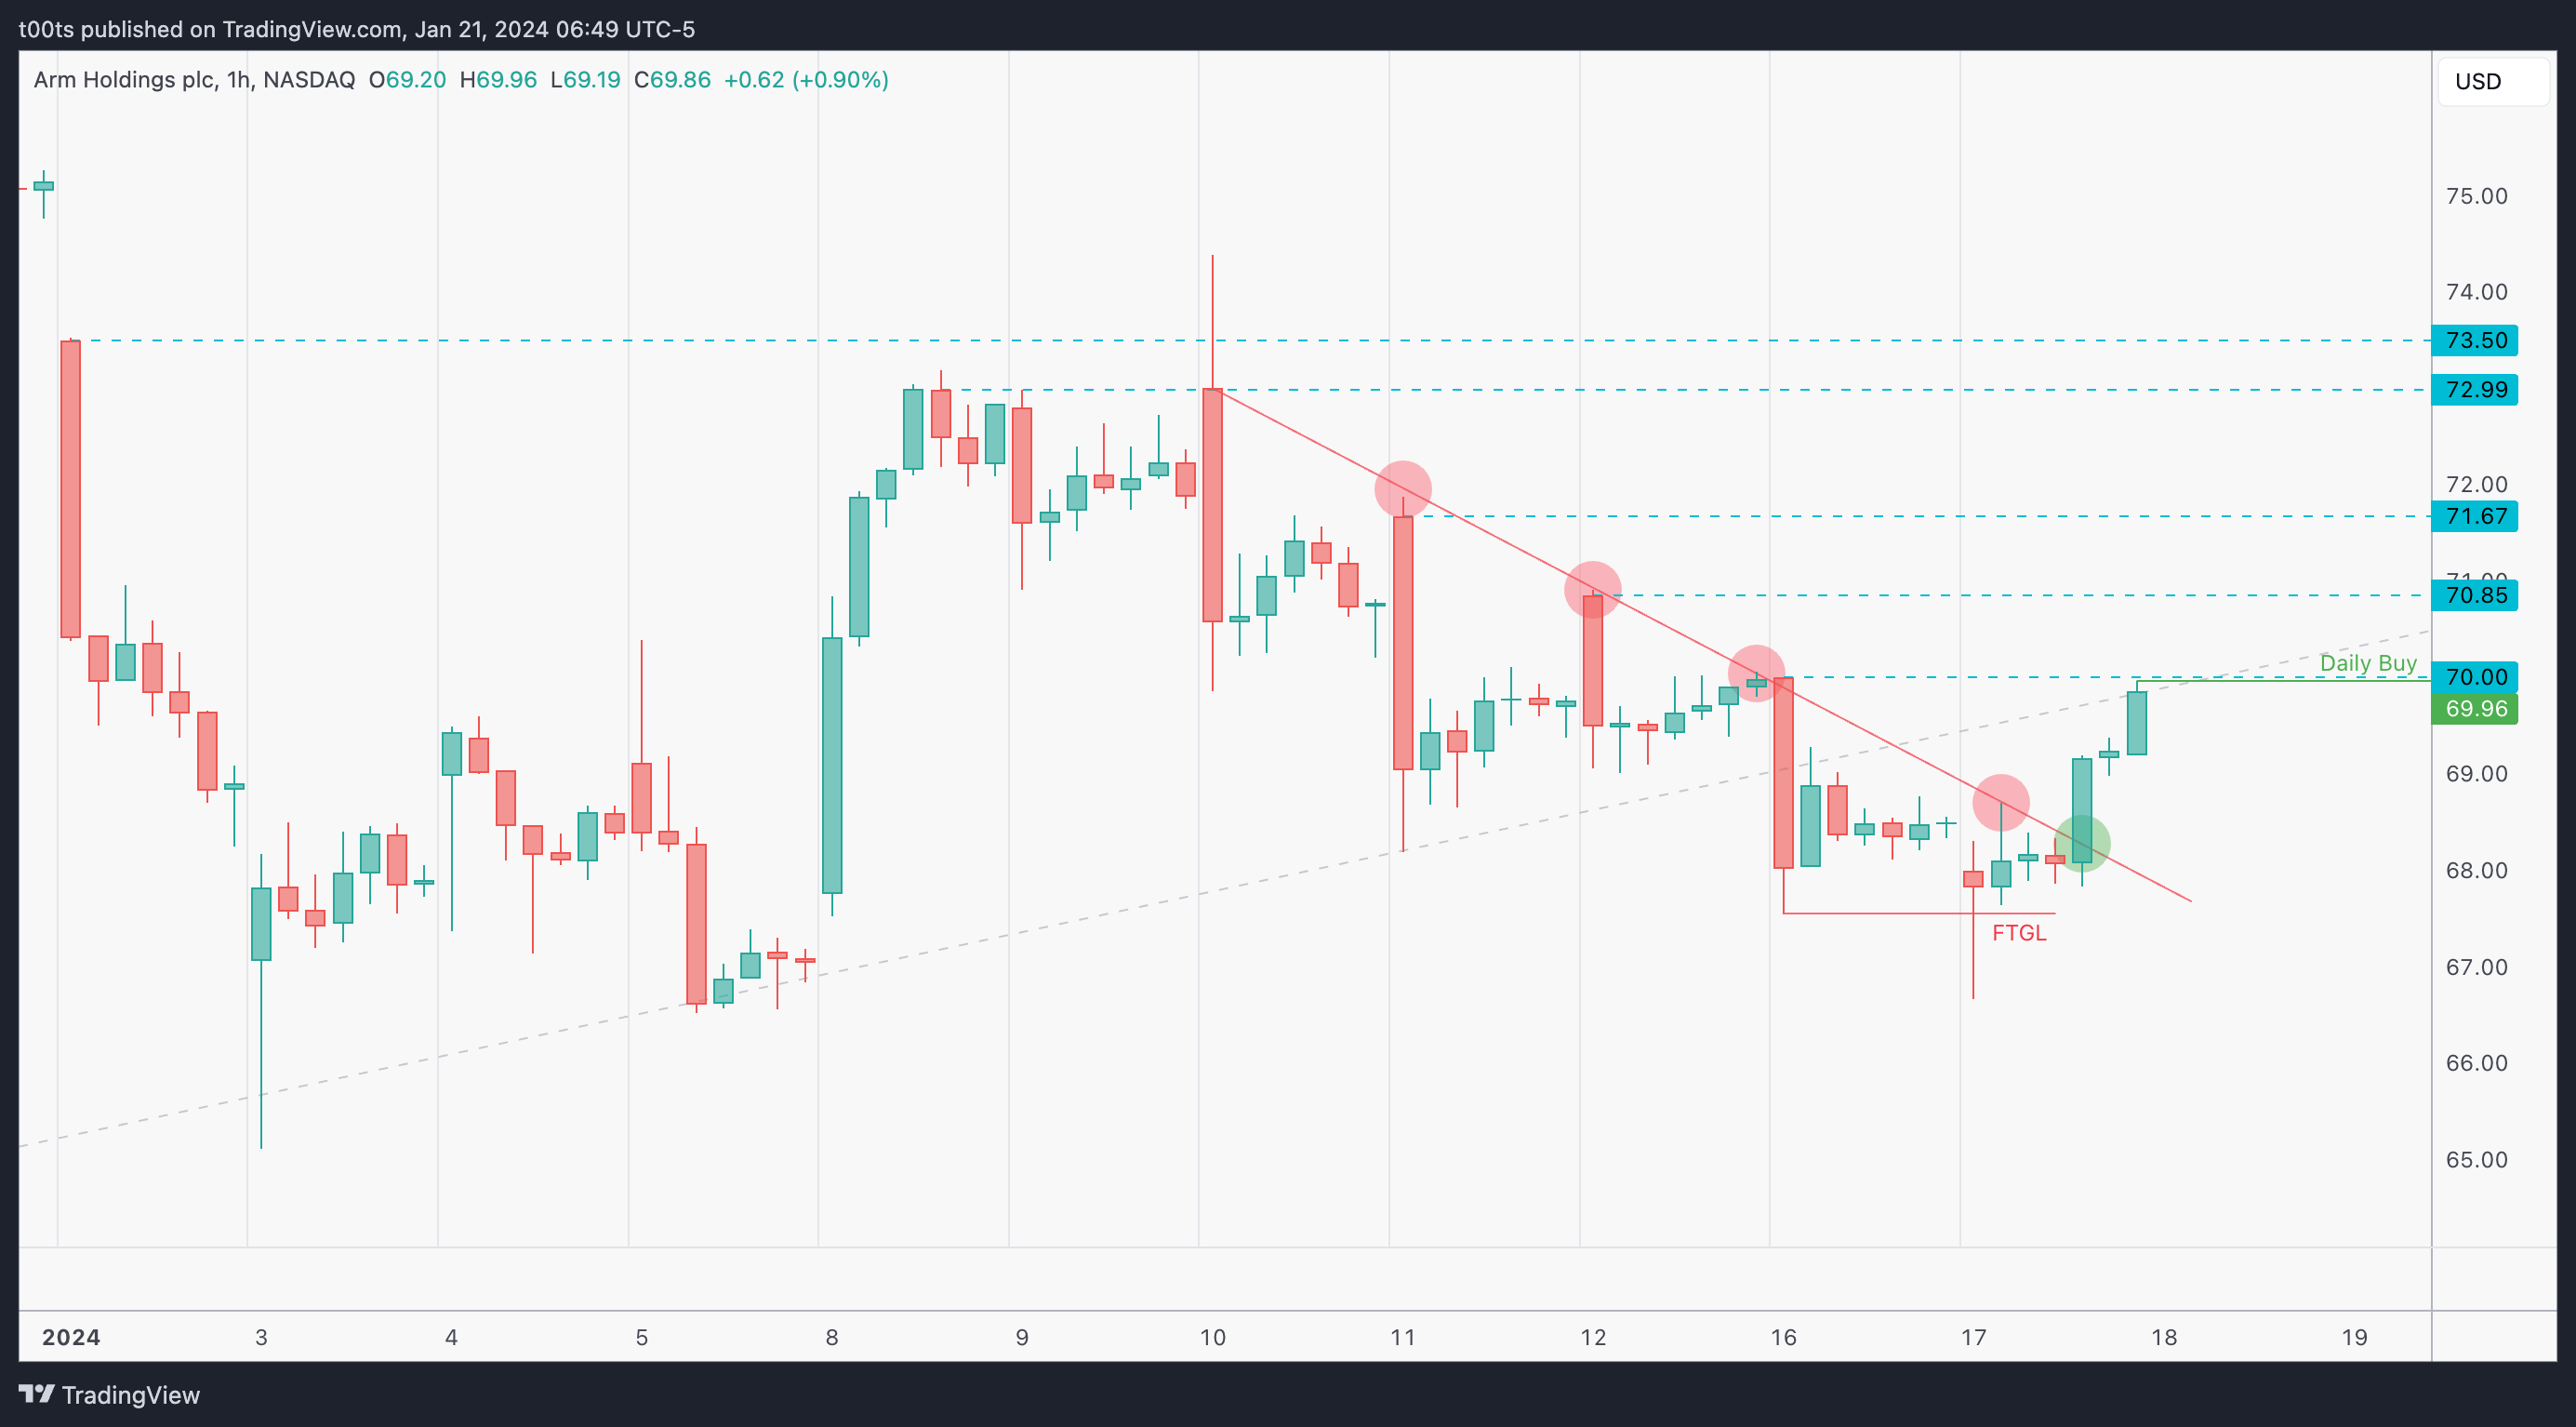
The most obvious thing worth highlighting on this chart is how price broke the downward trendline after attempting to fade below previous day lows and bouncing back up. Our levels are clear and well spaced.
Pre-market action
On this day, all the semiconductor stocks were gapping up. AMD and NVDA were making new all-time highs, and ARM seemed like a great sympathy play to catch longs because, as opposed to its counterparts, it was coming right out of a pullback. AMD and NVDA both looked somewhat extended. In fact, we went over the AMD short already.
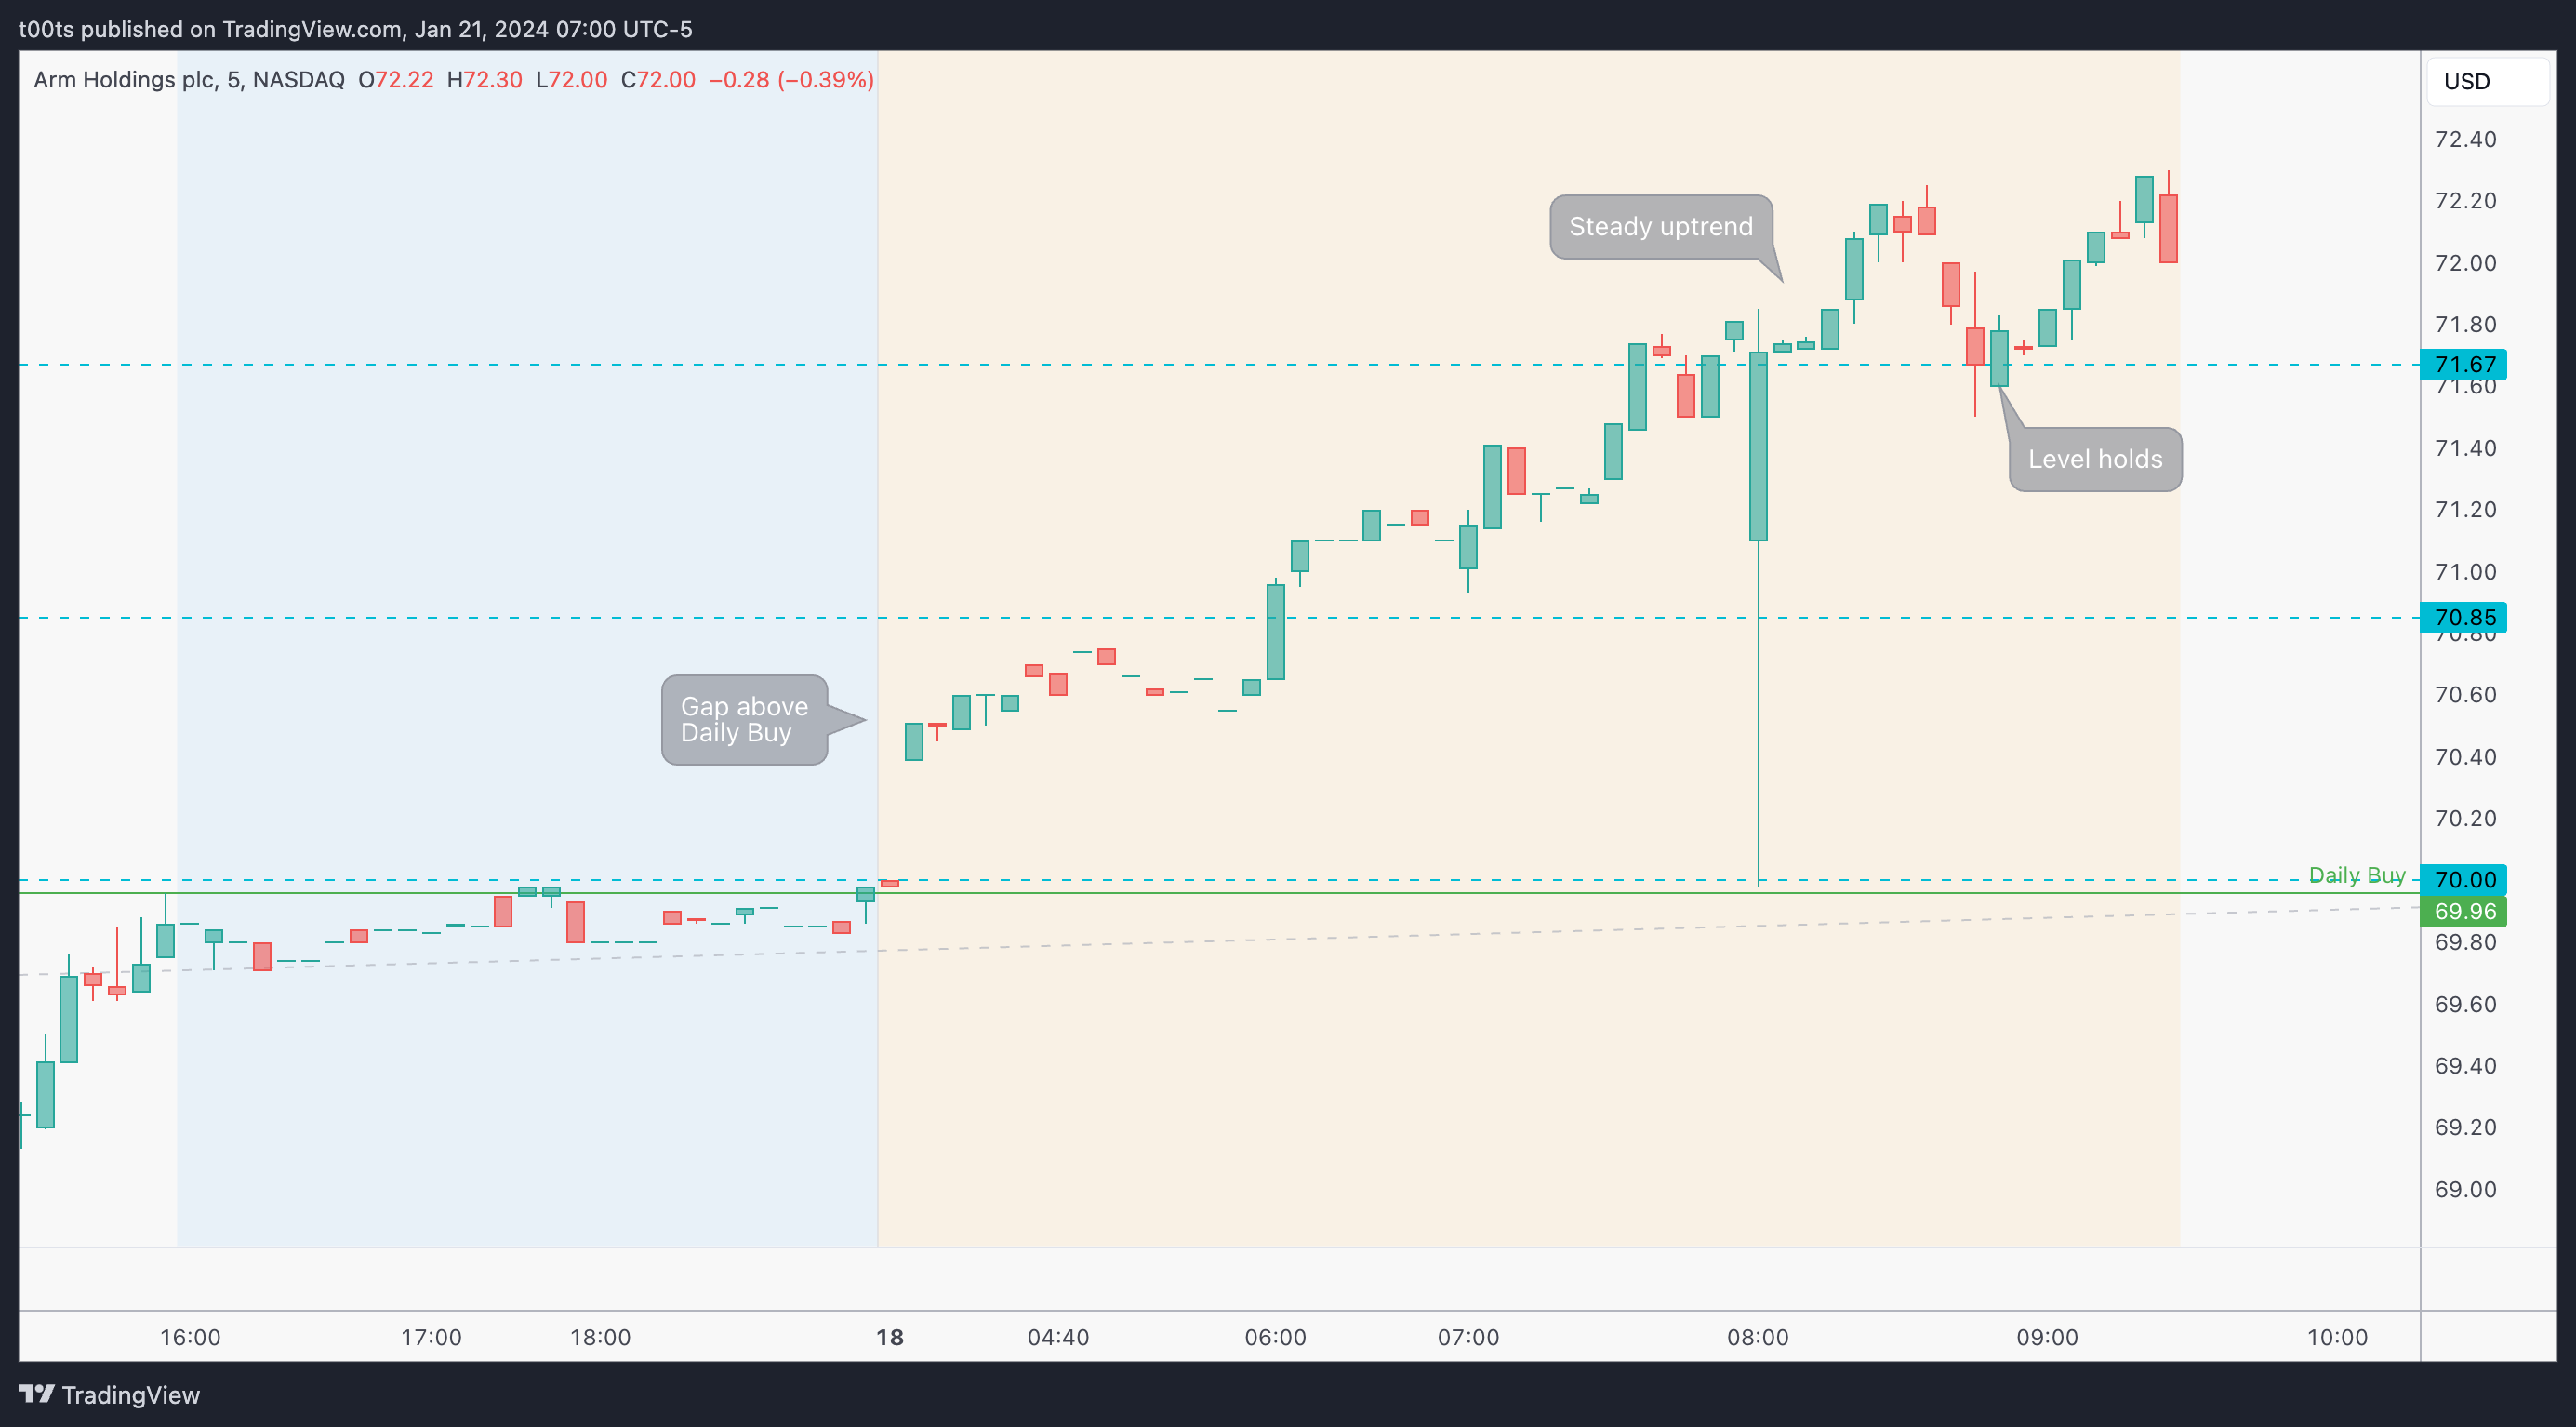
ARM gaps up above our Daily Buy trigger and displays a steady uptrend during the whole pre-market. Notice how the $71.67 held the pullback. This level becomes our reference for conservation of momentum to the upside.
The trade
Very straightforward trade because it worked straight from the start. The key was identifying this stock as a better candidate for longs, while still keeping an eye on the sector leaders to know when to exit.
Using our CPT Framework:
Cue(s)
Weekly uptrend with recent failure to go lower
Whole sector gapping up, with key names making ATH's
Stock coming out of a notable pullback (lagging vs. the overall sector)
Stock gapping above daily buy trigger
Reference level holding in the pre-market
Plan
Watch reactions around the $71.67 level to take a long entry and ride the momentum while it lasts. Ideally we want to see a bounce at $71.67 with a reclaim of the opening print.
Trigger
Price back above the opening print after bouncing off the level, or a 2m buy setup.
2m chart (early morning entry details)
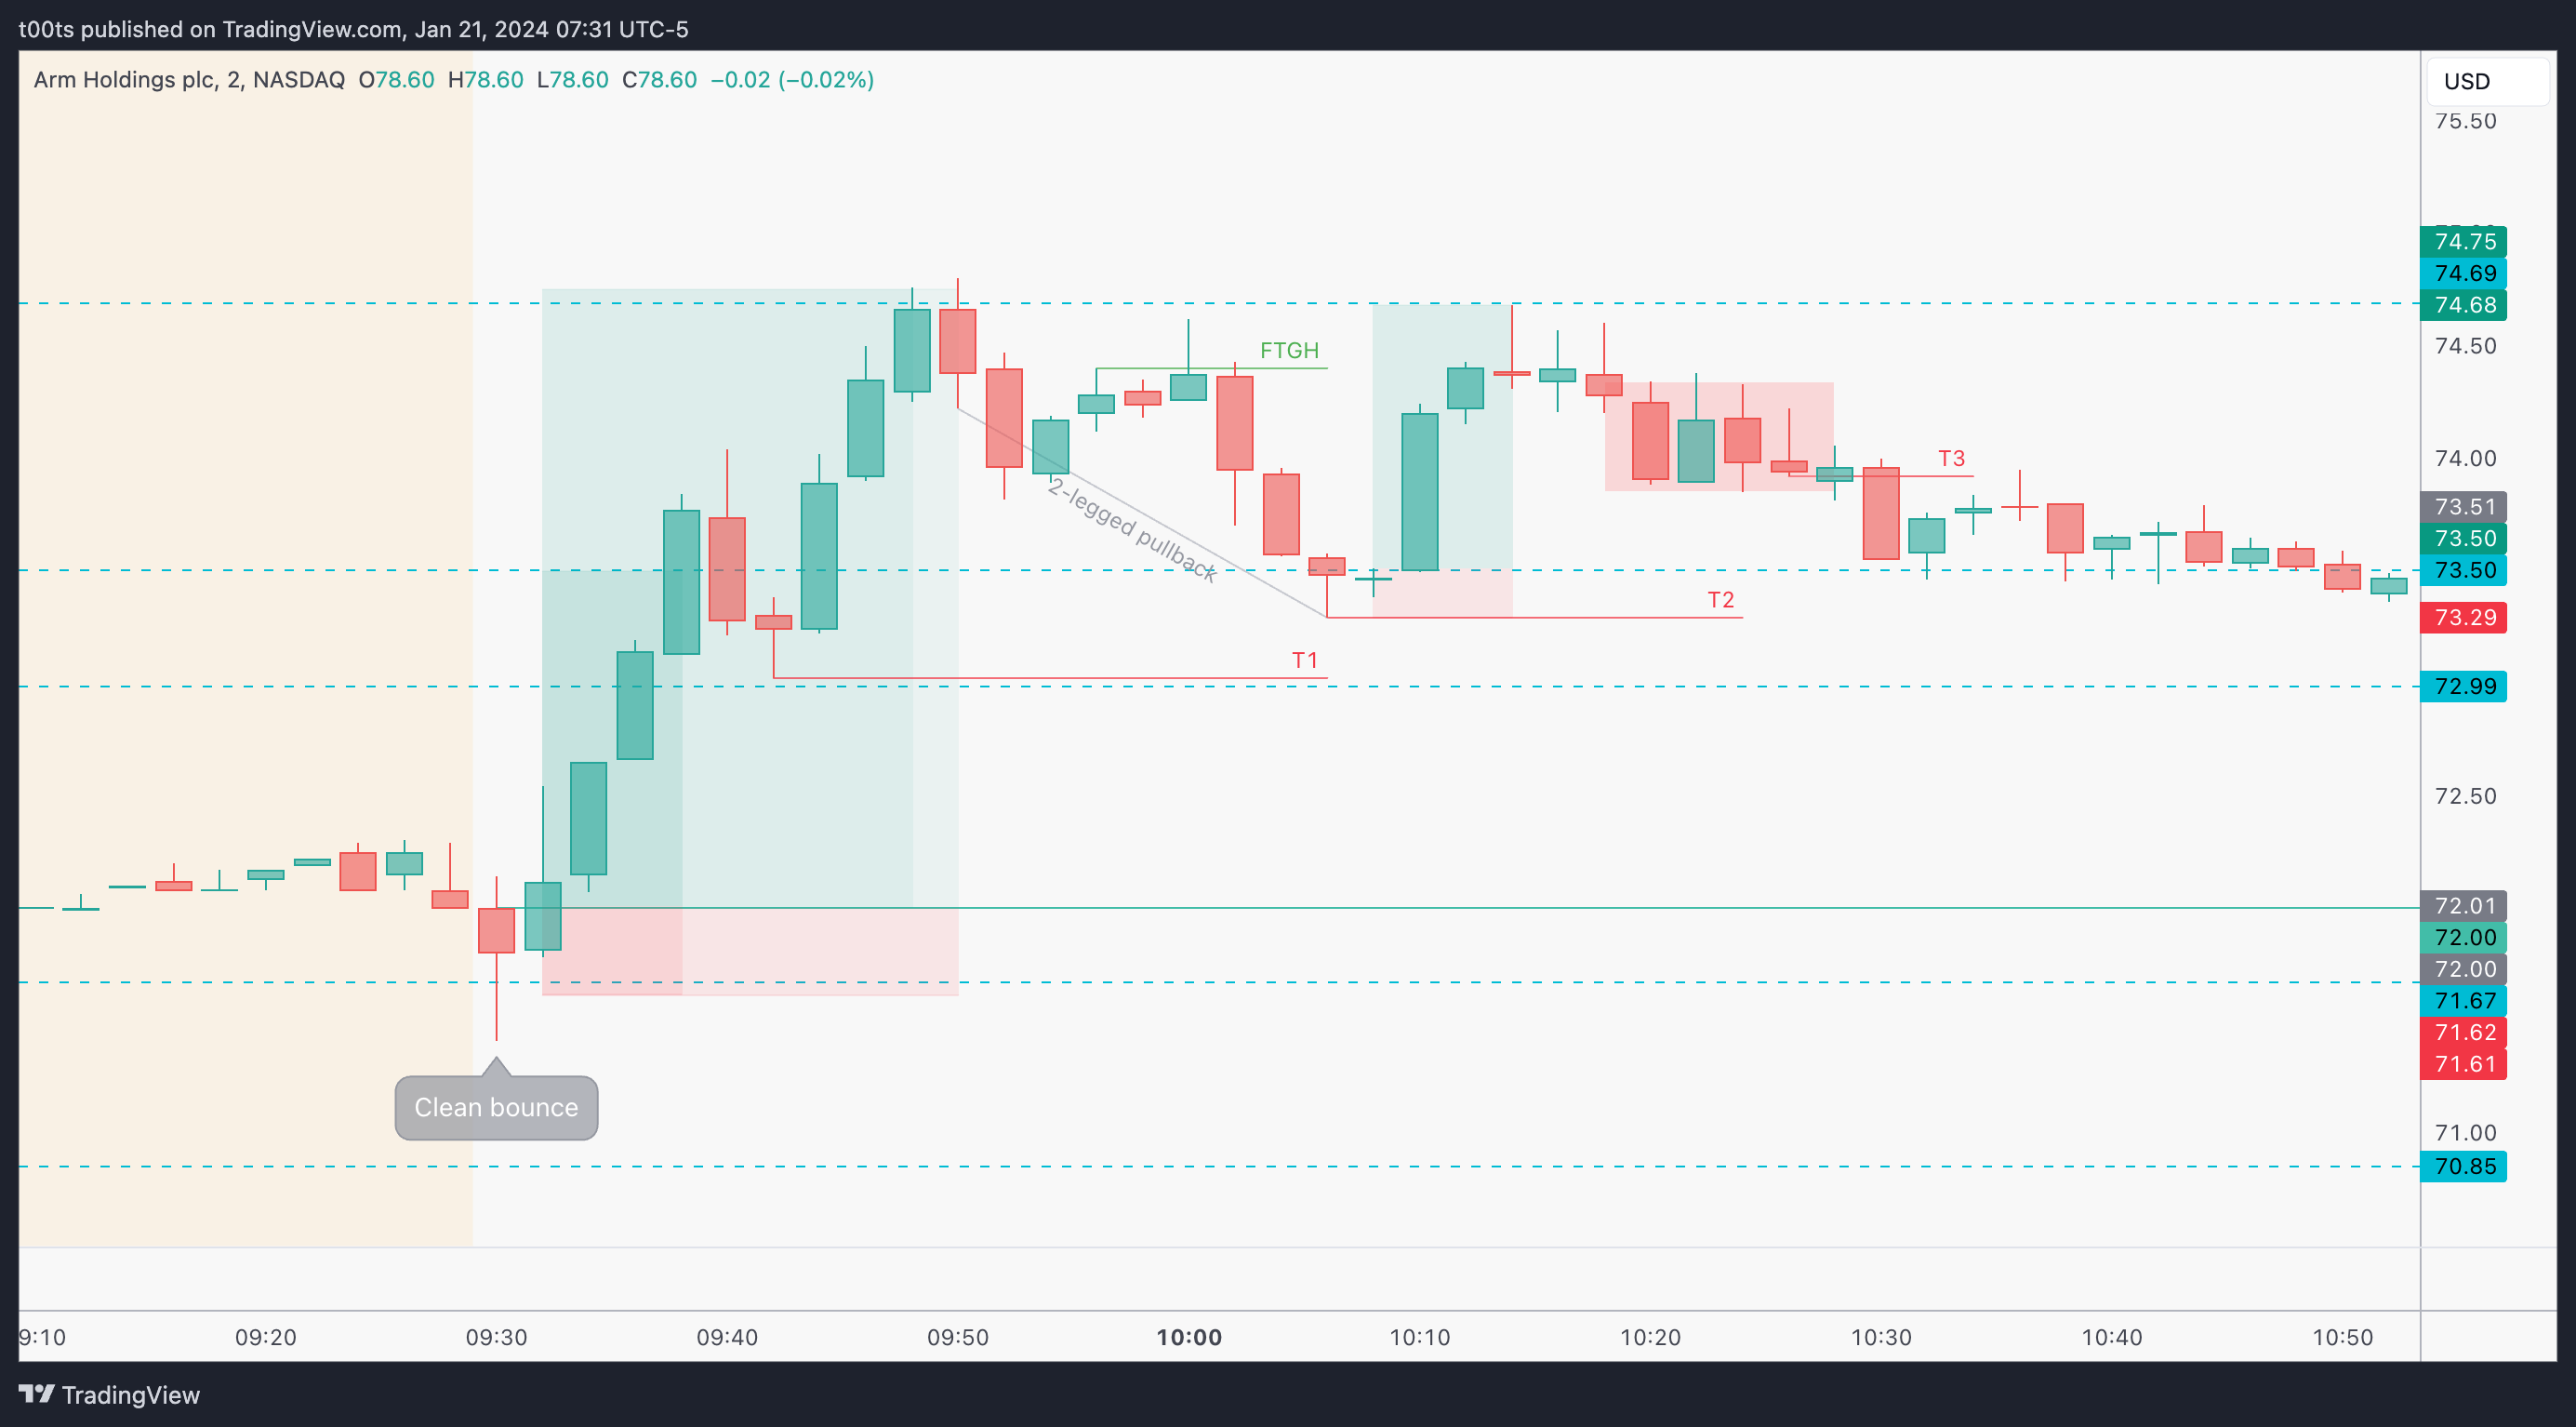
Straight off the open we get exactly what we need: a confirmation that the momentum is still there. Buyers hold the level and bring price back above the opening print. Here's our first planned entry. We had a few levels above to scale out of this position offering 2:1, 4:1 and 7:1 trades respectively. All hit.
The $74.69 level rejects and price makes a two-legged pullback that culminates with a tiny inside doji bar at a level. These are my absolute favourite setups because the risk to reward is so favorable they are always worth taking. Great opportunity to add or take a second entry.
Price loses momentum after attempting new daily highs and starts ranging on the 2m chart until eventually a bearish inside bar breaks down. The lack of strength on ARM together together with AMD showing signs of breaking down were solid reasons to exit.
5m chart
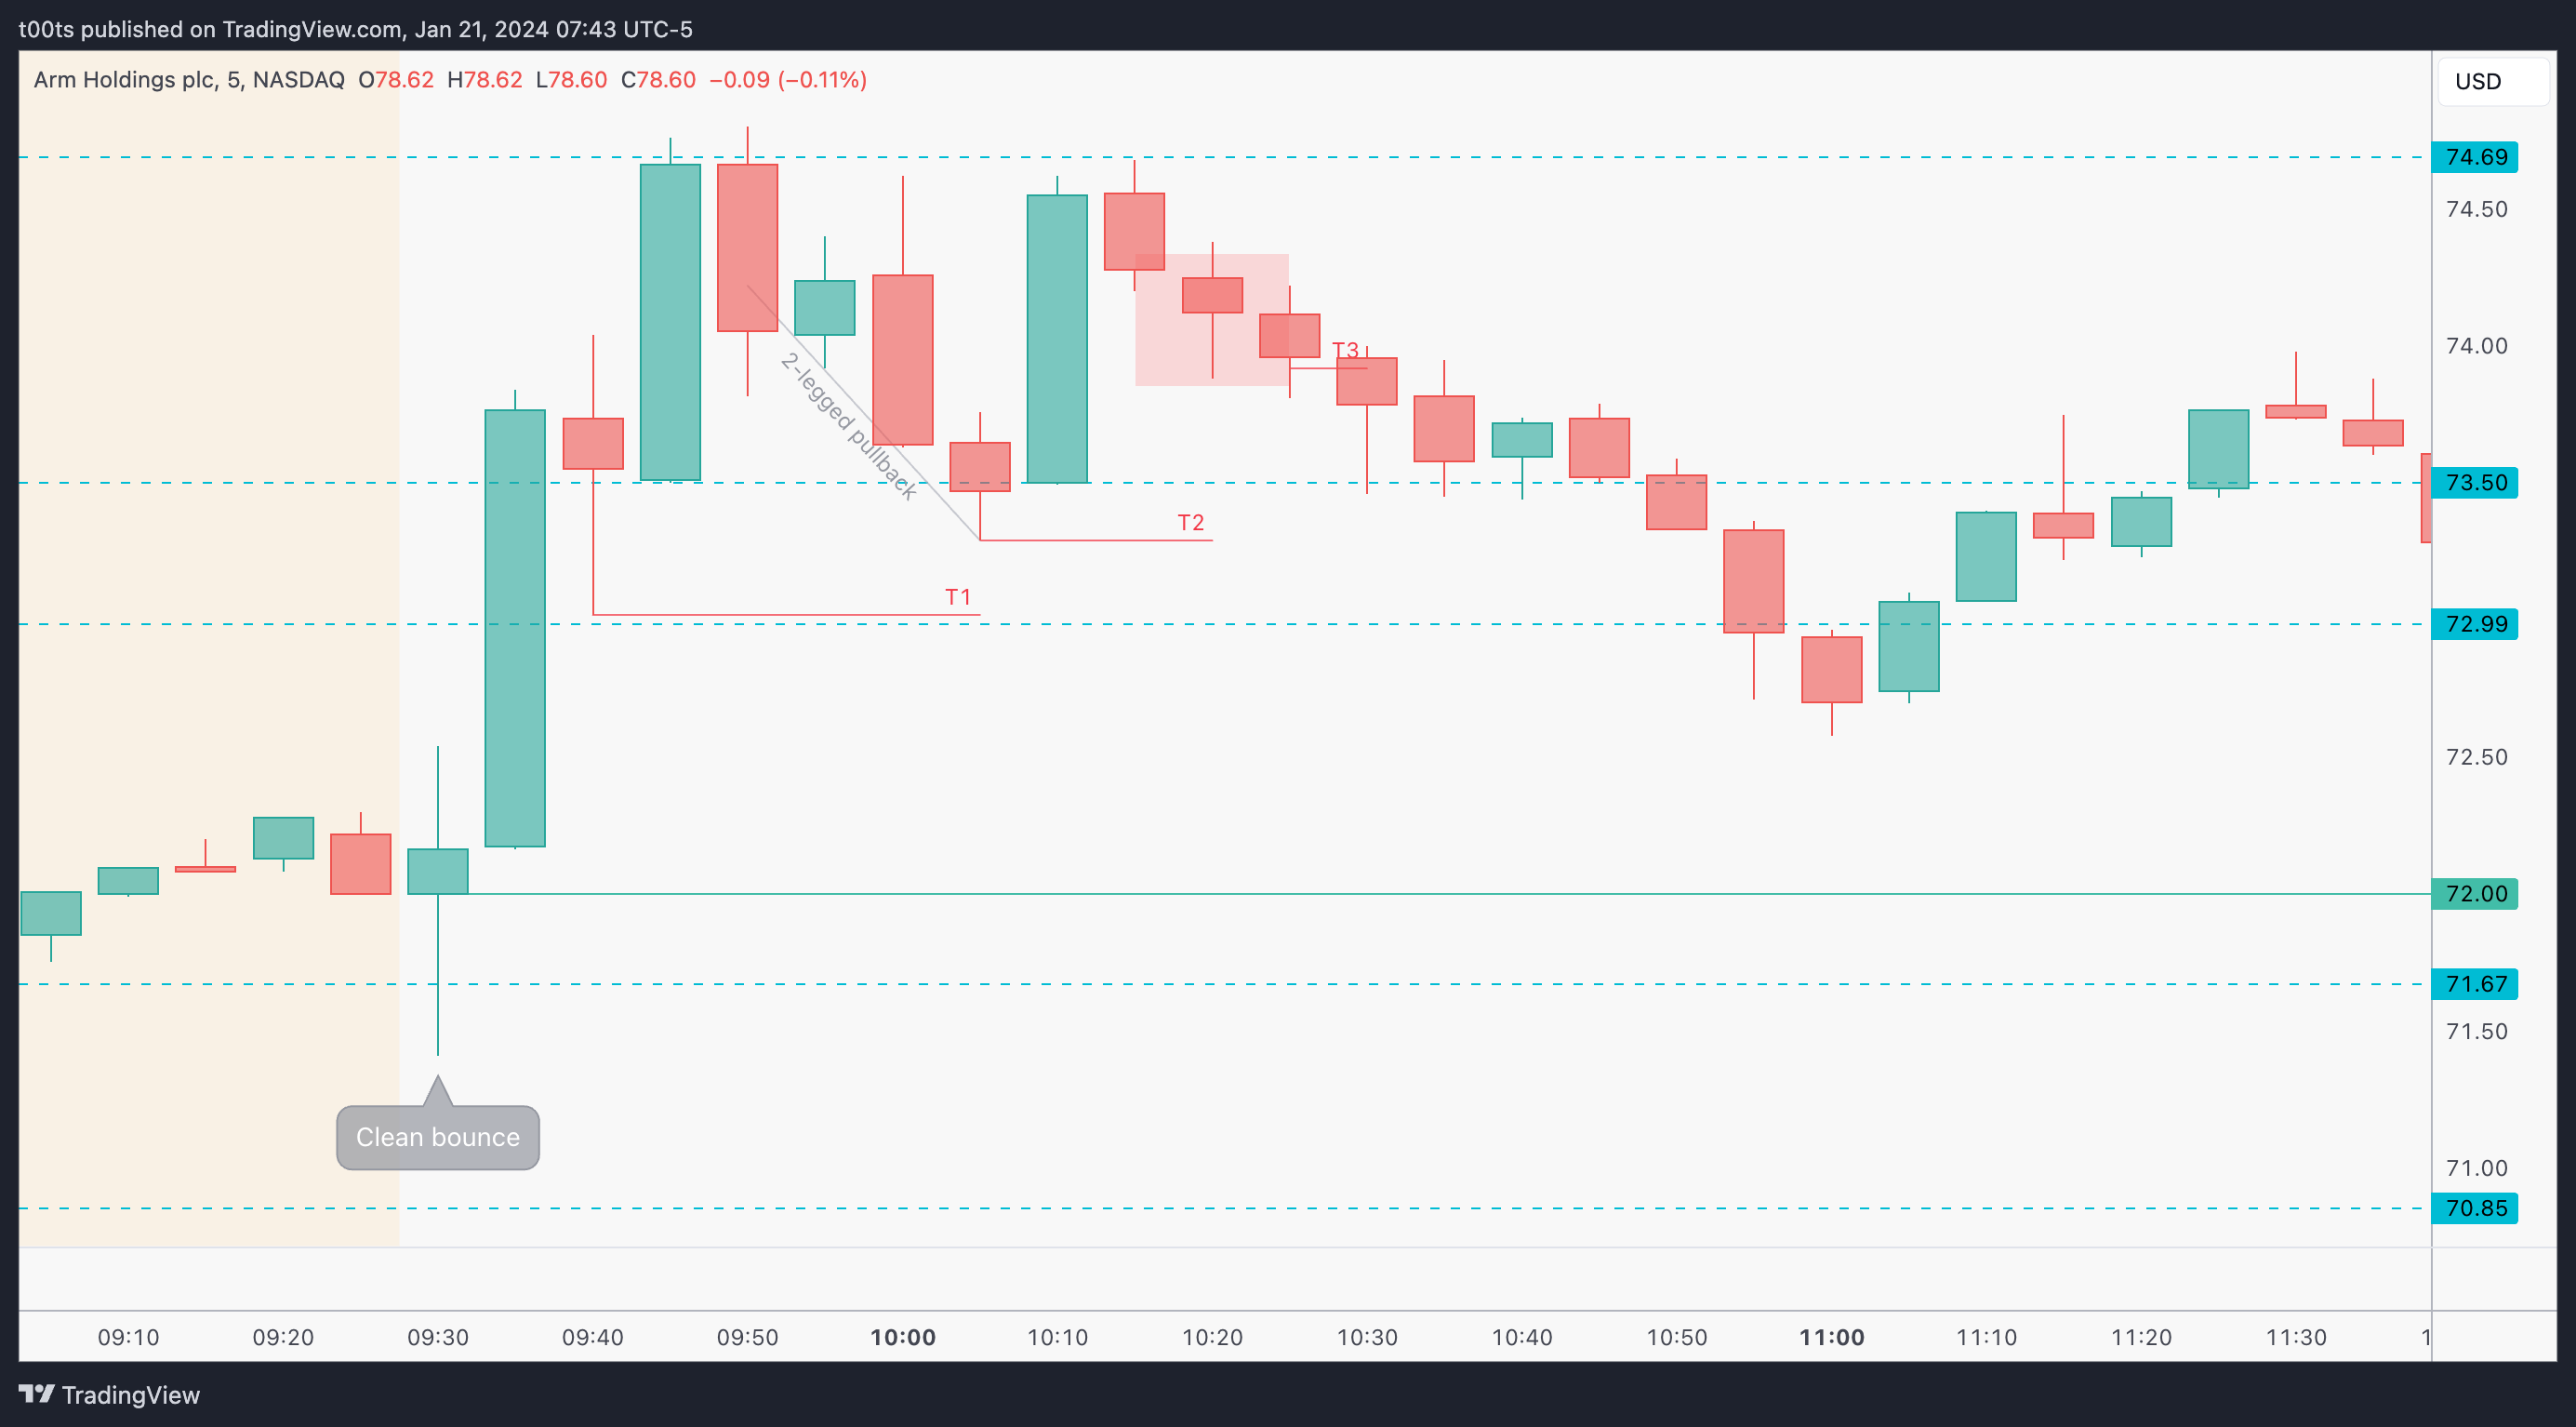
Here's a 5m chart just for reference. As usual, when a trade is an opening drive play, most of the focus is naturally on the lower timeframes. The 2m chart above was really what I was trading off of, so there's not much to comment here.
Closing notes
I rarely have two positions open at the same time, and I'm not sure I've ever had opposite positions in two stocks that belong to the same sector. I liked how I was gauging the ARM trade using AMD as my reference. ARM actually did a really good job holding the trend after AMD topped. Once again, ARM was a better vehicle for longs because it was in a better position from a higher timeframe perspective. AMD had a bunch of reasons that favoured the short play. We took both, and both worked.
I am posting one trade writeup every day throughout 2024. I focus on large caps using levels and price action. The subscription is absolutely free and will always be. I will strive to provide value by offering clues and ideas for you to enhance your edge. Let’s grow together!