

Higher timeframe context
AMD and the whole semiconductor industry have been leading the market for the past few months. The recent $500 breakout on NVDA has been pushing the semis even further. AMD seems to have no breaks as it paves its way into prices we haven’t seen since late 2021.
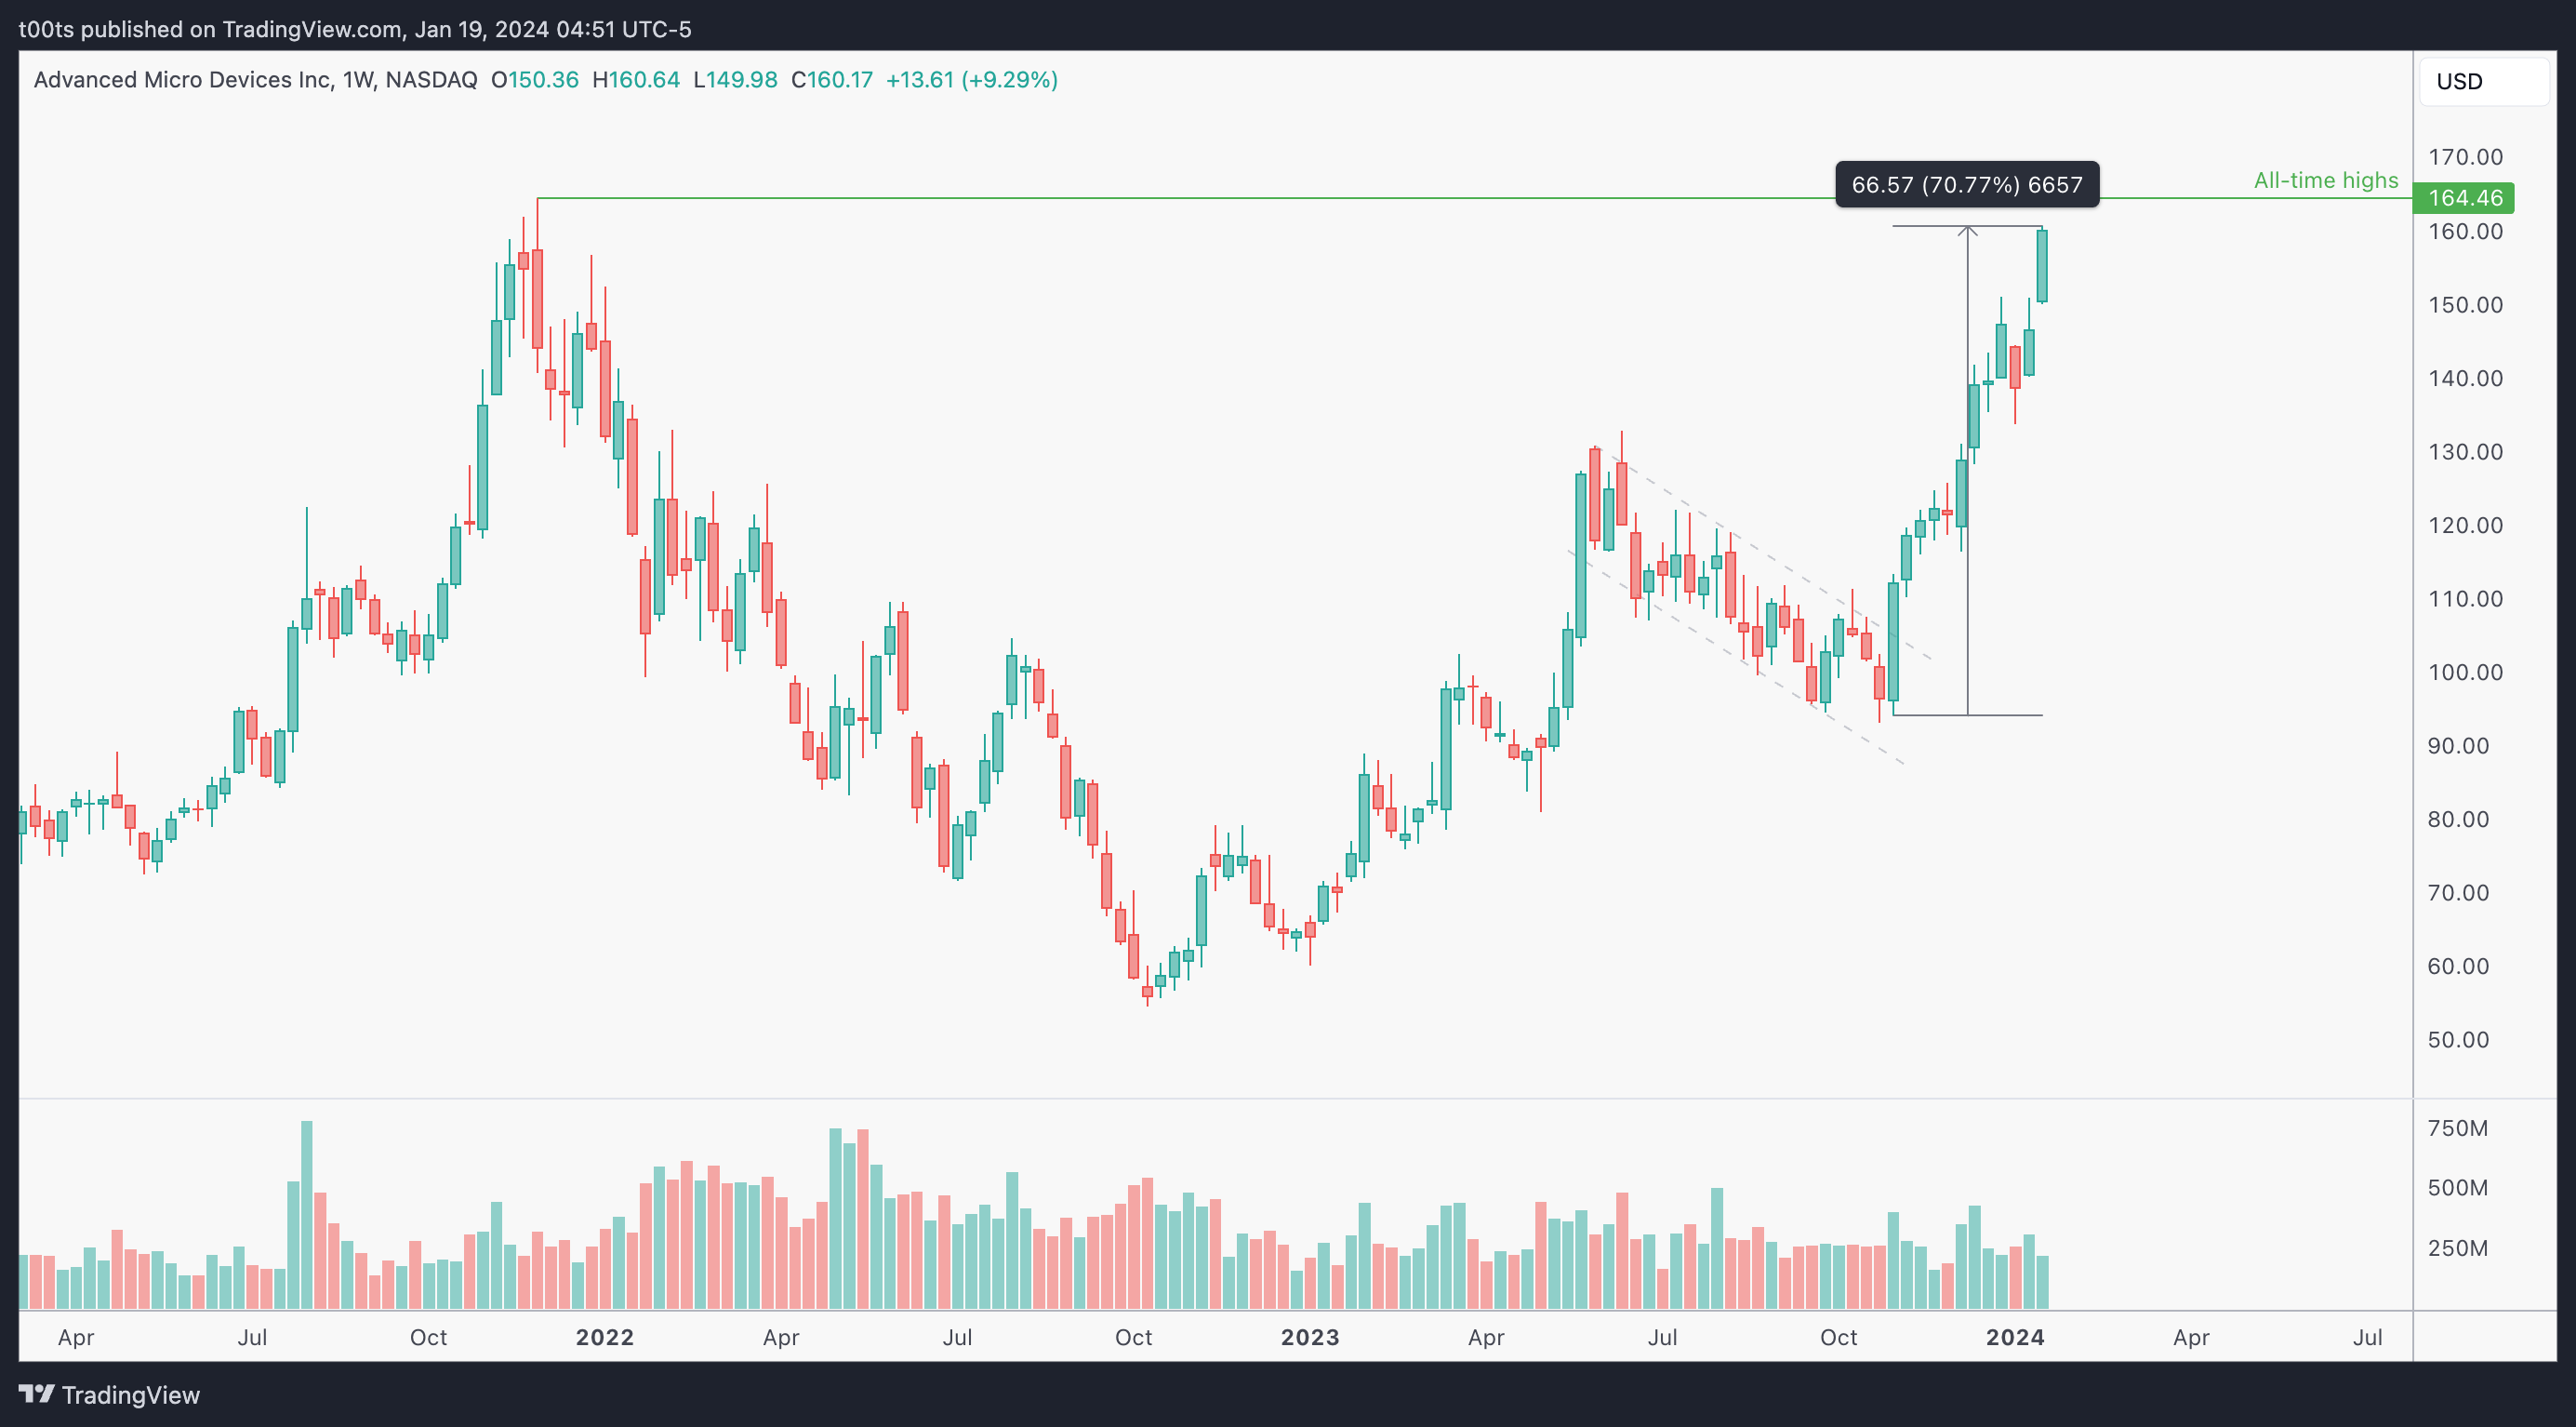
Weekly chart
I've kept this weekly chart clean for a reason. There's just two things I want to bring focus to:
Almost at all-time highs.
Over 70% of appreciation in value in the past two and a half months.
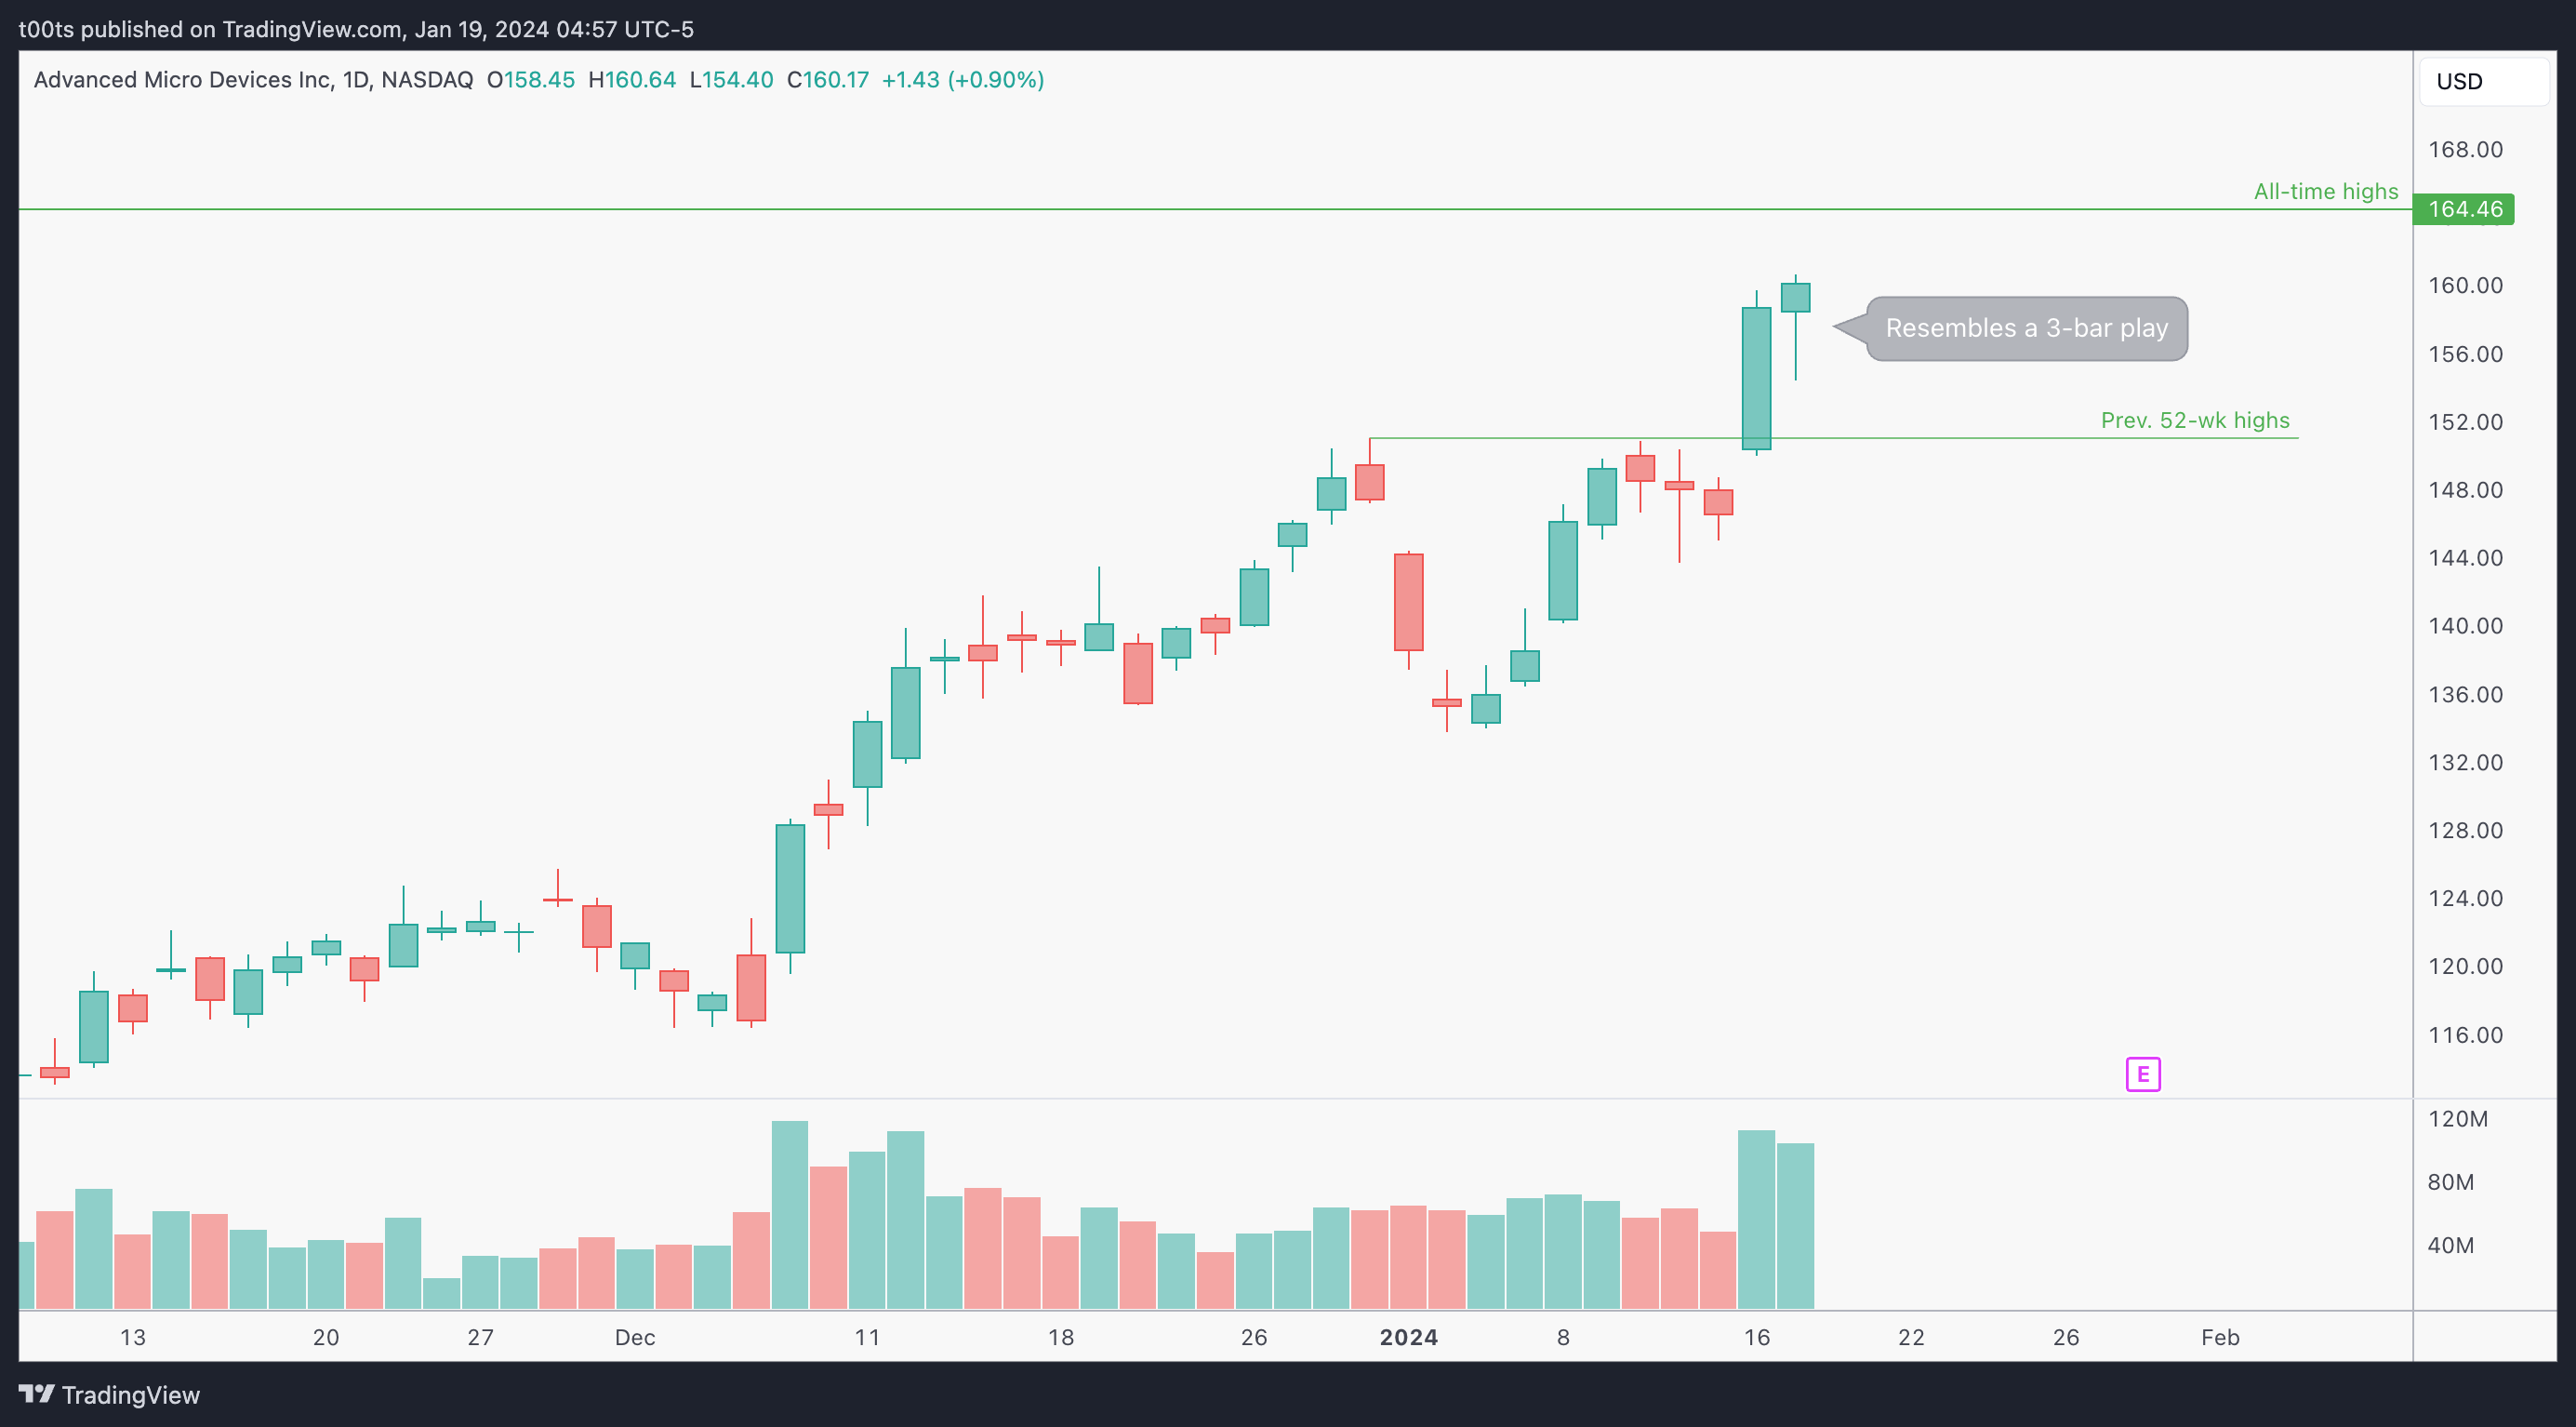
Daily chart
First thing we see is a very solid breakout of previous 52-week highs. We actually covered this trade a couple days ago.
Looks like buyers have kept bidding the prices higher, setting up a daily chart that resembles a bullish 3-bar play, where we actually closed above previous day highs. The strength on this name is truly amazing.
While 2021 taught us that there's no such thing as being extended, it's not normal for a large cap to see a 70% increase in value in such a short time span. With this huge momentum, it's very likely price makes new all-time highs soon. These price marks usually act as magnets, as there's liquidity sitting above and big players who've been buying this rally need that liquidity to unload their positions without moving the market too much.
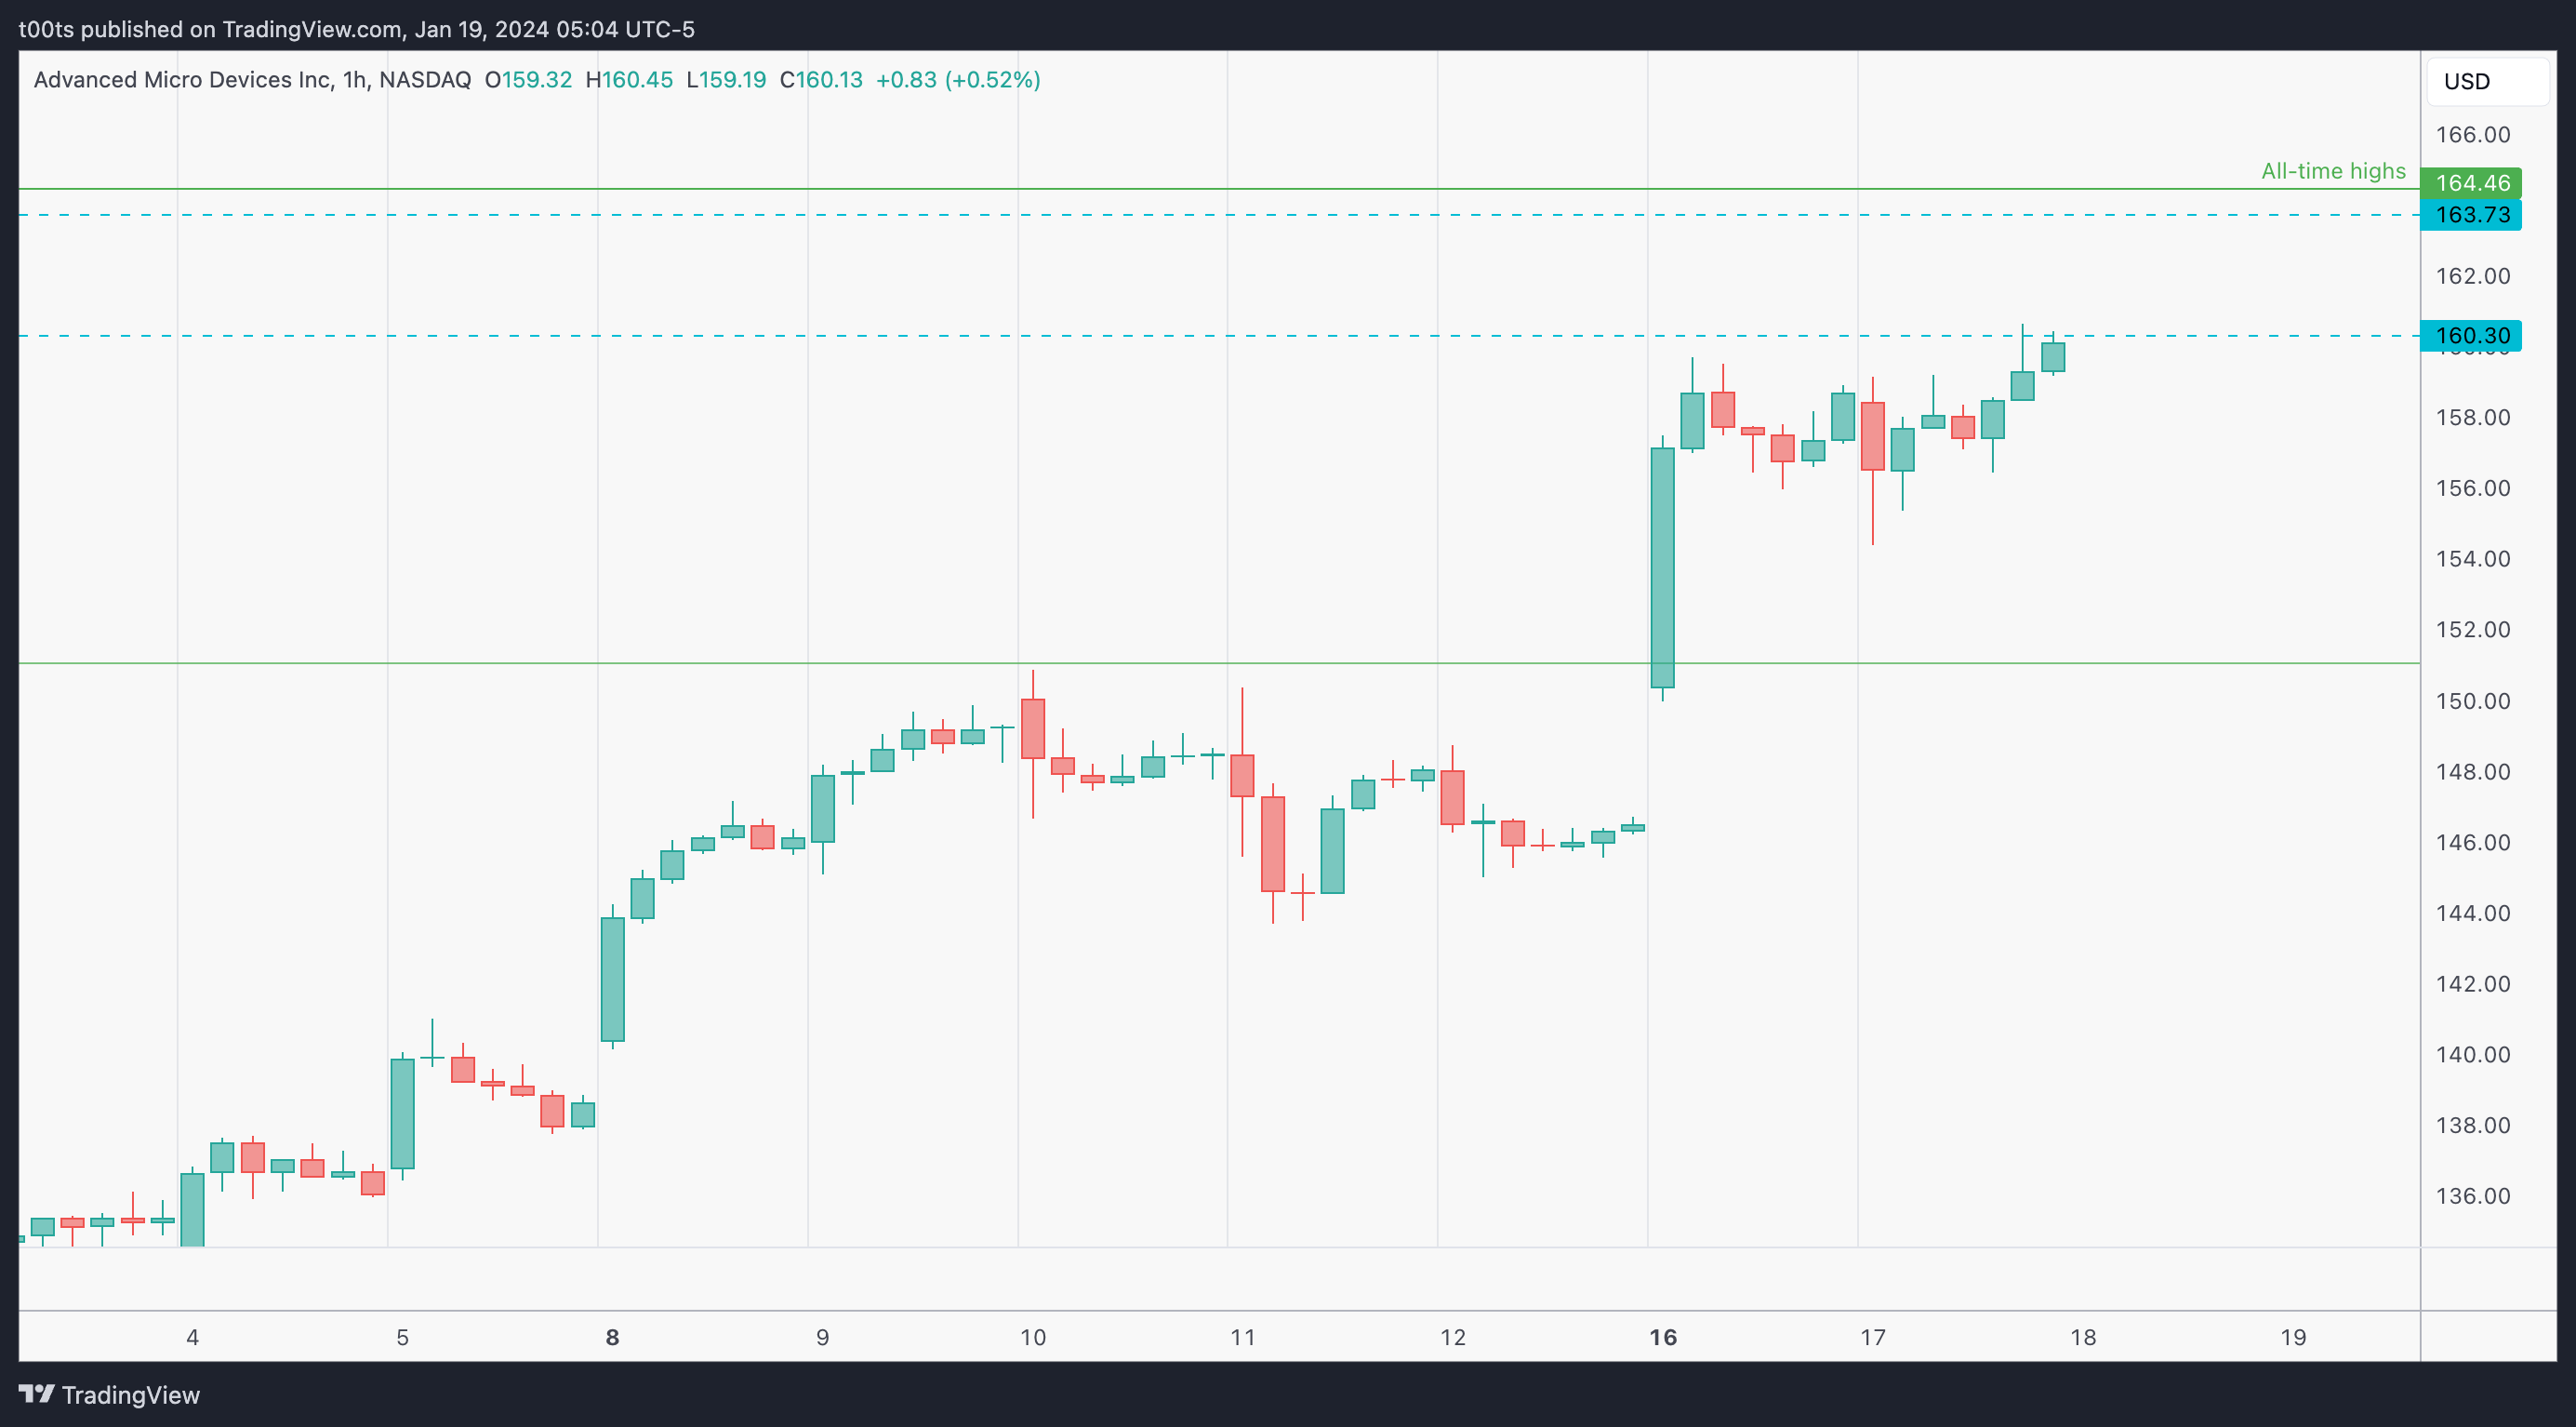
Hourly chart
This hourly chart doesn't give us any new information besides these two levels, $160.30 and $163.73 from late 2021, which are followed by the all-time highs sitting at $164.46. As usual, we can use these levels to risk off of, so despite not giving us anything obvious, we're still interested in always going over the hourly chart.
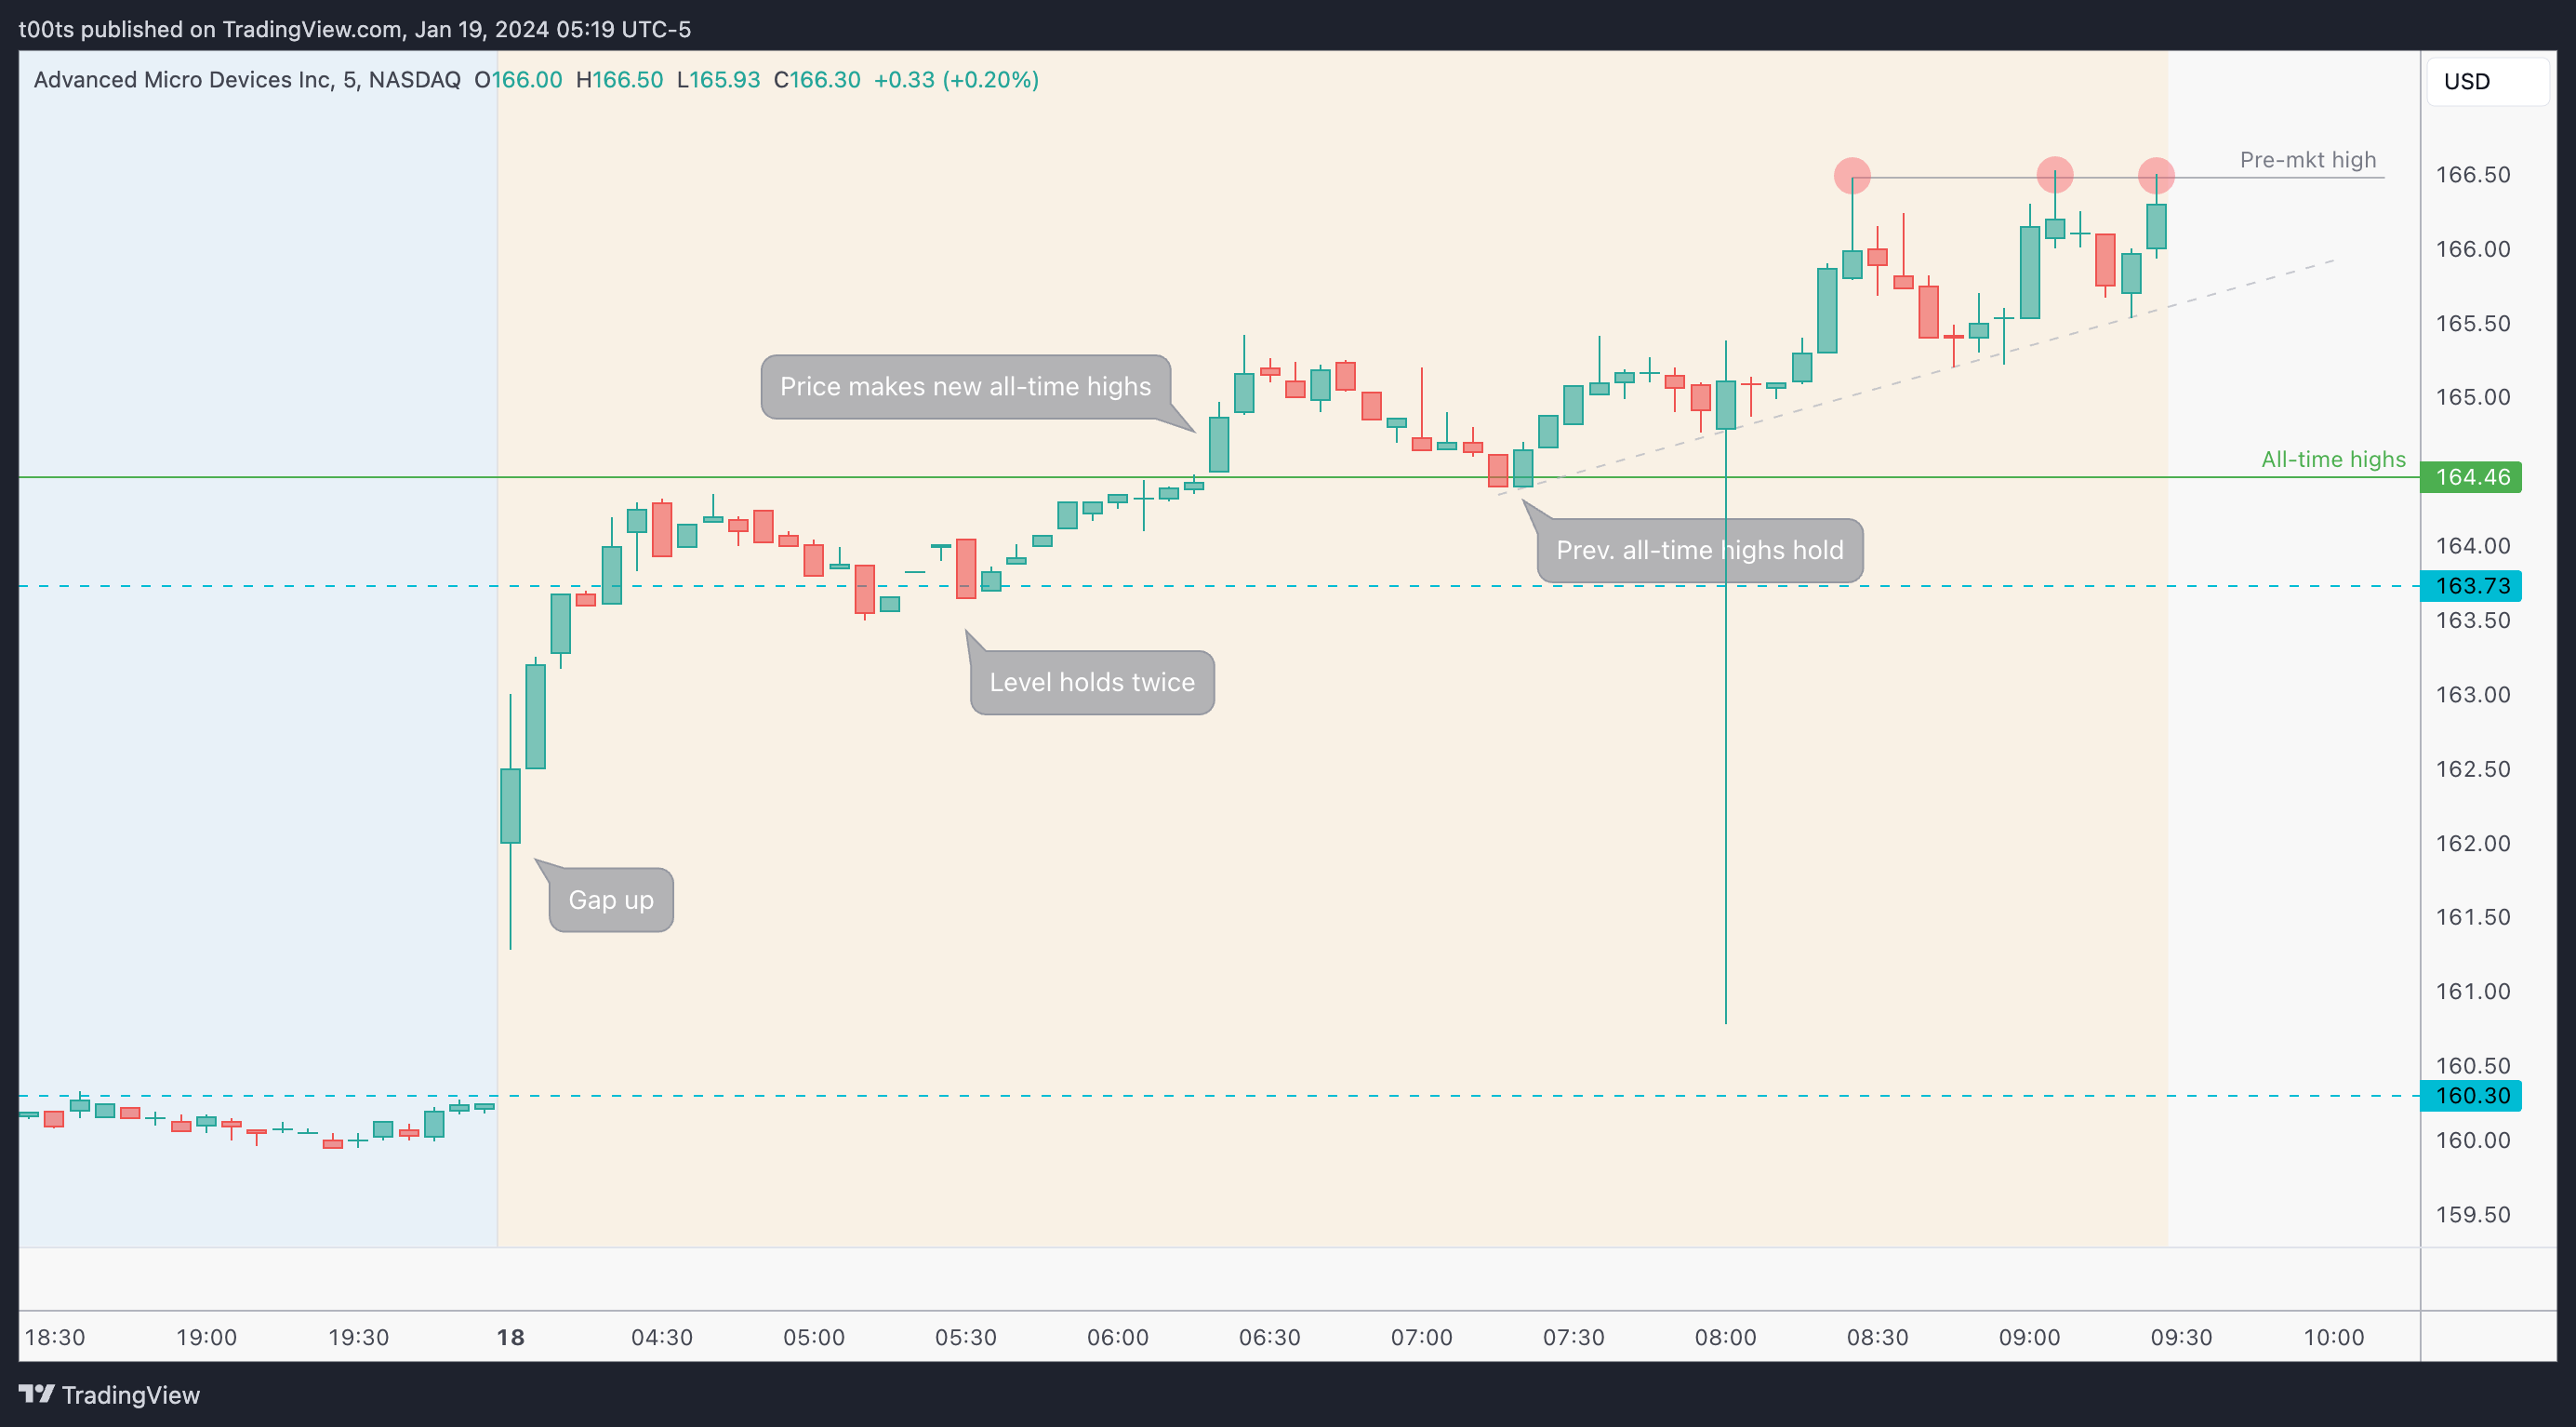
Pre-market action
Most chips were gapping up this day. NVDA was making new all-time highs and ARM, a stock I've been liking lately, was also on the move. (I actually traded ARM this day as well, will post a recap later this week)
As we can see on the chart below, AMD is already making new all-time highs, showing a super healthy uptrend after gapping up at 4am. This doesn't go unnoticed to traders. There will for sure be a lot of eyes on this name today. Something I noticed was this triple top at pre-market highs going into the open.
There's a strategy I learned from my brother Somesh which he calls the “Suckers strategy”. This strategy involves trading against trapped traders on names that are gapping up or down. If you're interested in the complete blueprint, you can text him on Instagram and he'll send it to you for free. I bring this up because at this point I'm actually interested in shorting a failure of that triple top pre-market high.
The trade
The plan was to short this name all along. So much momentum into a strong liquidity level while leaving a huge overnight gap below, I frankly couldn't help but feel that the risk-to-reward was skewed to the downside at this point.
Using our CPT Framework:
Cue(s)
Market-leading stock in a strong sector
Gapping up above all-time highs
Stock up almost 80% in 10 weeks (overextended?)
Potential liquidity area for longs to offload positions
Triple top on the pre-market heading into the bell
+5pt overnight gap below
Plan (1)
First plan, as I outlined in the pre-market section, was to let the pre-market high break and fail, and then short the opening print risking against the high of day, targeting the gap fill below.
Trigger (1)
Price getting below the opening print.
2m chart
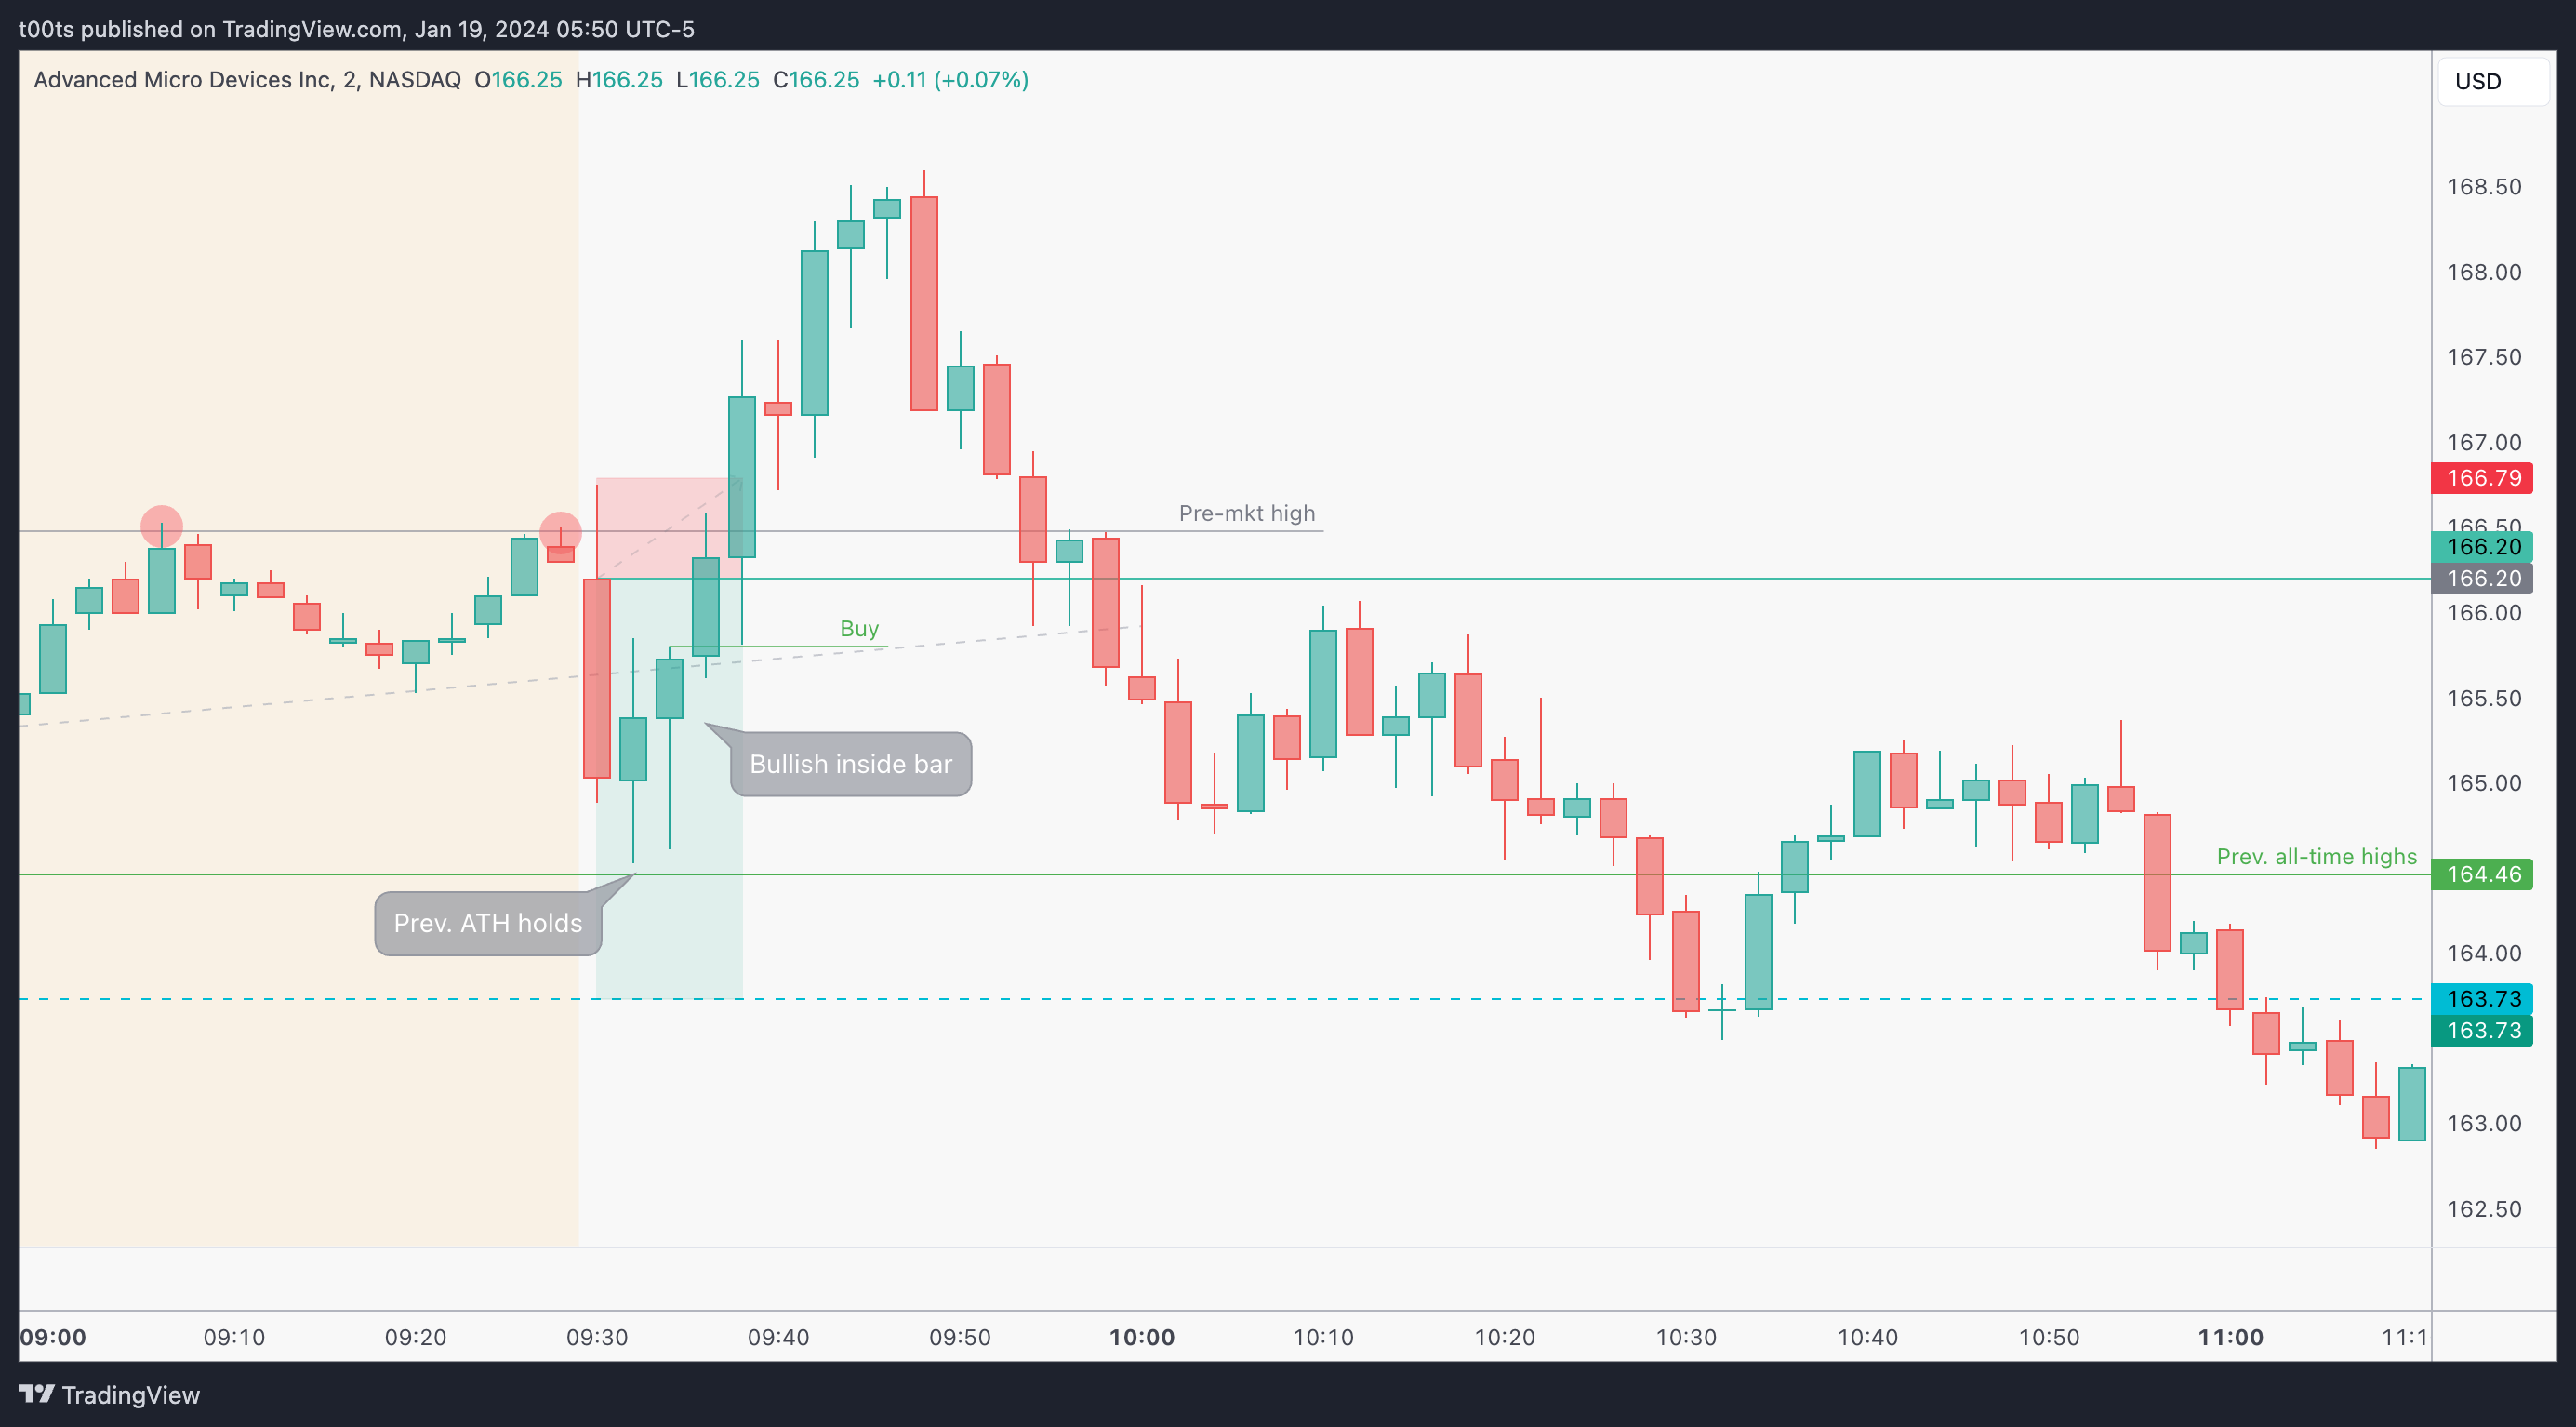
This was my first attempt at shorting the pre-market failure straight off the open. I got stopped out on this one.
My size was small on this trade, and I was long on ARM as well, so I wasn't giving it all the attention it deserved. In hindsight, I could've got out slightly green after that bullish inside bar breaks to the upside (labeled “Buy”). I sat there waiting to see if the open rejected again, and for a second it seemed like it would, but buyers came in strong and as soon as they broke the pre-market highs again I got out. Was worth a shot.
Plan (2)
For context, I'm sitting long in ARM (will review this one later this week) and it's starting to range. I notice the strong pullback on AMD. They're obviously correlated as they belong to the same sector. So, while I start keeping a close eye on my ARM long for a potential pullback, I notice a beautiful 2m buy setup forming right at the opening print on AMD. This 2m buy has formed off a 2m double bottom and looks good for both longs and shorts. Longs would keep the momentum going, shorts would break this 2m double bottom triggering short-term trader stops and potentially open the door for a trend below the opening print.
Trigger (2)
Price breaking over or under of the 2m buy signal bar.
2m chart
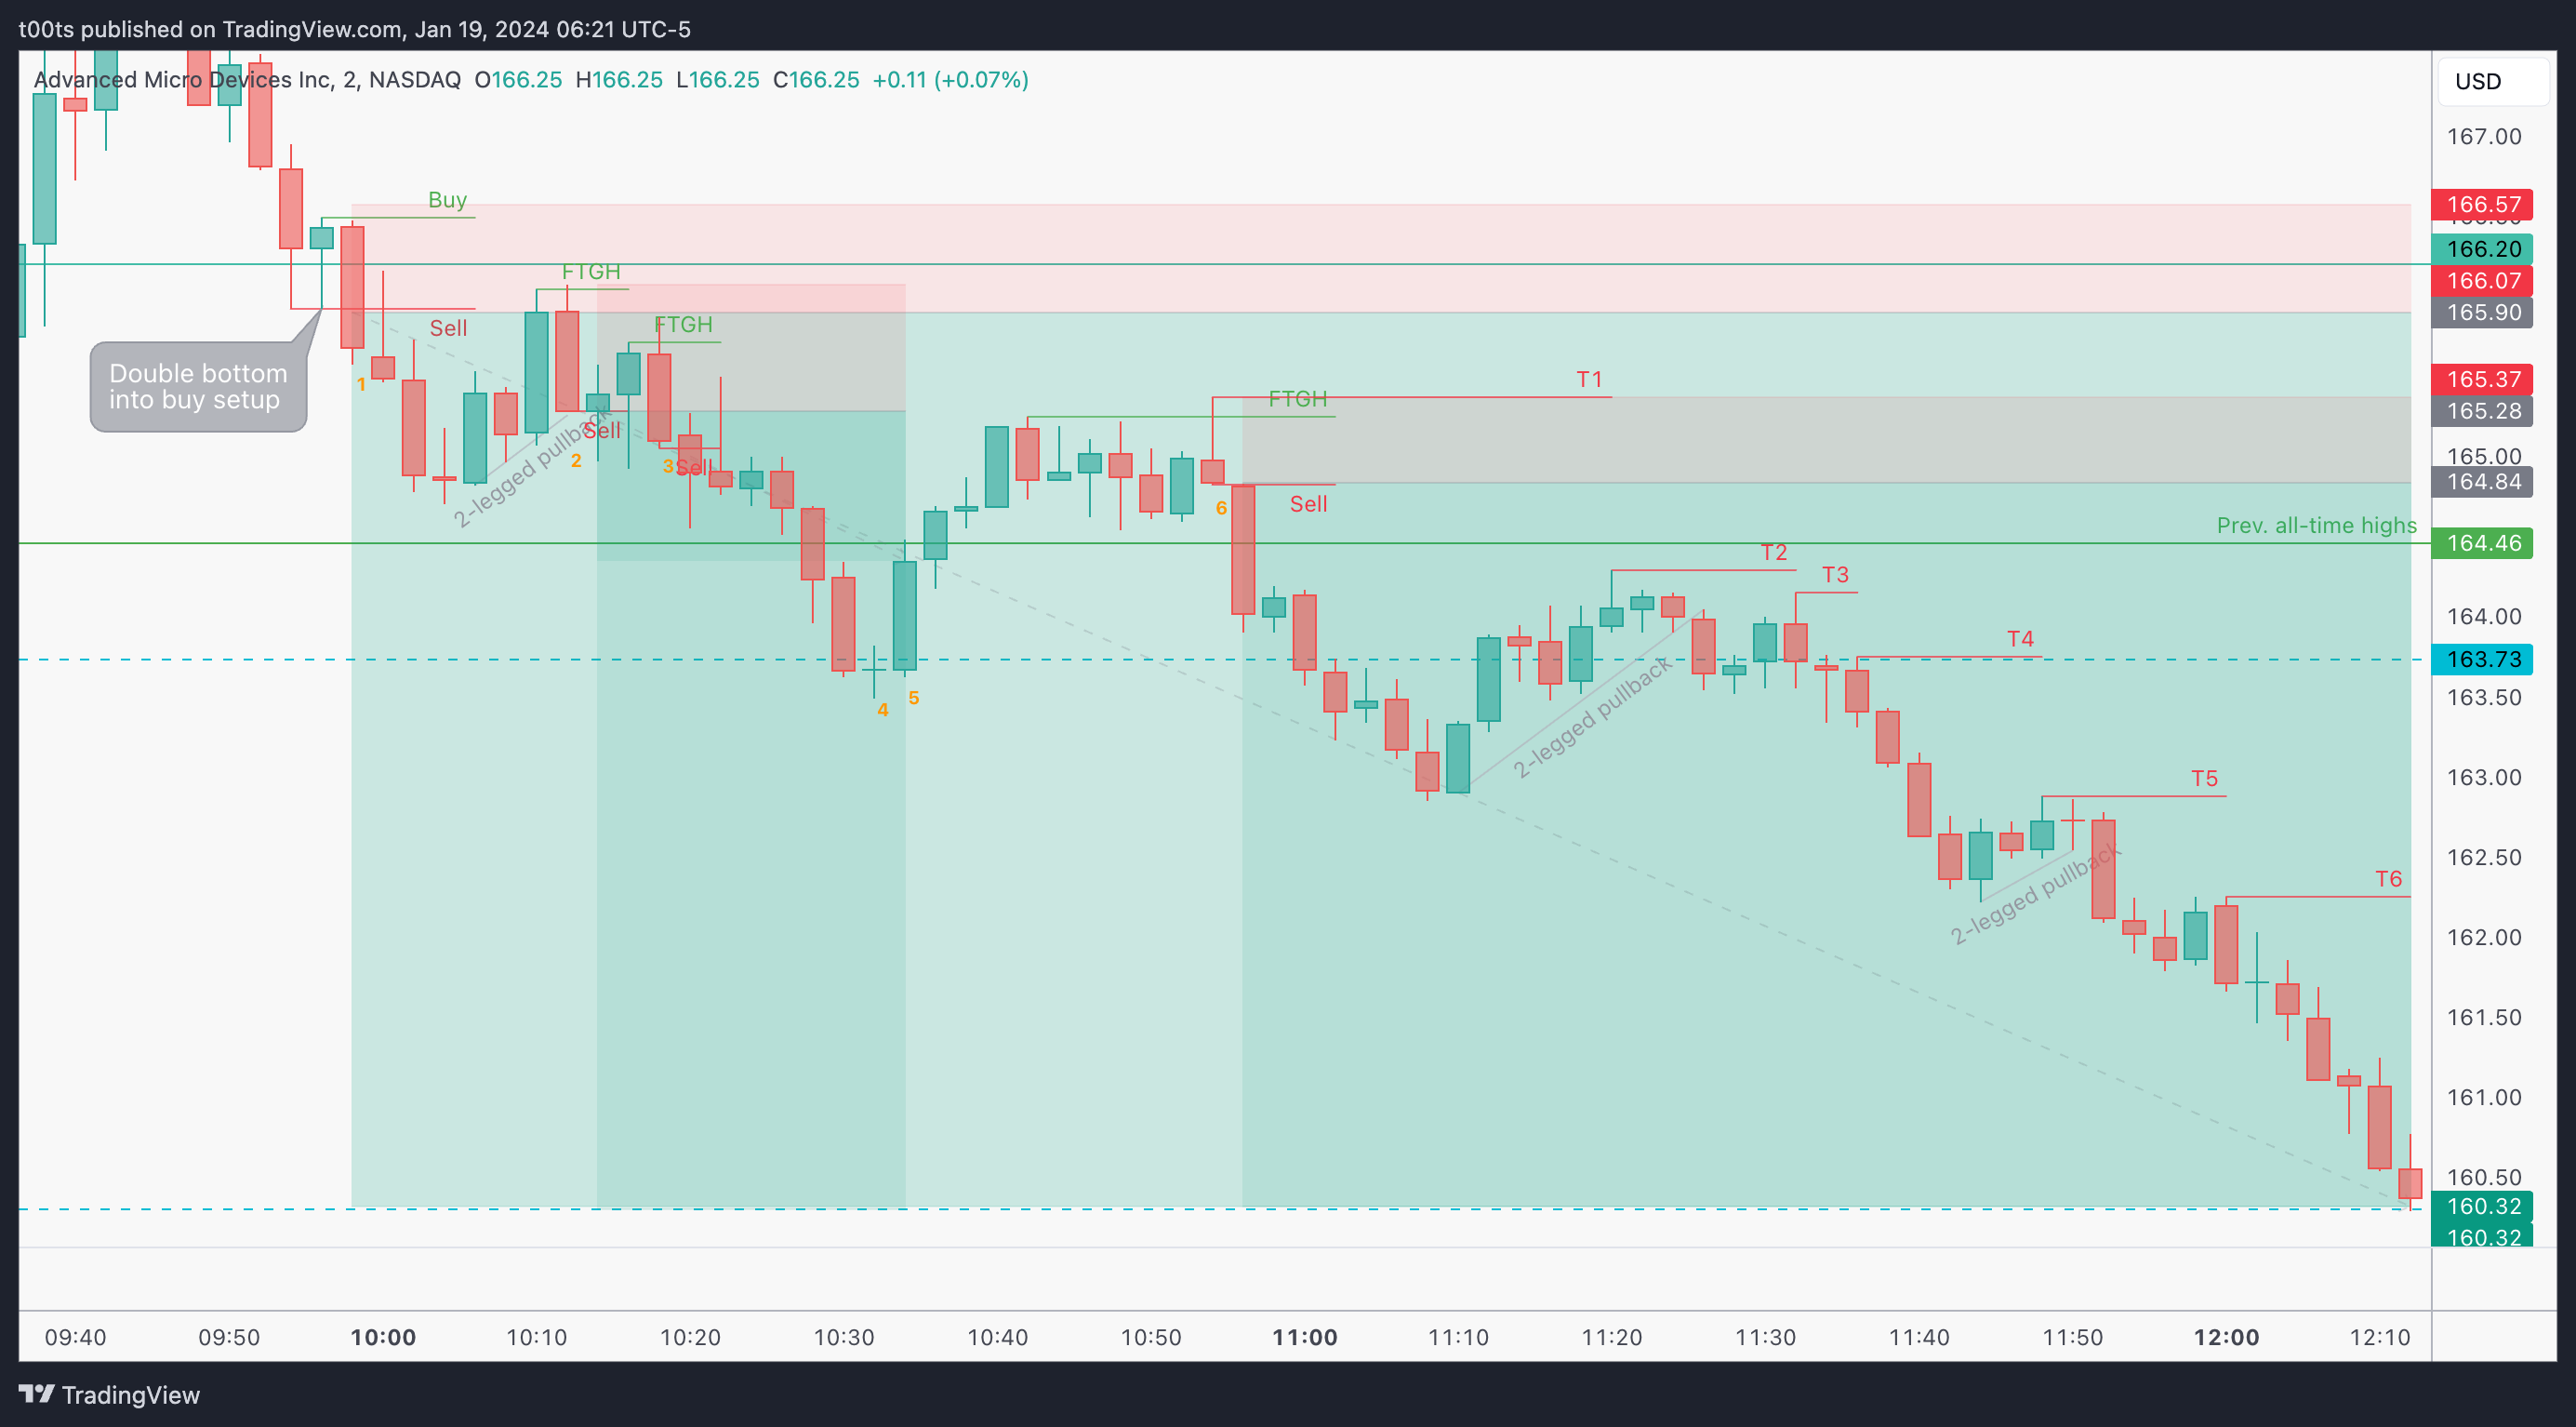
It's almost 10am. We’ve had a strong rejection at the highs, and the double bottom buy setup that's setting up fails. I jump in with a starter position risking the signal bar highs and essentially sit and wait for opportunities to add. I'm still long on ARM at this point, so the AMD short acts as a good hedge. Soon enough, I'd be out of ARM and focusing on this one. Let's go over this 2m chart bar by bar:
Bar 1 breaks down that double bottom buy setup and sets us up for a potential downtrend into the gap fill. After the huge rejection we saw, this is a good second entry to get involved. There's clear entry and exit points in case we're wrong.
Bar 2 is a nice bear trend bar after a two-legged pullback that sets up another entry opportunity which I actually take. It wasn't a comfortable hold if you strictly look at the 2m chart, but the 5m at this point seemed setting up for a bigger move lower.
Bar 3 was another opportunity to add again, and I did. This again looks very choppy on this 2m chart but the 5m looked sweet.
Bar 4 holds at our first $163.73 level, as expected.
Bar 5 is a strong bull trend bar after the level held. This bar scared me out and I took two tiers off, just leaving the initial core position.
Bar 6 offered a beautiful entry. Clean bearish reversal bar that fails to break the range to the upside and closes red. I add both tiers the moment we break this bar's lows, risking the high of the reversal bar and trailing my overall position stop to those highs.
From this point on, it was just a matter of riding the trend. I must admit I didn't like how priced reclaimed the $163.73 level after it had broken down to a new low of the day, that's why that area has so many stop trails. That pullback got me a bit nervous so as soon as we started seeing some weakness I started tightening up my risk.
Unfortunately I didn't add for the last leg down. I was focusing too much on the lower timeframes at this point and failed to zoom out, see the bigger picture, and chill.
Price eventually hits our $160.30 level, completing the gap fill and leaving us with a realized 8-10R trade.
5m chart
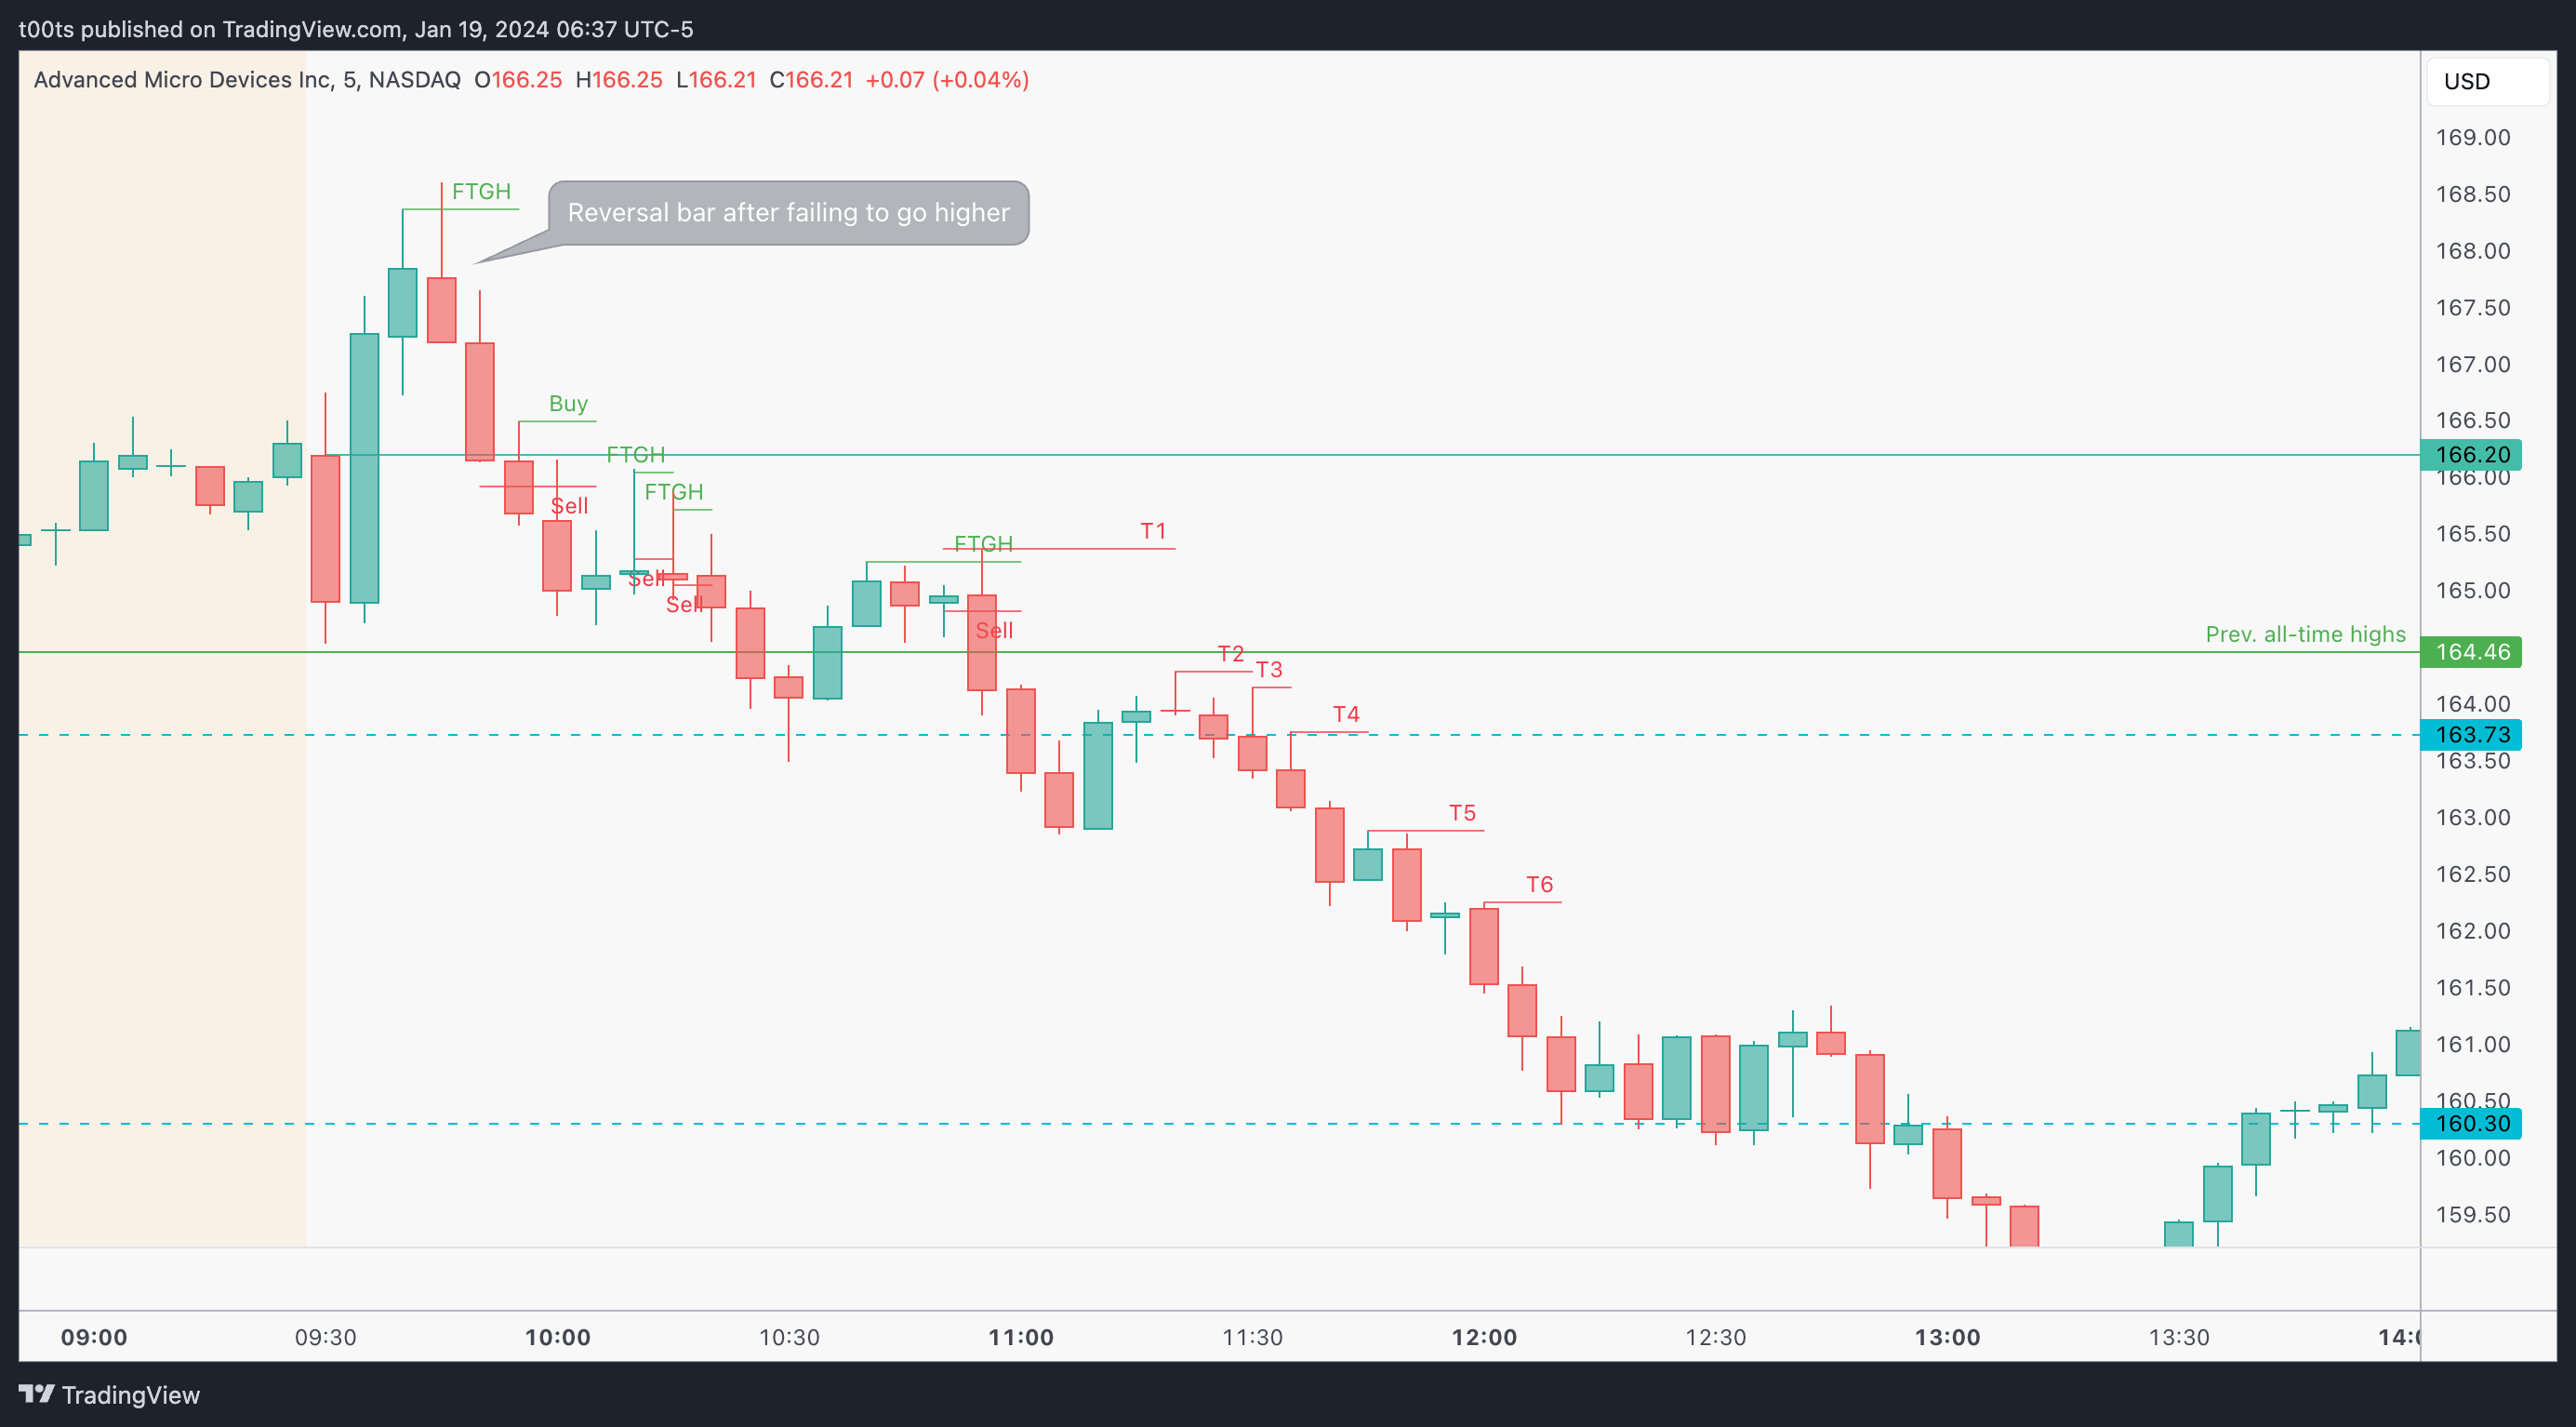
Here's a 5m chart for reference. I left some of the annotations from the 2 minute chart we just reviewed for context. Notice that reversal bar at high of day after failing to move higher. That's our first cue to consider the counter trend trade. The second, in my case, was the buy setup at the open failing, which is where I took the short.
Closing notes
Shorting semis has been the most absurd and stupid thing you could do for the past few months. Today however, we outlined how context is everything to approach such trade.
We had all the ingredients to consider a short: Gapping into all-time highs (important liquidity area), overextended weekly chart, a huge overnight gap below, and price giving up the opening print after failing to push higher early in the day.
I've taken trades like these before and they don't always fill the gap. But I'd still take them every single time the risk-to-reward makes sense, as that's what it's all about.
I am posting one trade writeup every day throughout 2024. I focus on large caps using levels and price action. The subscription is absolutely free and will always be. I will strive to provide value by offering clues and ideas for you to enhance your edge. Let’s grow together!
insane review! I would've never thought about shorting AMD at ATH. Learned a lot with this one, keep 'em coming