

Higher timeframe context
We finally got the breakout! We've all been waiting for this one. NVDA has been consolidating for the past 6 months, trading within a 100pt range, which as of today has officially become an accumulation - as we suggested in our previous trade recap.
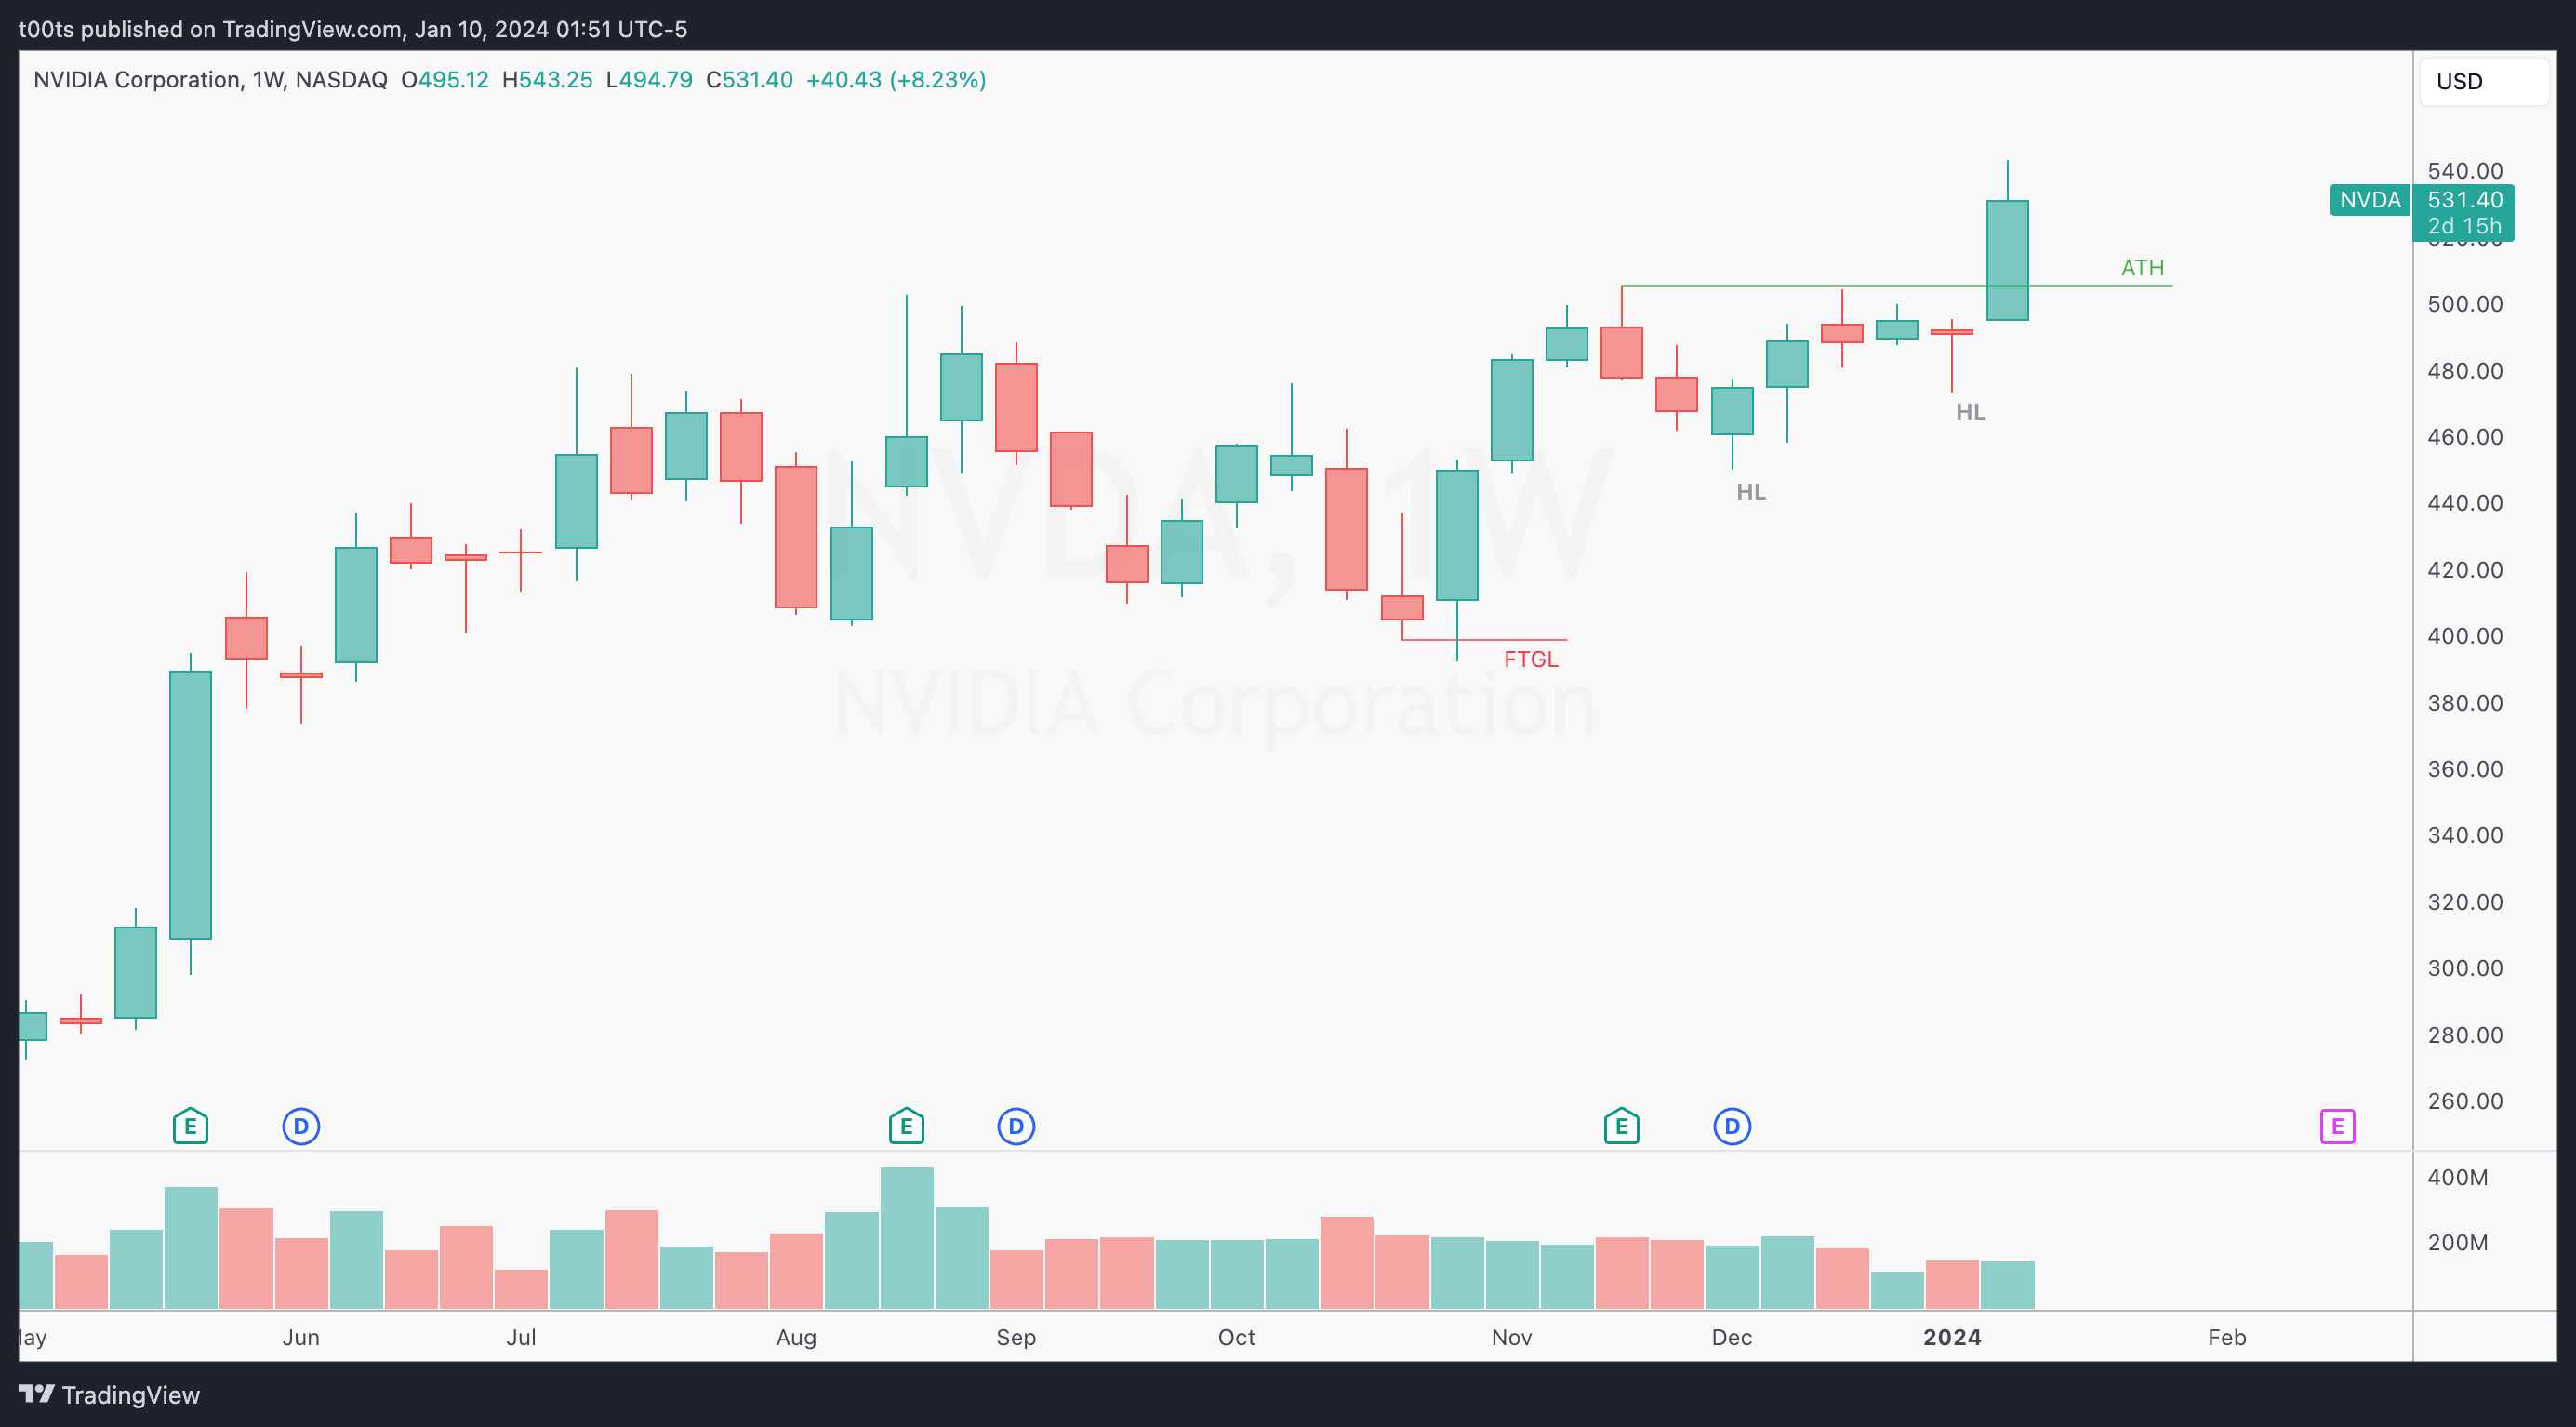
Weekly chart
Most price action traders would probably agree with me that a breakout was likely after last week's bullish hammer candle. Now that we’ve broken out, we leave a confirmed higher low behind while looking at clear skies above.
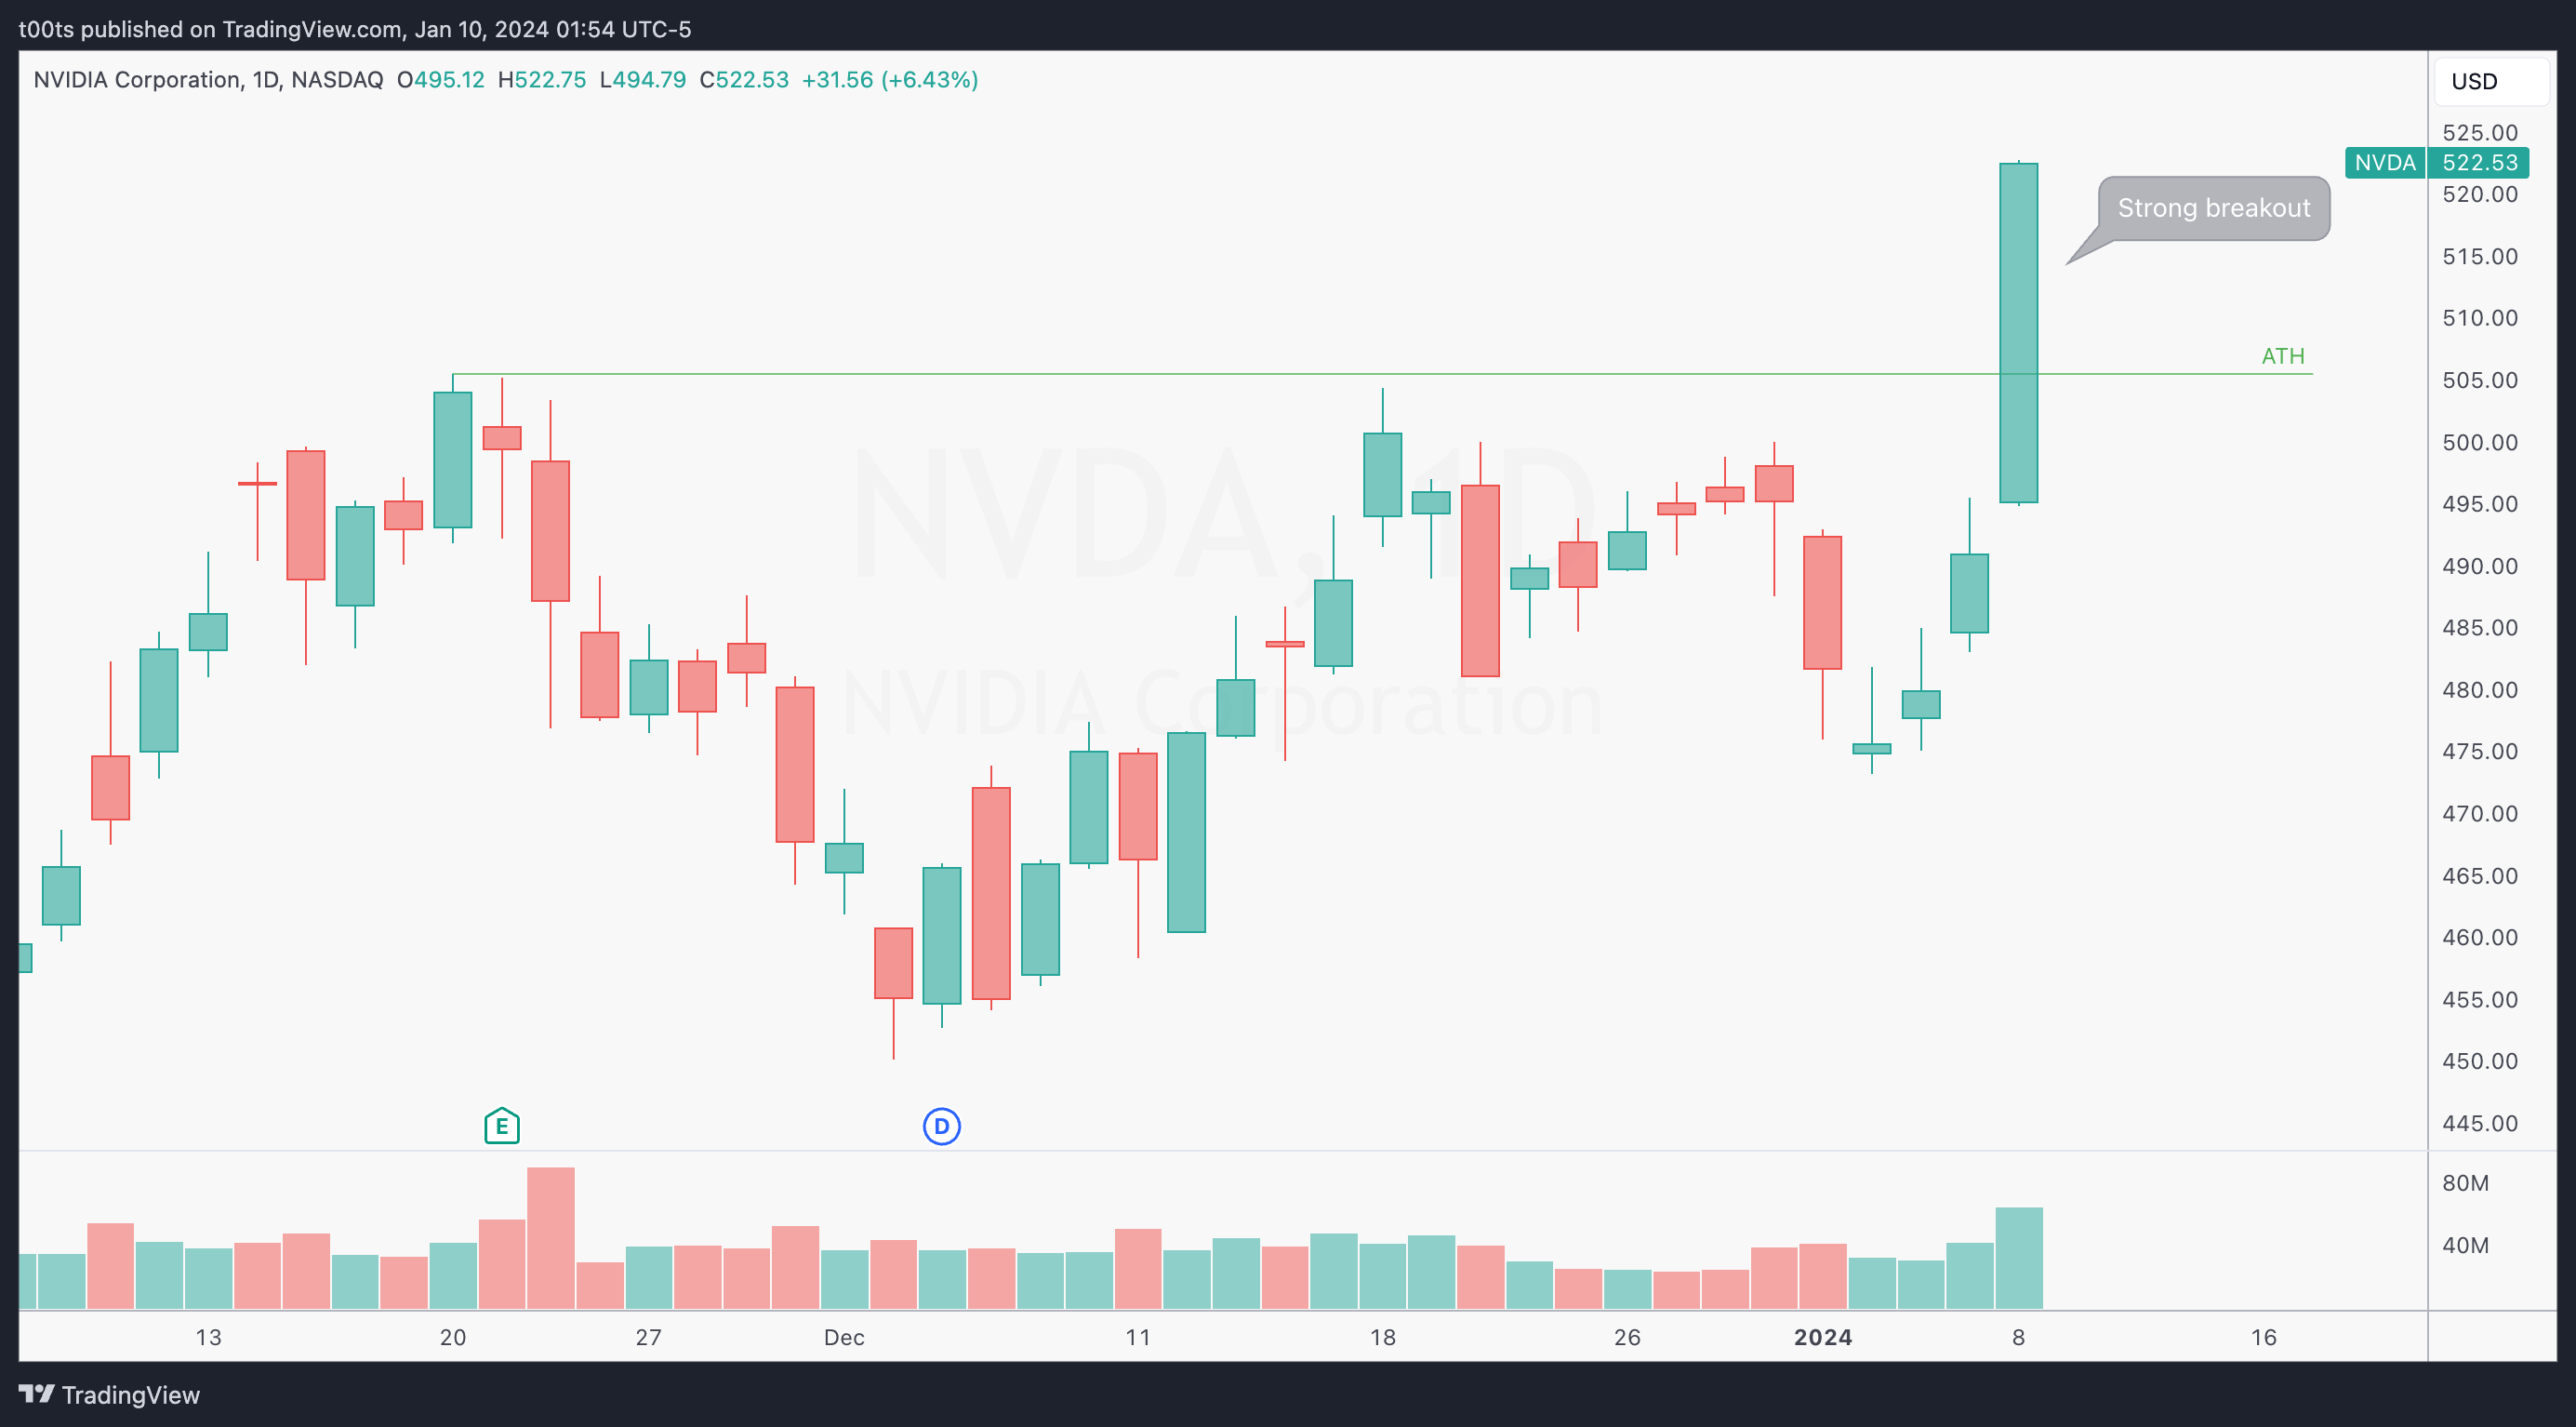
Daily chart
Look at that daily trend bar. The strength of this candle is unquestionable. Shaved tops and bottoms (no wicks), denoting consistent buying from the open right into the close. Not to mention the near 2.5x ATR's (using the standard 14 period window) this move accounted for.
For those not familiar with the Average True Range, the move yesterday was above 2.5x the average move for the past couple weeks. I feel the need to bring this up because it’s a quantifiable metric with a significant print. There’s nothing subjective about it.
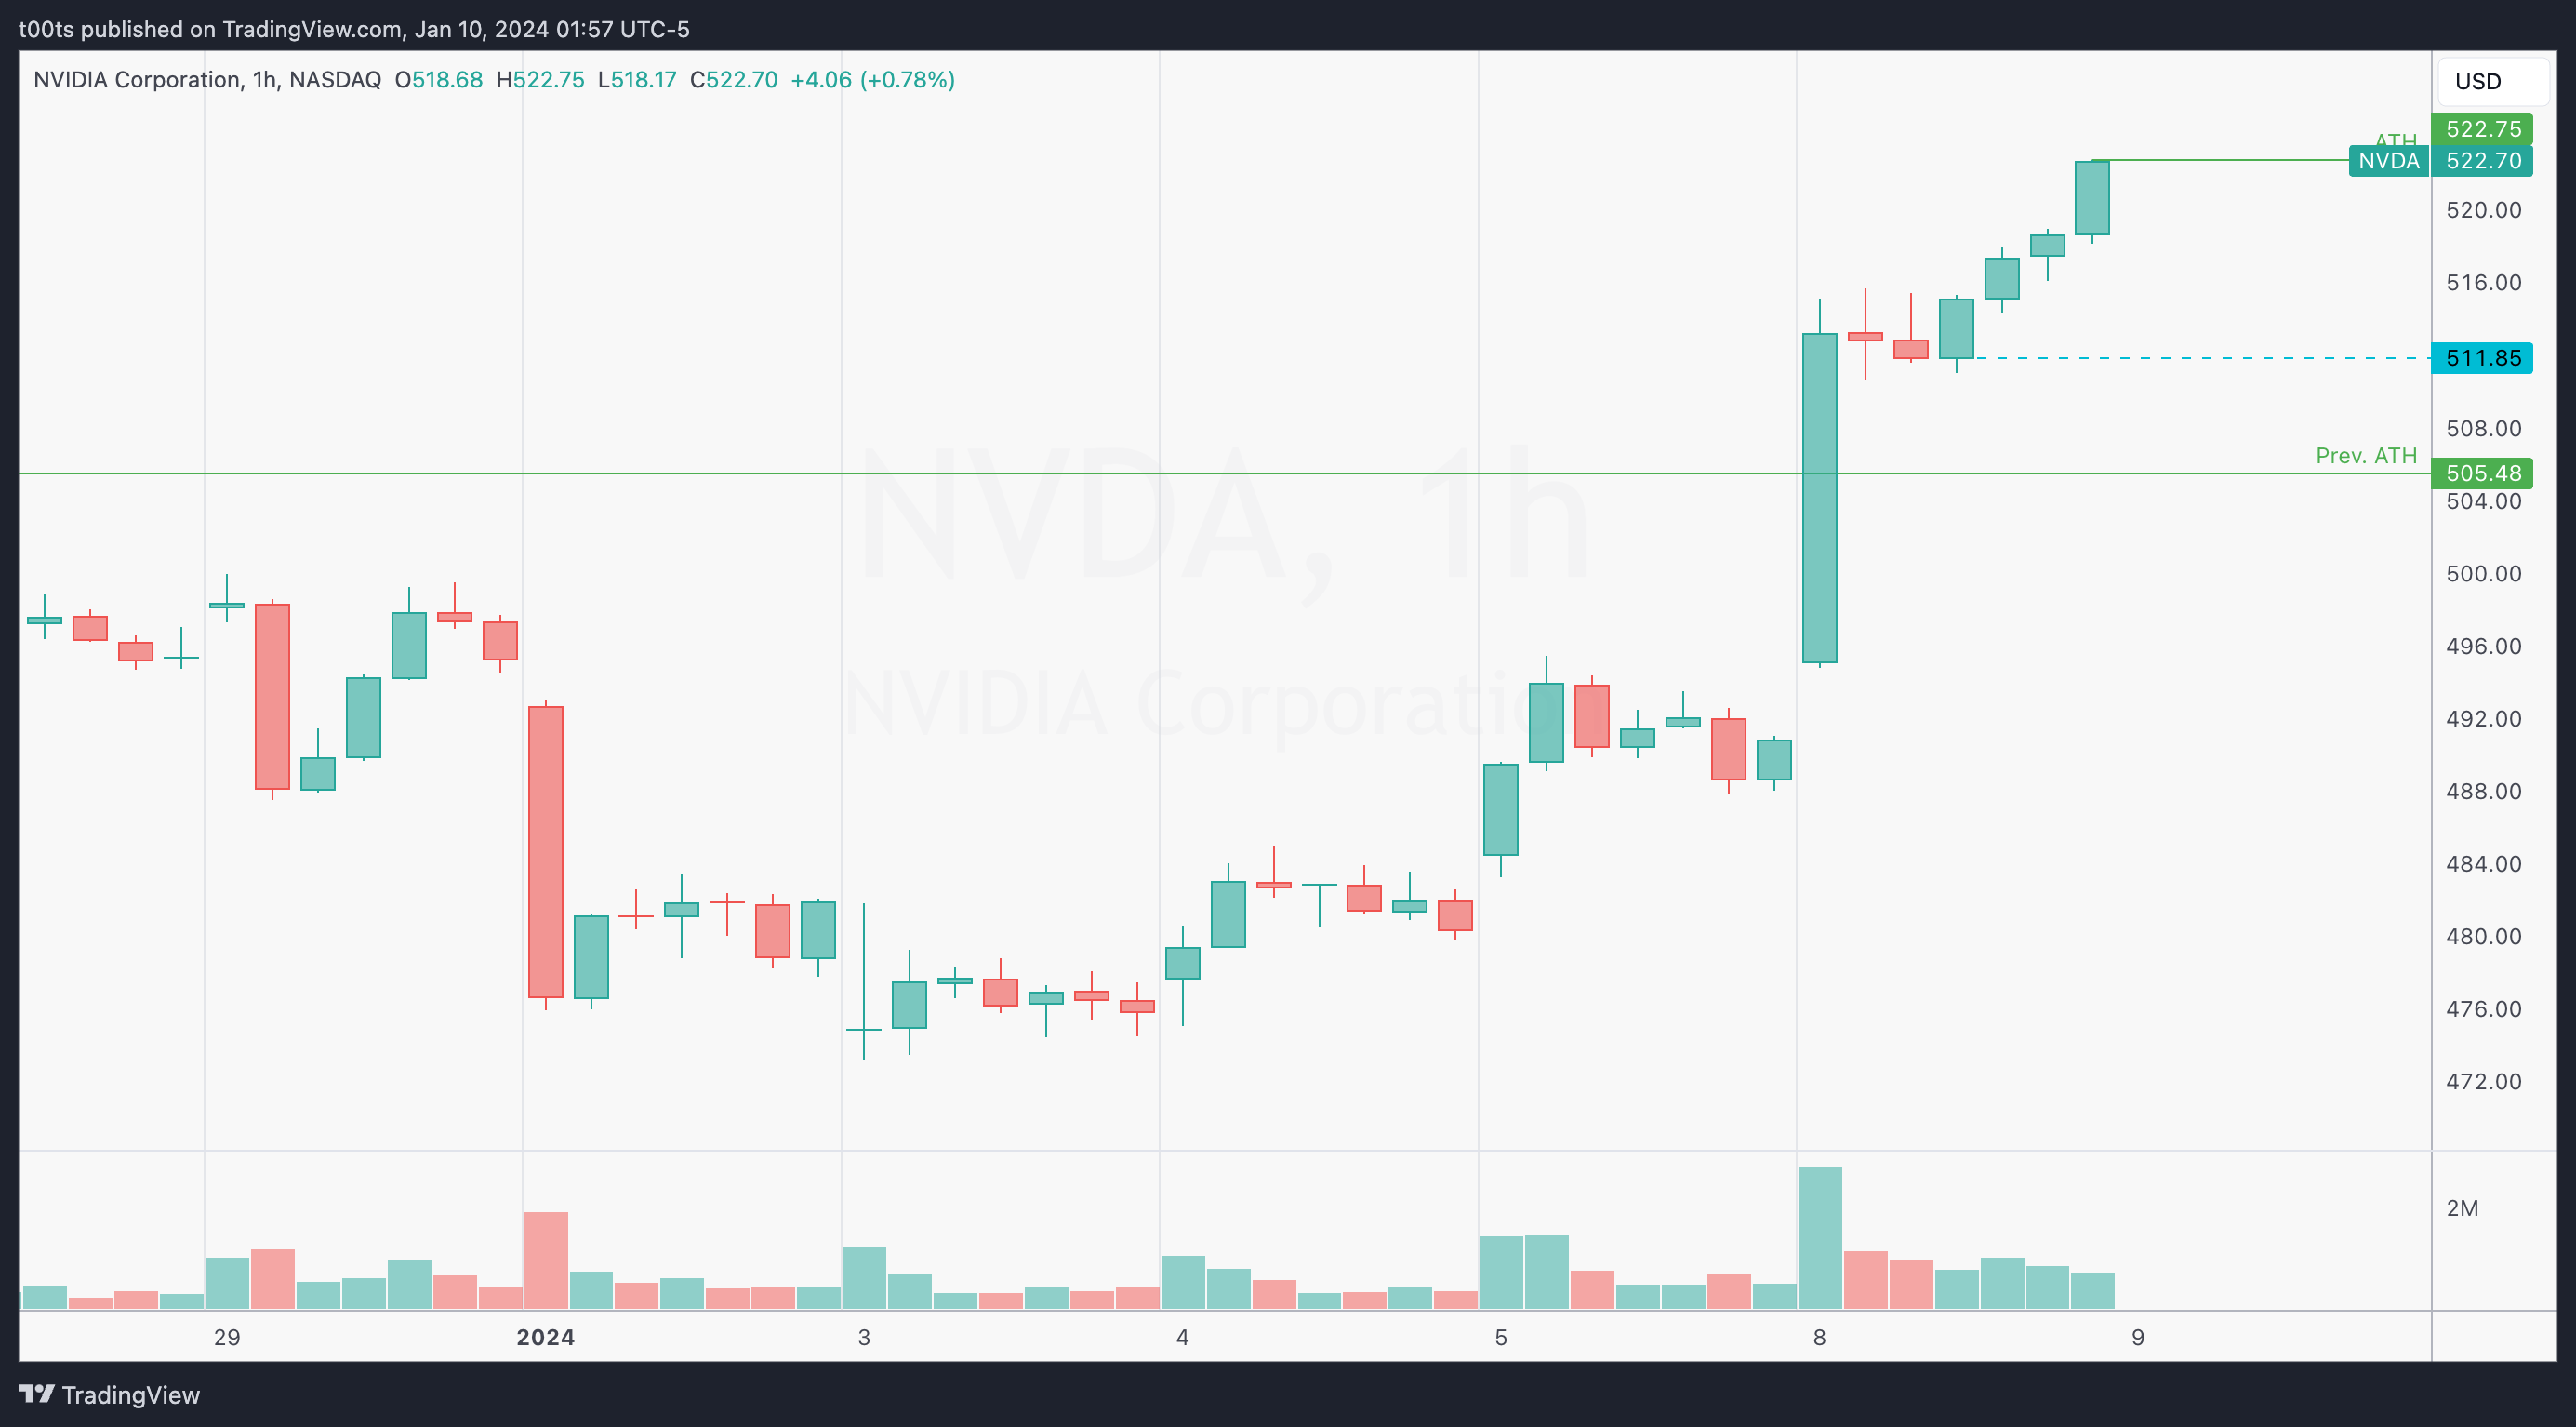
Hourly chart
I love that we finally get one of these charts where there's really not much to offer, because we can dive deeper into my process when this happens. Essentially, we have a strong uptrend, with one single level of support that's quite far from current prices. There are no levels above, as the stock is currently in price discovery territory, so we have limited references to base our trades of.
Normally, when a stock is set to open with no levels nearby, I’ll discard it. In this case, despite the lack of levels, there were enough cues to keep her on strong watch.
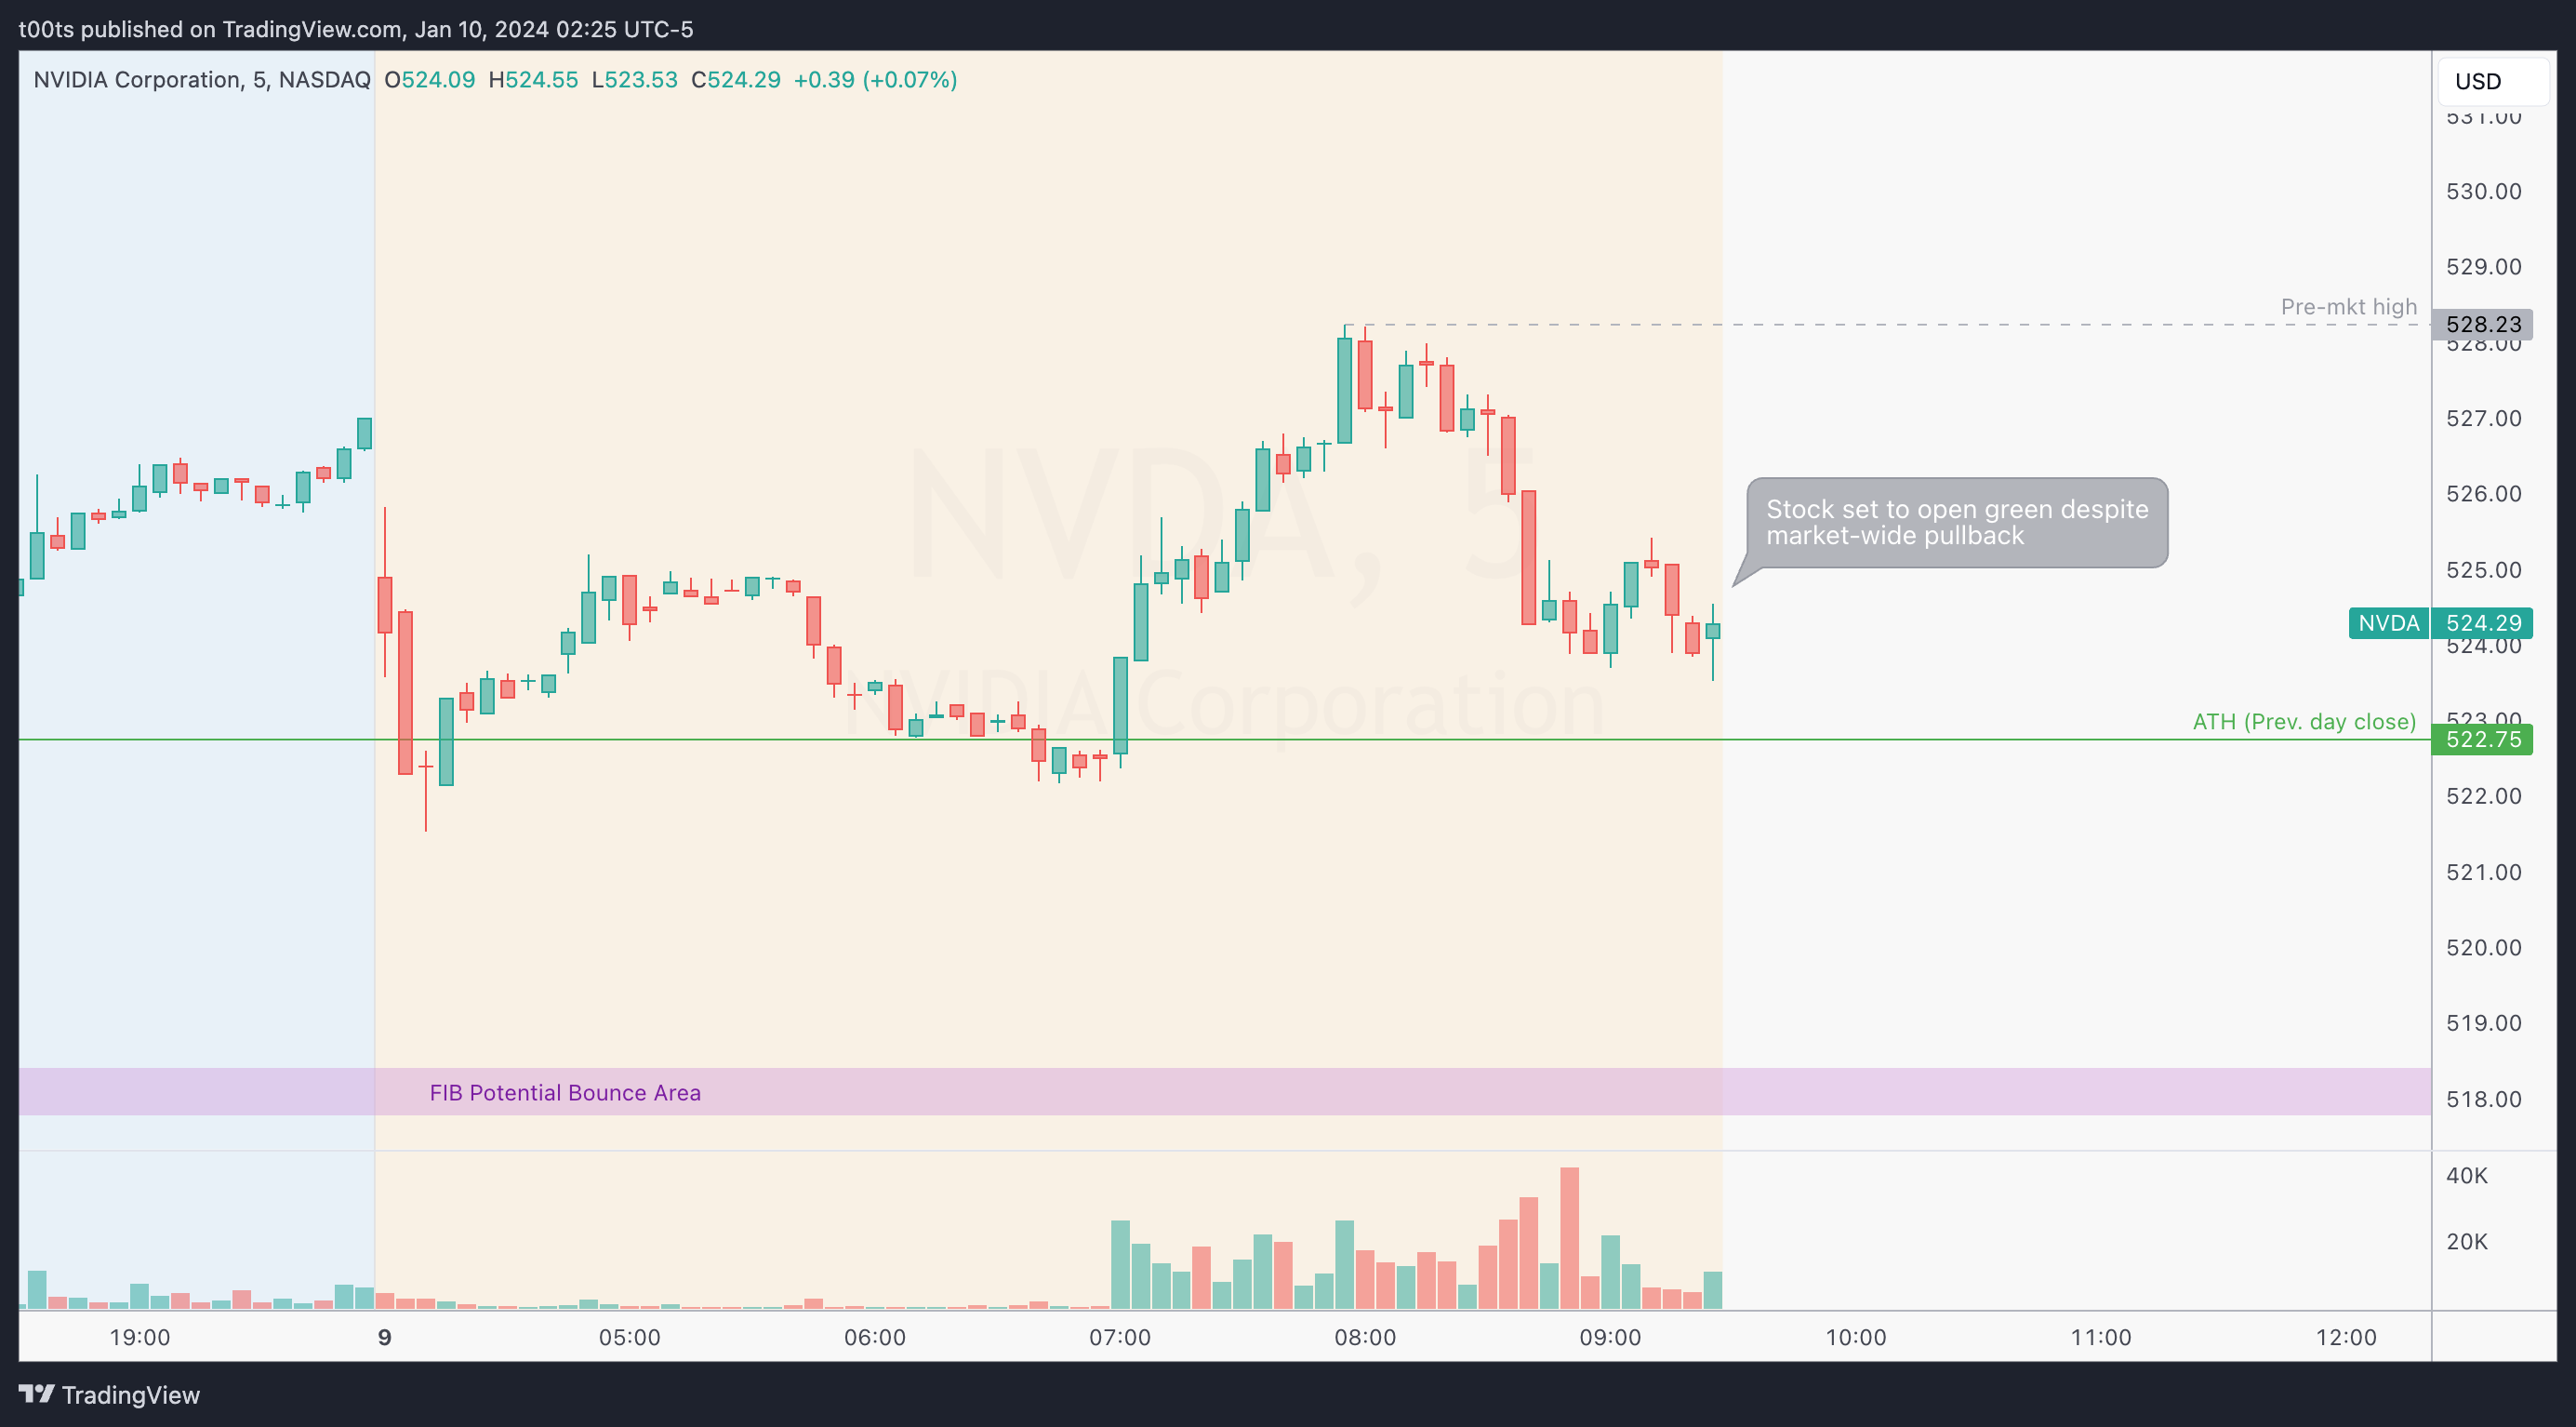
Pre-market action
There's plenty of attention on this name for all the obvious reasons: Market leader, strong sector, recent multi-month breakout, etc.
On this day, NVDA was the only stock of my top focus list (18 names) that was set to open above its previous day's closing price. For the record, SPY and QQQ opened down 2.75pts and 3pts respectively. So the fact that NVDA was slightly gapping up definitely stood out.
Catching bounces
We finally get into the interesting part of today's writeup. How do we trade when there's no levels to base our entries off of?
As of right now, we have a few references available:
Previous all-time high
The opening print
Pre-market high
In the pre-market screenshot you might have noticed a purple area labeled FIB Potential Bounce Area. This is something I've been waiting to bring up here and today we finally got the adequate setup to look at this.
After a big move in one direction, people will take profits. It's natural human behaviour. After such pronounced moves, it's common to not have any levels to trade off of, yet traders still manage to get involved in the next leg up. How do they know where to buy?
One way to look for bounces in the direction of the momentum is by using Fibonacci retracements. This is a very common practice in banks and institutions, as it's relatively easy to model and quantify into their trading algorithms.
The following two charts display NVDA's previous day action on the 15m timeframe, with and without external hours. I've drawn two Fib retracements, one on each chart, using the start and the end of each move.
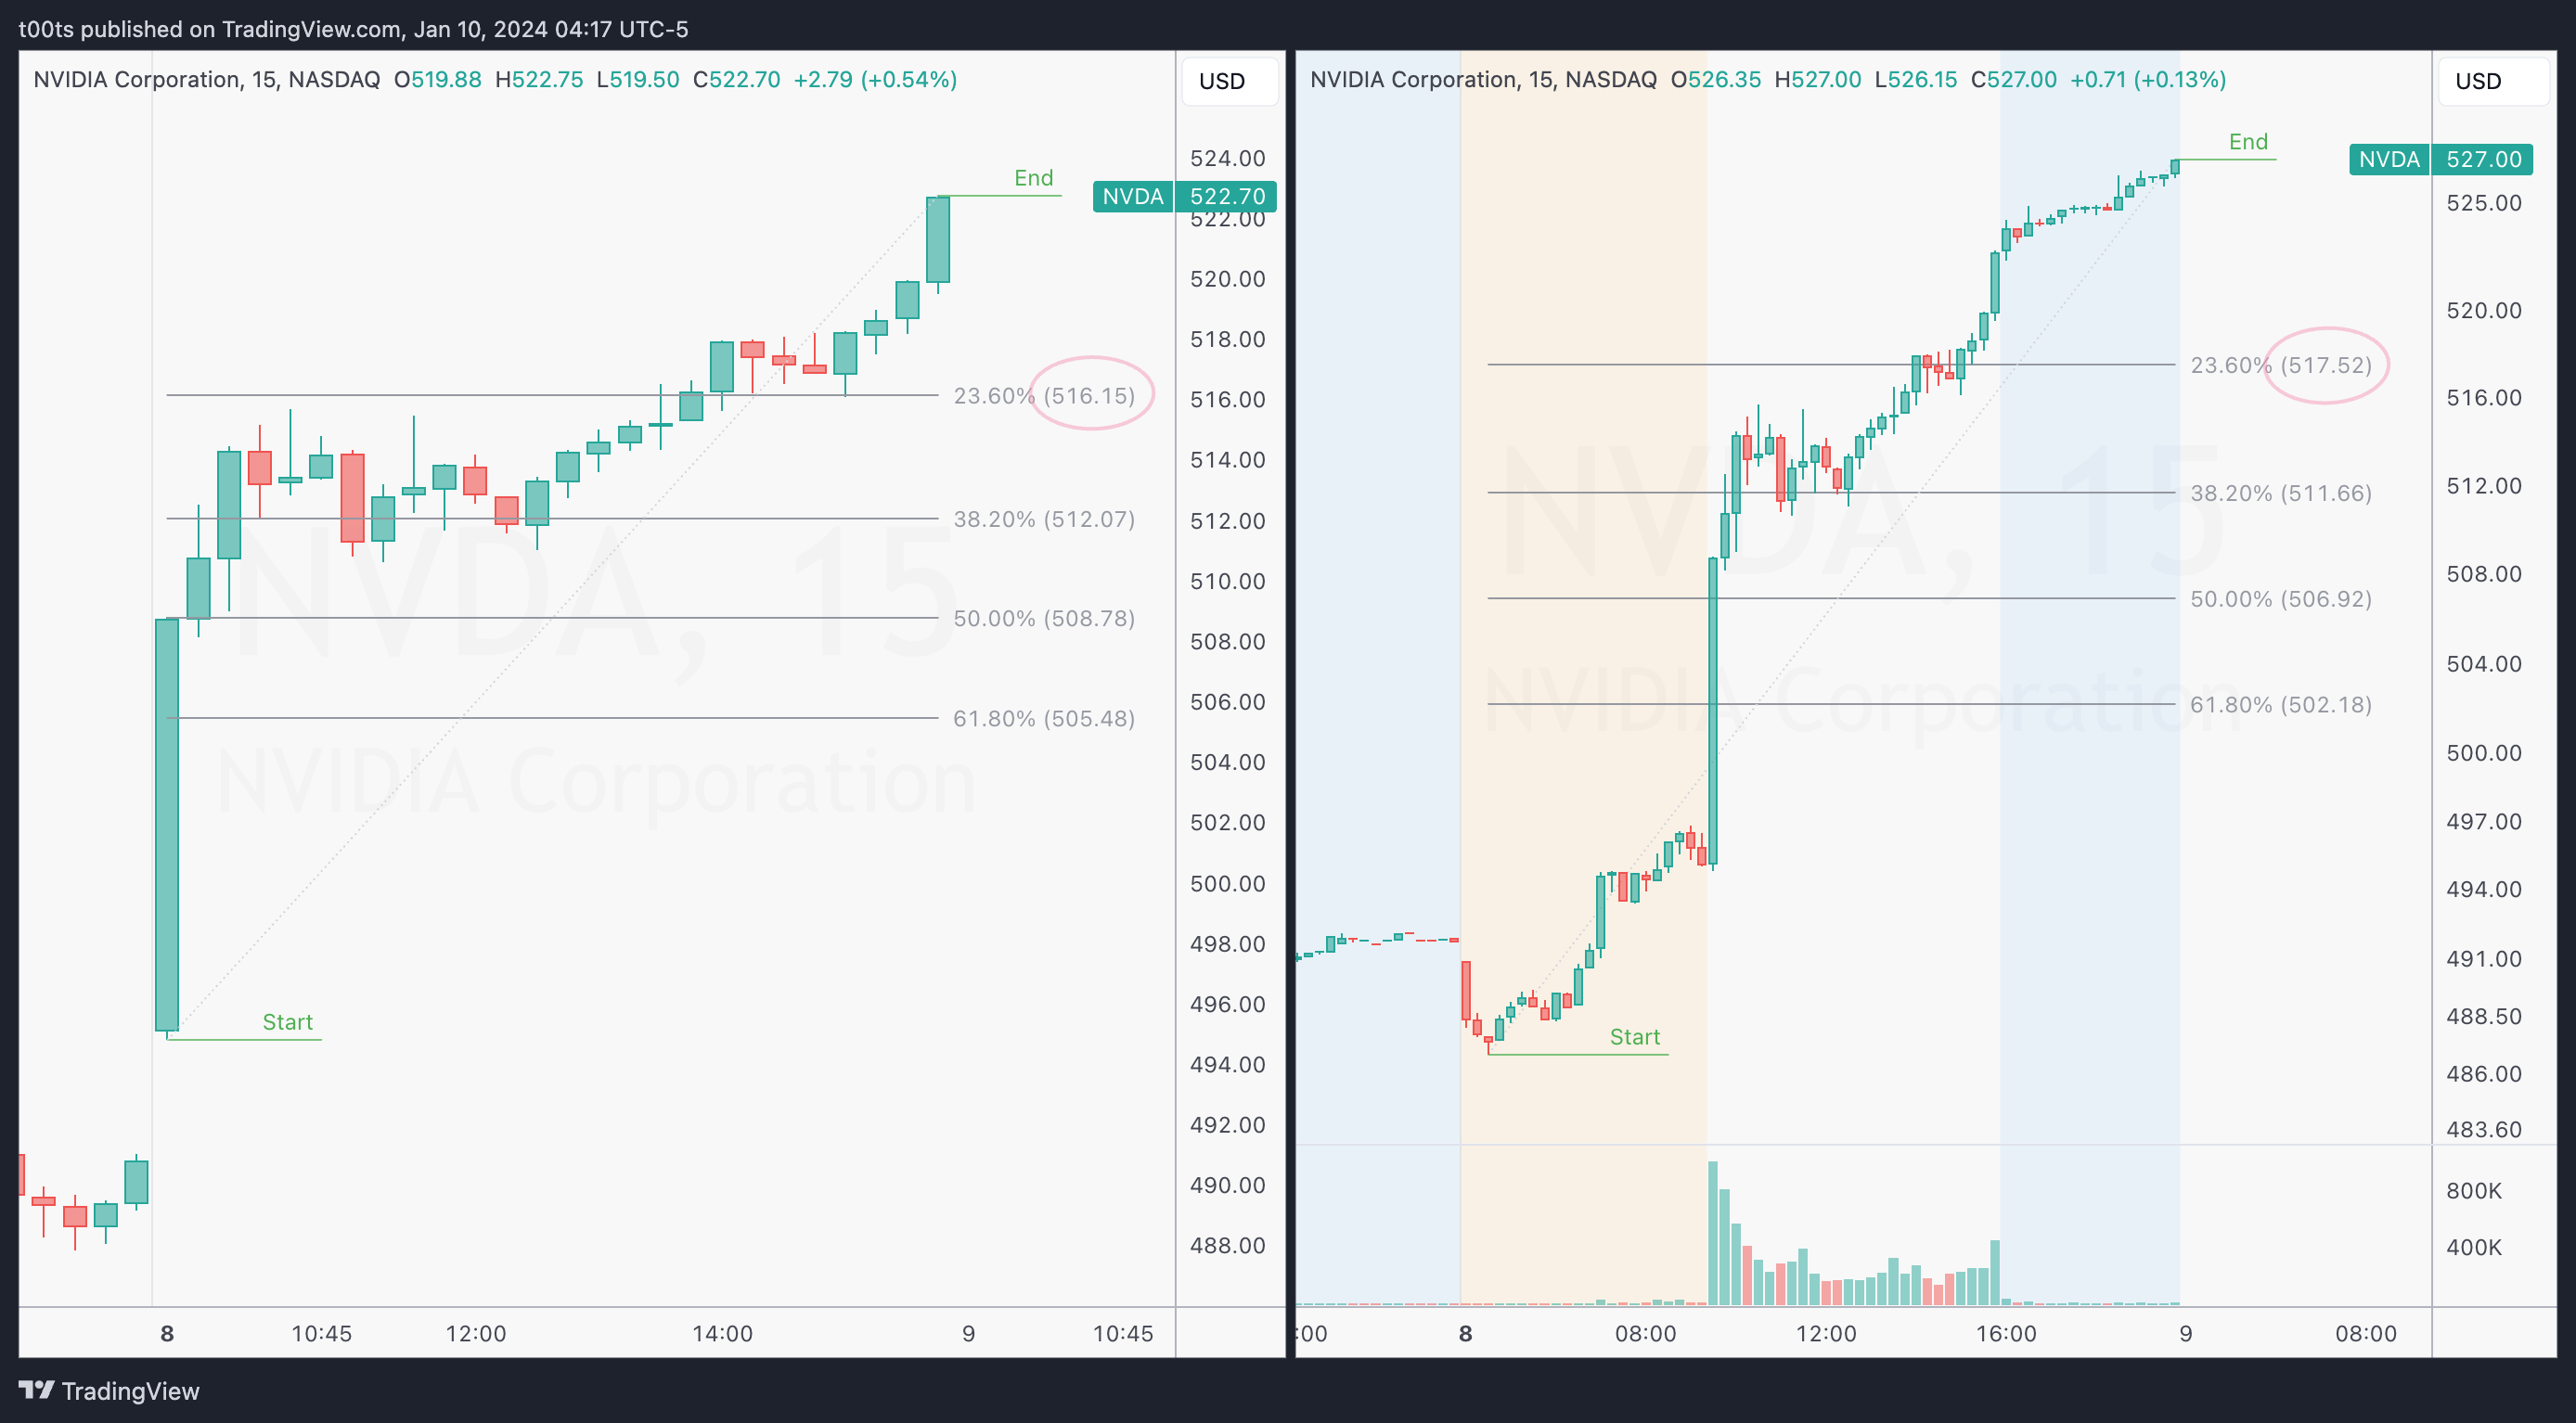
We can classify trends based on where they bounce:
The strongest bounces will happen at the 23.6% area
Above average trends will bounce at the 38.2% area
Normal trends can bounce at the 50% area
Weaker trends can bounce at the 61.8% area
The trade
Using our CPT Framework:
Cue(s)
Market-leading stock, making new ATH's
Huge multi-month breakout on previous day
Strongest stock in the pre-market despite market-wide gap down
Intraday cue: Bounce off strongest FIB retracement level
Intraday cue: Two-legged pullback with failure buy setup
Plan
All eyes are on this name. Even if you knew nothing about the FIBs, you could catch this trade (Side note: I missed it). I have zero interest in you thinking you should’ve bought that LOD because of this FIB area. While you definitely could, you can instead use that bounce as an intraday cue that supports your idea.
If there was no FIB level on our chart, price would still bounce, and we could still use that bounce to our advantage irrespective of us knowing the reason for it.
We notice a setup that I've brought up in multiple posts now. The two-legged pullback after an impulse move, with the second leg's low breaching that of the first. Those who've been reading know I absolutely love this setup. I love it so much I can't believe I missed it.
The moment price holds, reclaims the previous day's close (prev. ATH) and starts flagging, we're just waiting for a buy setup to get involved. The buy setup presents itself in form of a bullish hammer candle.
Trigger
Price breaking above the signal bar.
5m chart
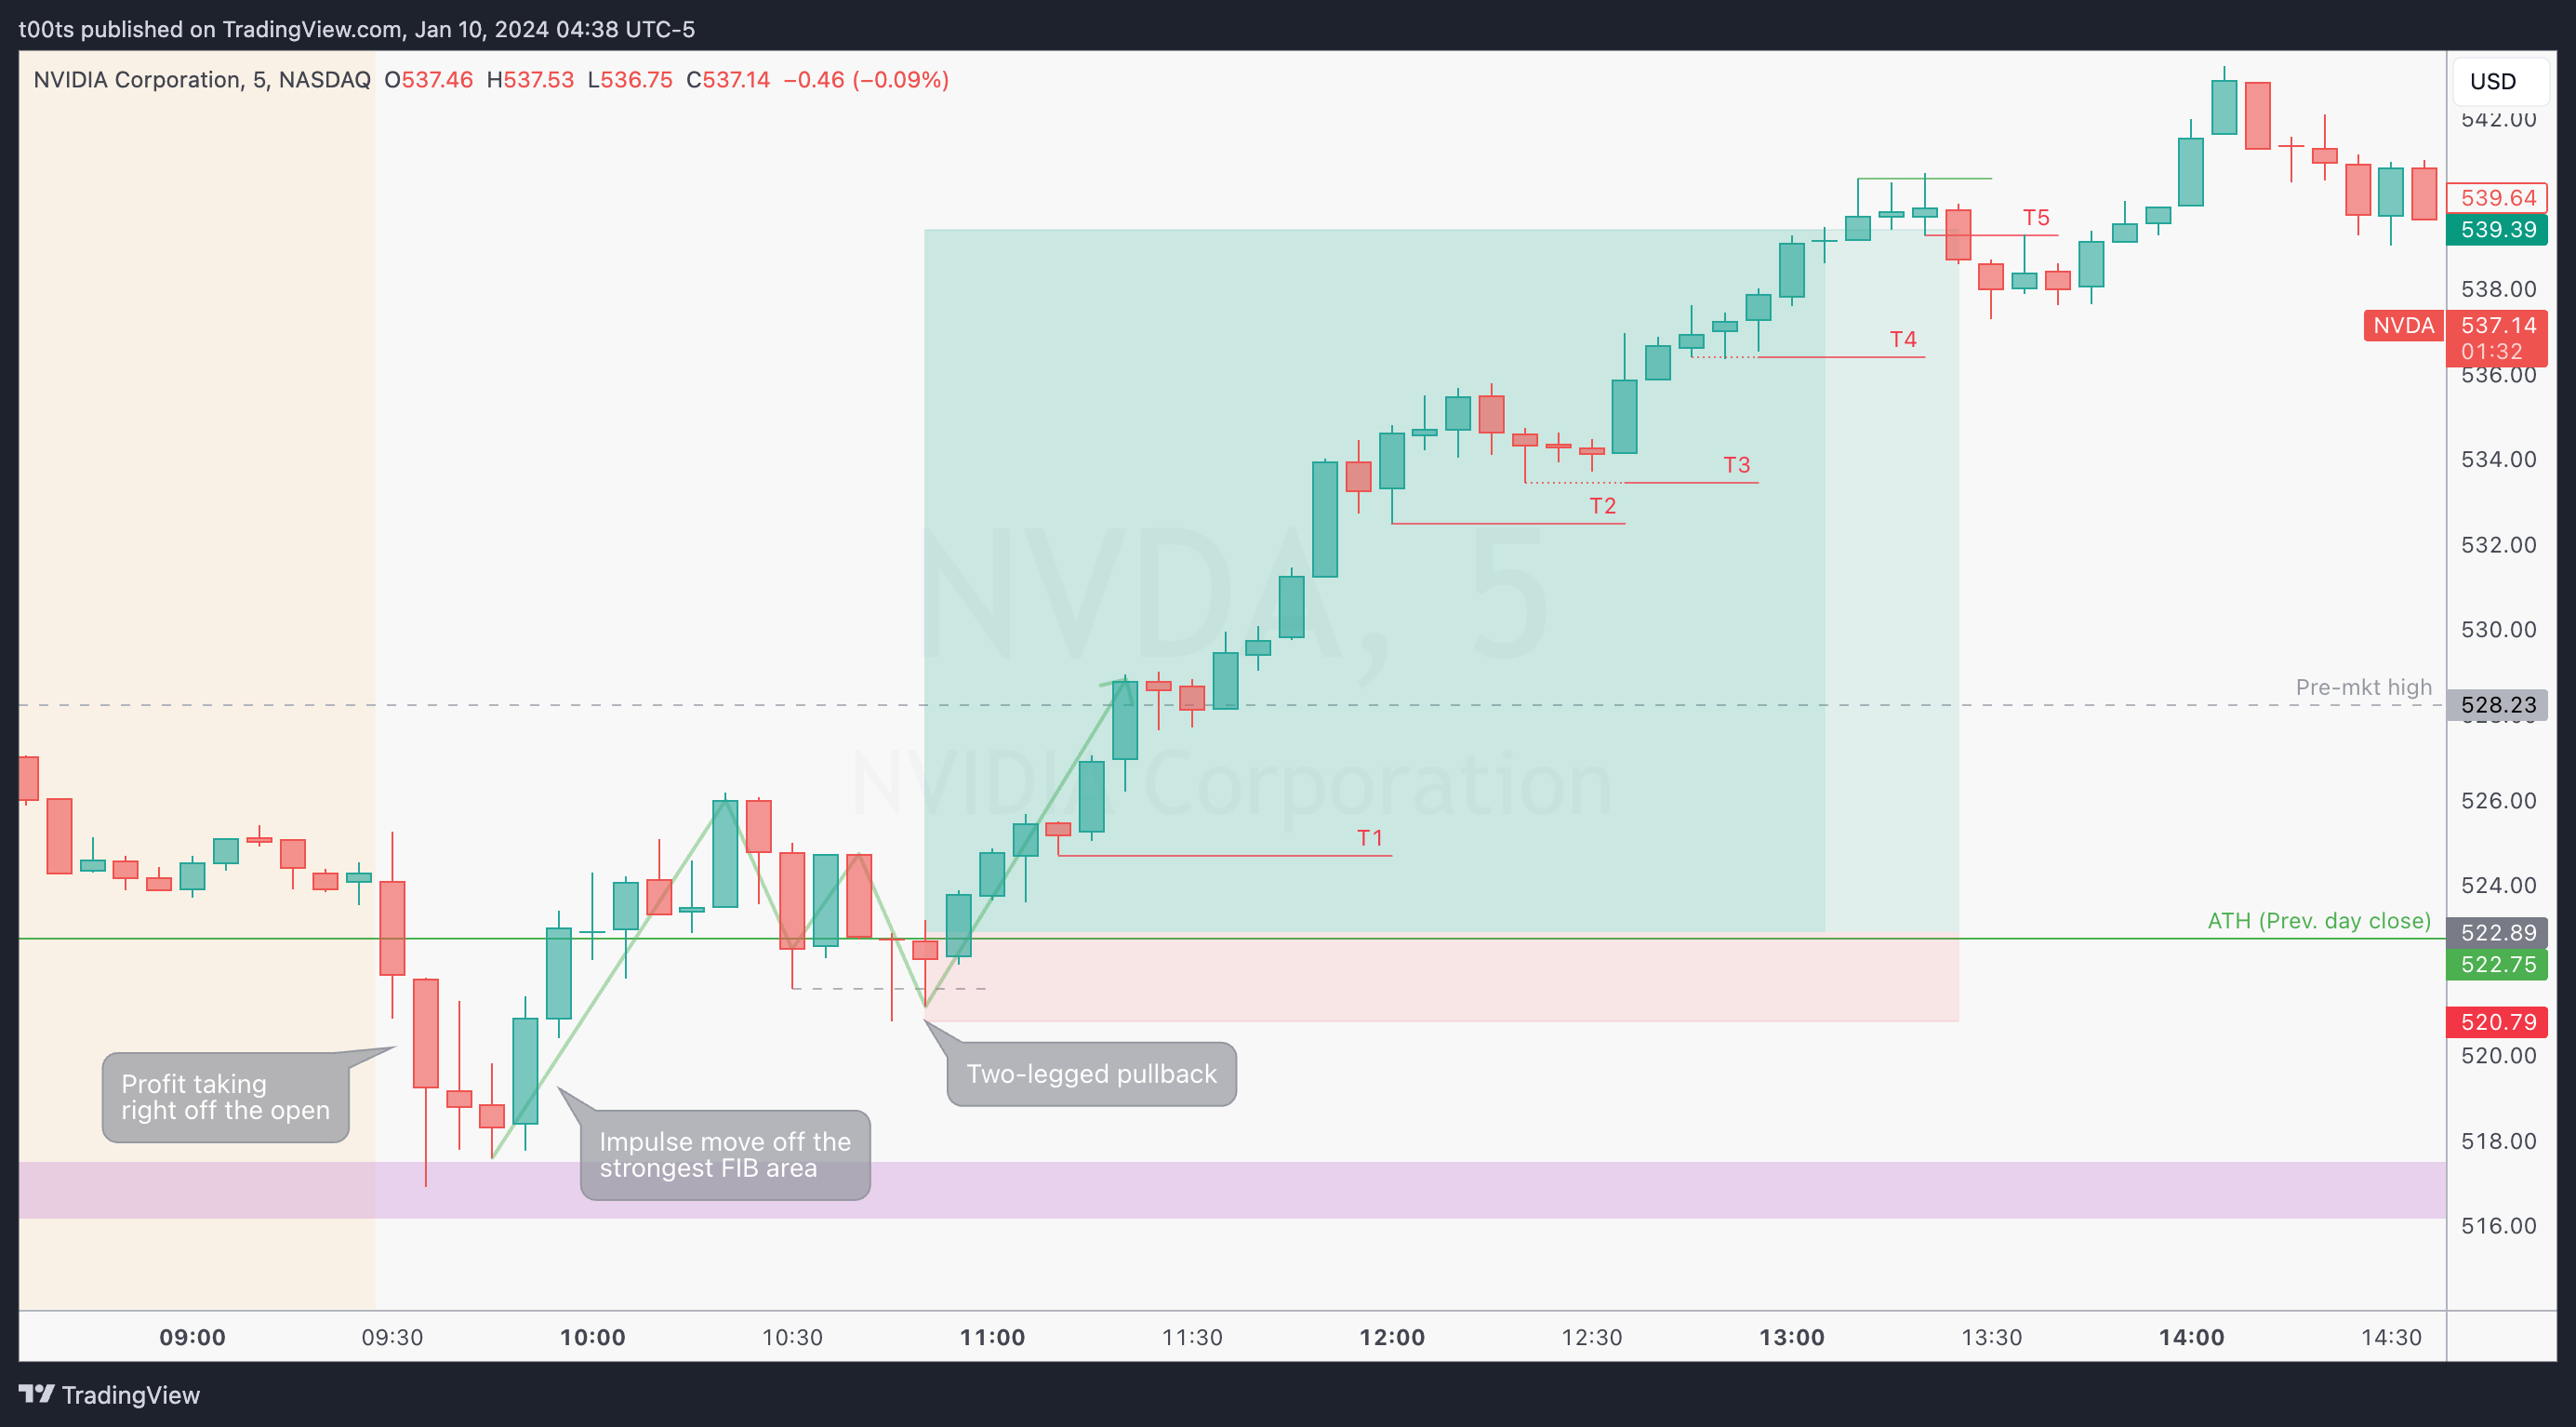
We do get a bit of a shakeout right after our entry, but not enough to hit our stop. After that, the stock just takes off to new highs and the trade becomes a matter of holding and reading the story that every bar is telling us.
As I did yesterday with AMD I've highlighted the multiple points where I'd trail my stop. I think most are obvious in this case. The final exit (personal preference in hindsight analysis) would be after price broke the lows of the bar that failed to go higher. This doesn't mean the trend is done, it just means that momentum is slowing down. After such an extended move, that’s my signal to take what's left and run. It's the first time price gives me a clear sign of weakness and we're already up somewhere around 8R. For me, that would have been a solid exit.
Closing notes
I was really looking forward to this review because I failed to see this trade in real-time. It meets so many of my criteria, yet somehow I totally botched it. This was my attempt to document it and hopefully provide you with some insights along the way.
Credits to John for teaching me the FIB retracements back in 2022. While these are a great tool, don’t over use them. However, when these strong directional moves happen, Smart Money will be watching these FIB levels. And you can never go wrong trading alongside smart money.
I am posting one trade writeup every day throughout 2024. I focus on large caps using levels and price action. The subscription is absolutely free and will always be. I will strive to provide value by offering clues and ideas for you to enhance your edge. Let’s grow together!