

Higher timeframe context
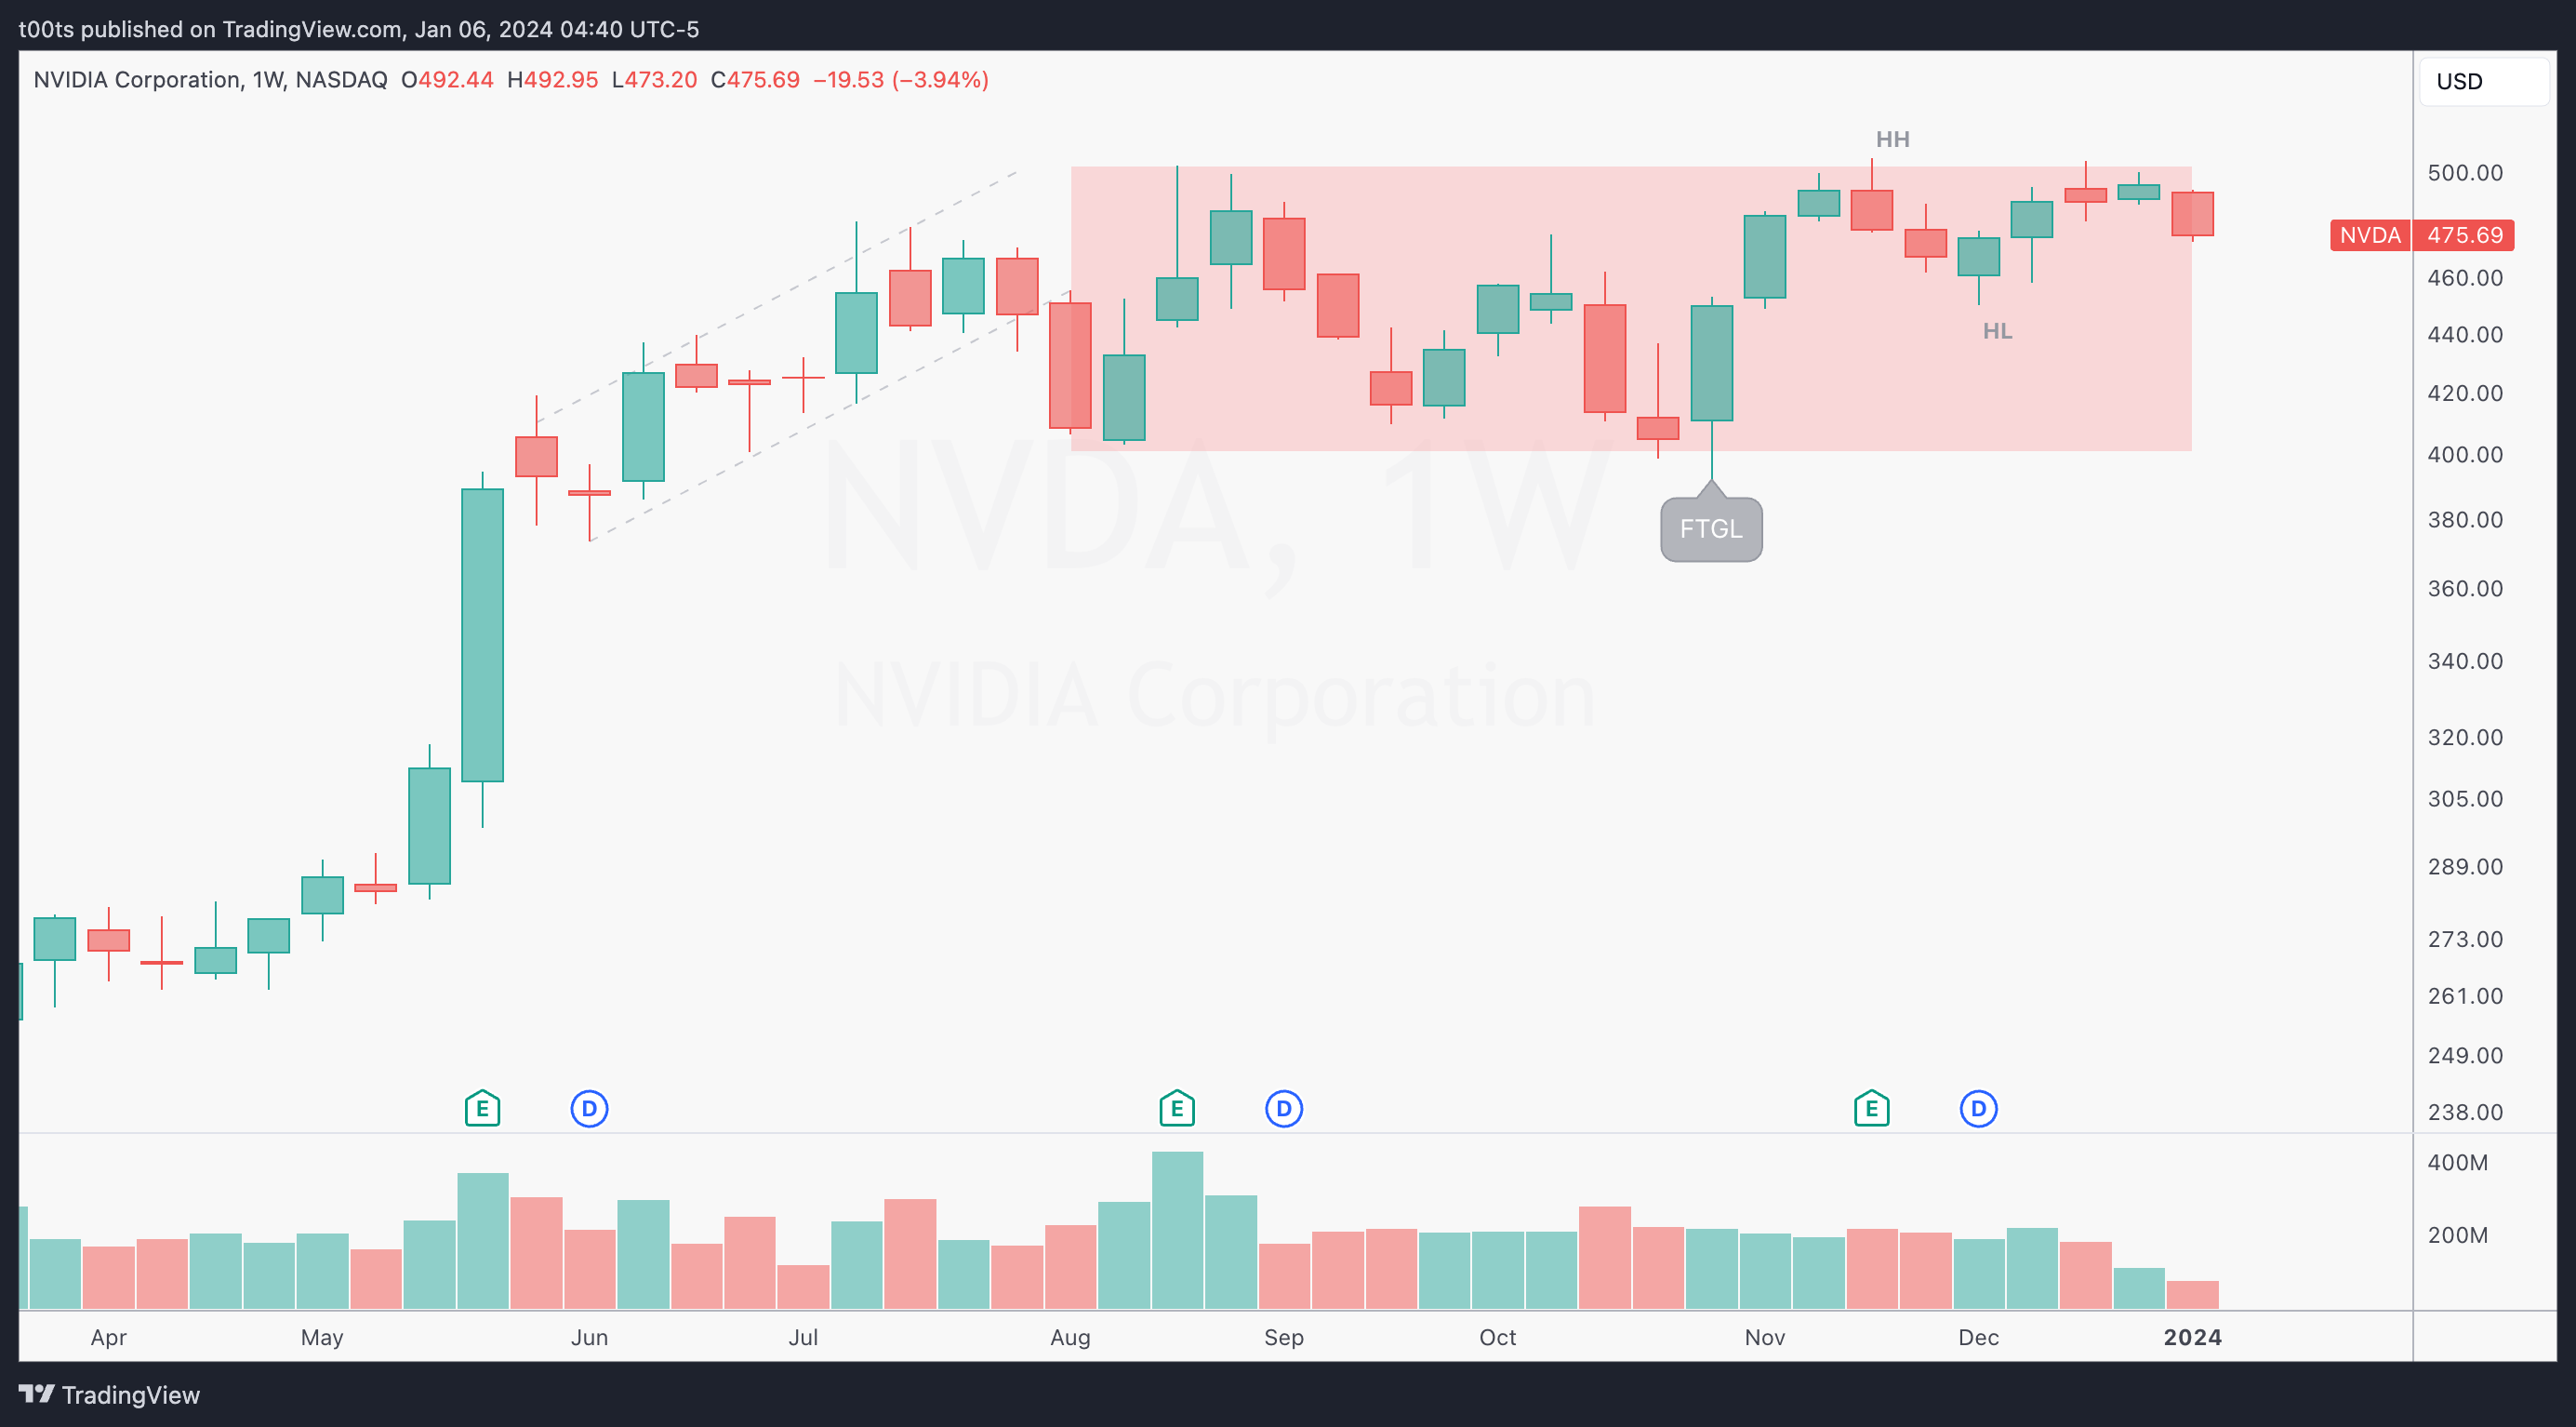
After the monster move during the first half of 2023, NVDA has essentially been consolidating for the past 6 months. Trading within a 100pt range. After failing to break the range to the downside back in late October, price established a clear uptrend and is now consolidating near the top of the range.
Weekly chart
Daily chart
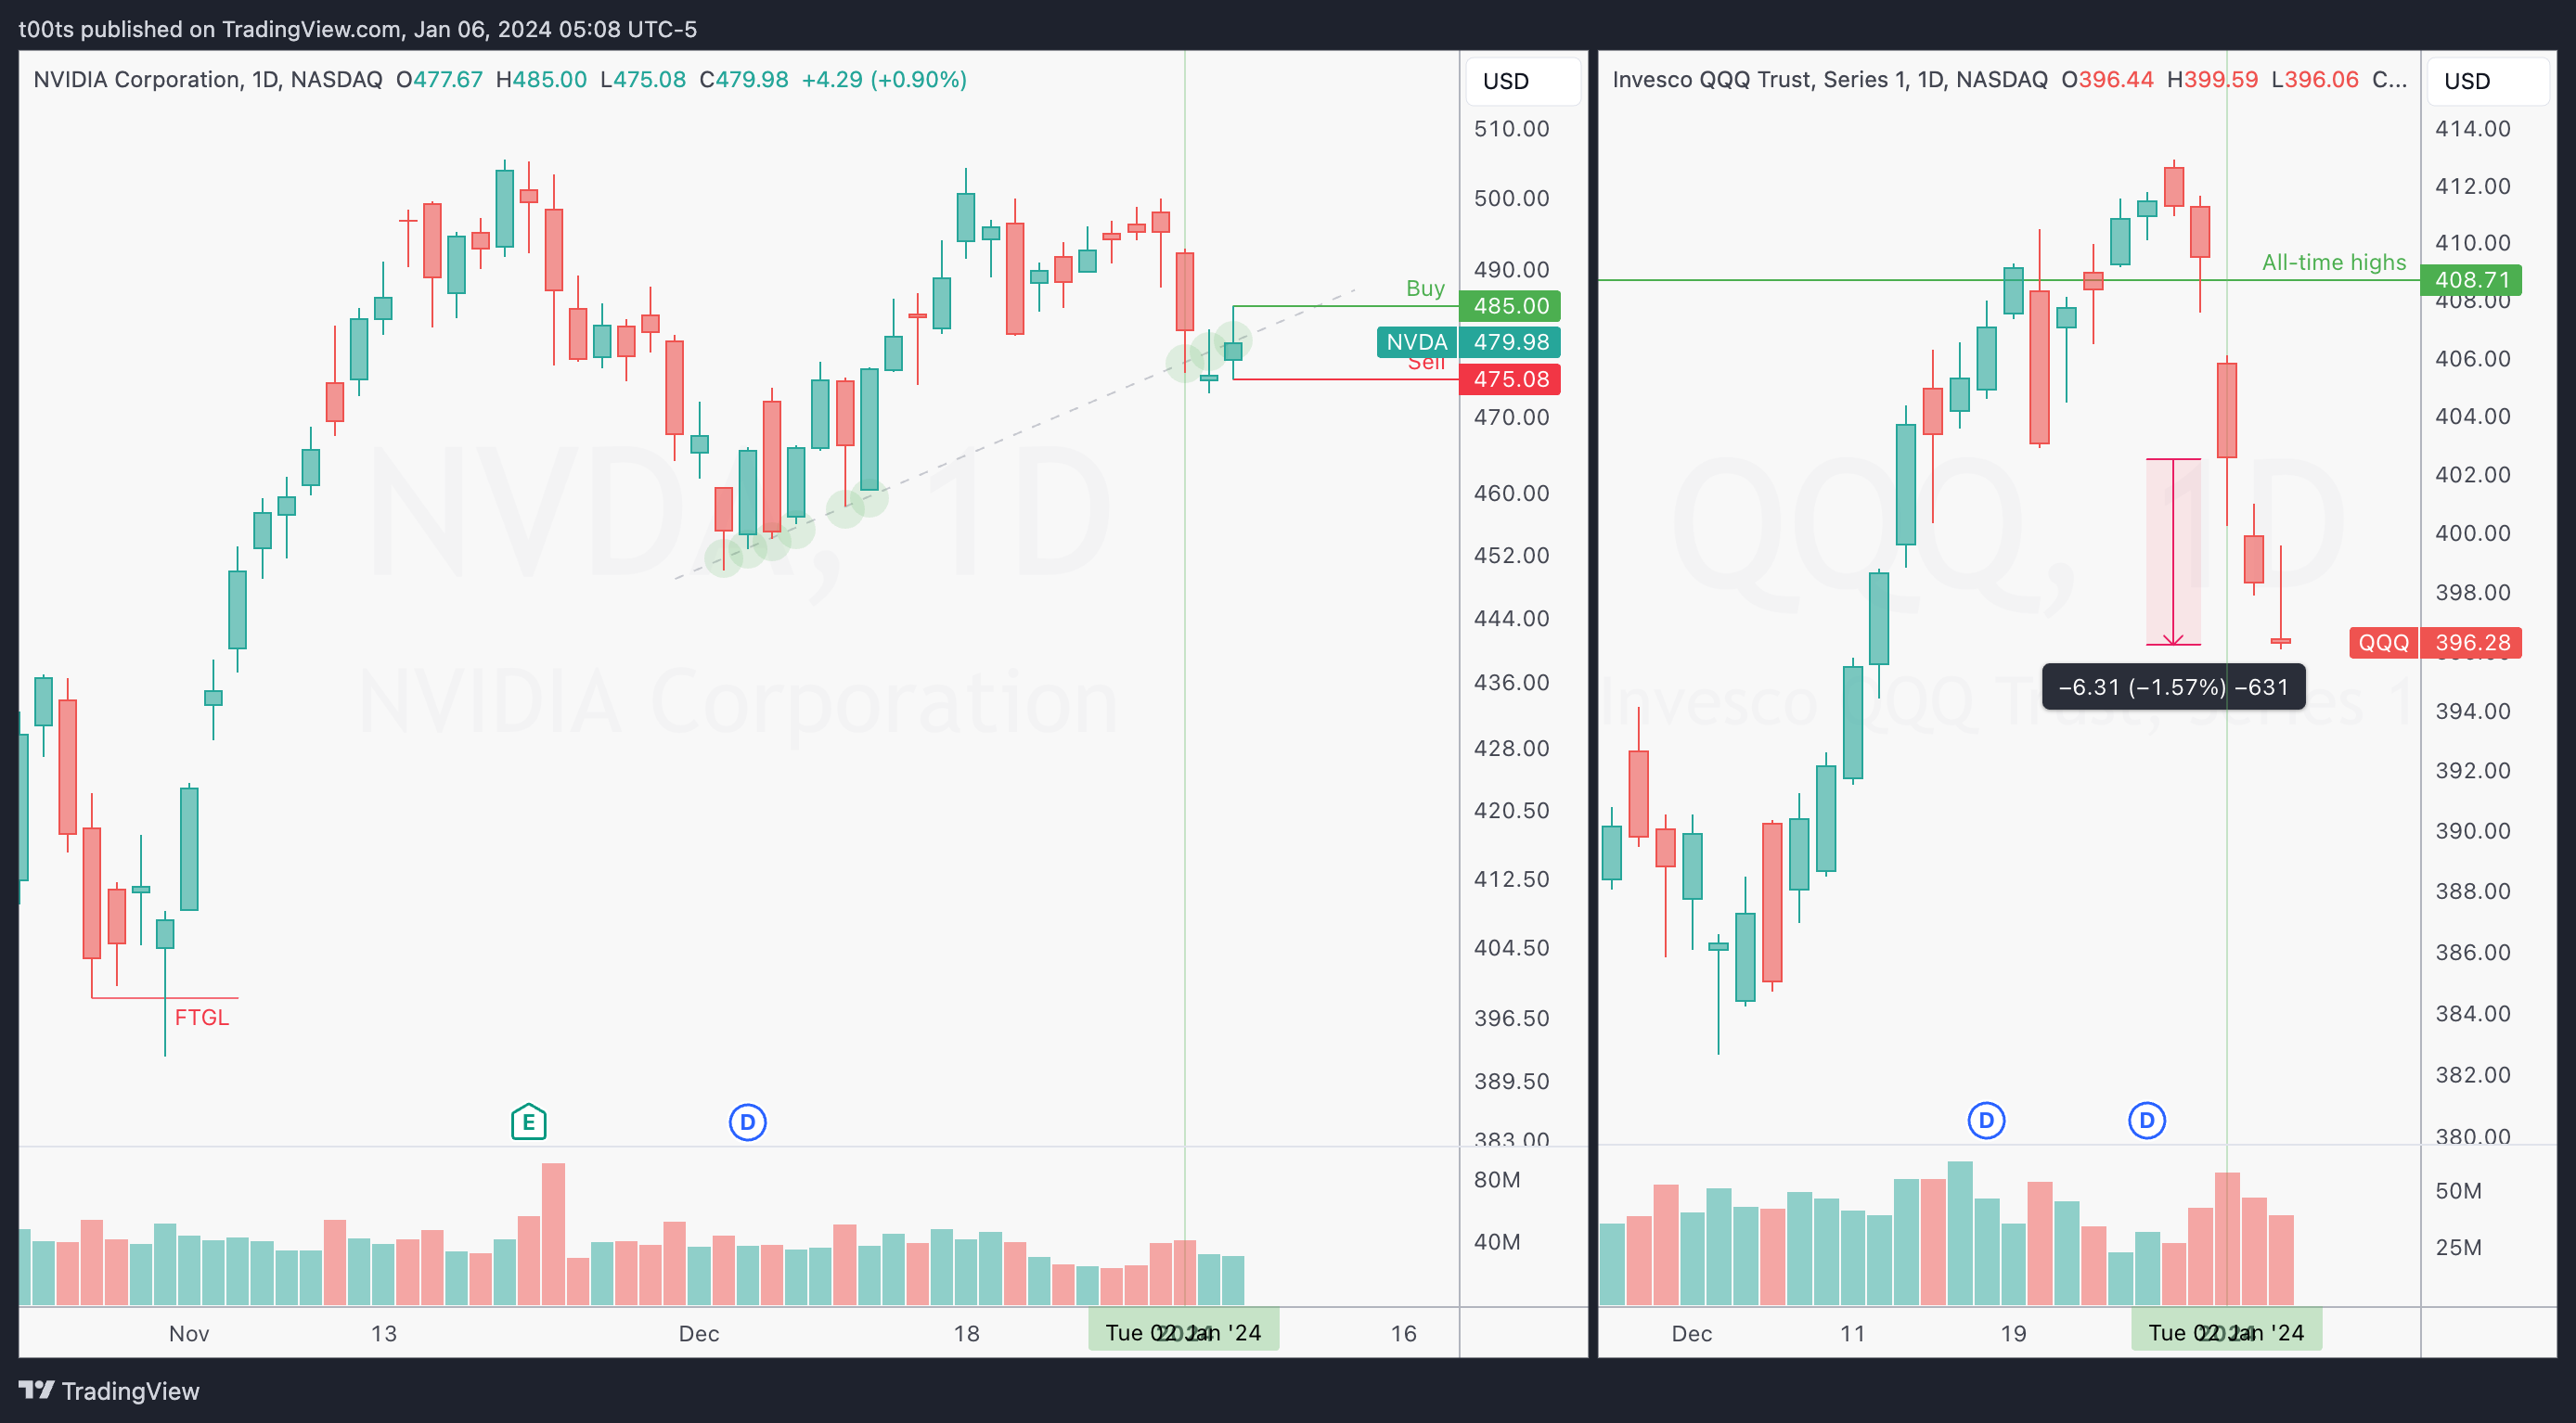
On the bottom left corner of the NVDA daily chart (left), we can appreciate with better detail the failure to go lower at the bottom of the range, leading to the subsequent uptrend all the way to the top.
Shifting our focus to recent price action, there's a clear pullback that matches that of the overall market for the start of this new year (marked with a green vertical line). Very similar bars for both NVDA and the QQQ (right). What really stands out is how the past couple days, the market is down over 1.5%, while NVDA has managed to stay pretty much flat!
I also highlighted a trendline that thought was interesting. After the move down, and despite the relative strength we just outlined, NVDA has two consecutive closes below the trendline. While trendline drawing is obviously very subjective, for the bears these two days of recent price action resemble a bear flag that could lead price lower. Given the top wicks we know there's been many shorts piling in expecting a continuation move down.
We should always think in terms of participant positioning and psychology. That's why I drew the Buy and Sell lines. They're both drawn from the perspective of the sellers that expect semiconductors to give up. If price breaks down, their anticipated bear flag may confirm. But if buyers take over the $485 "Buy" line, shorts are in trouble, and will be forced to cover.
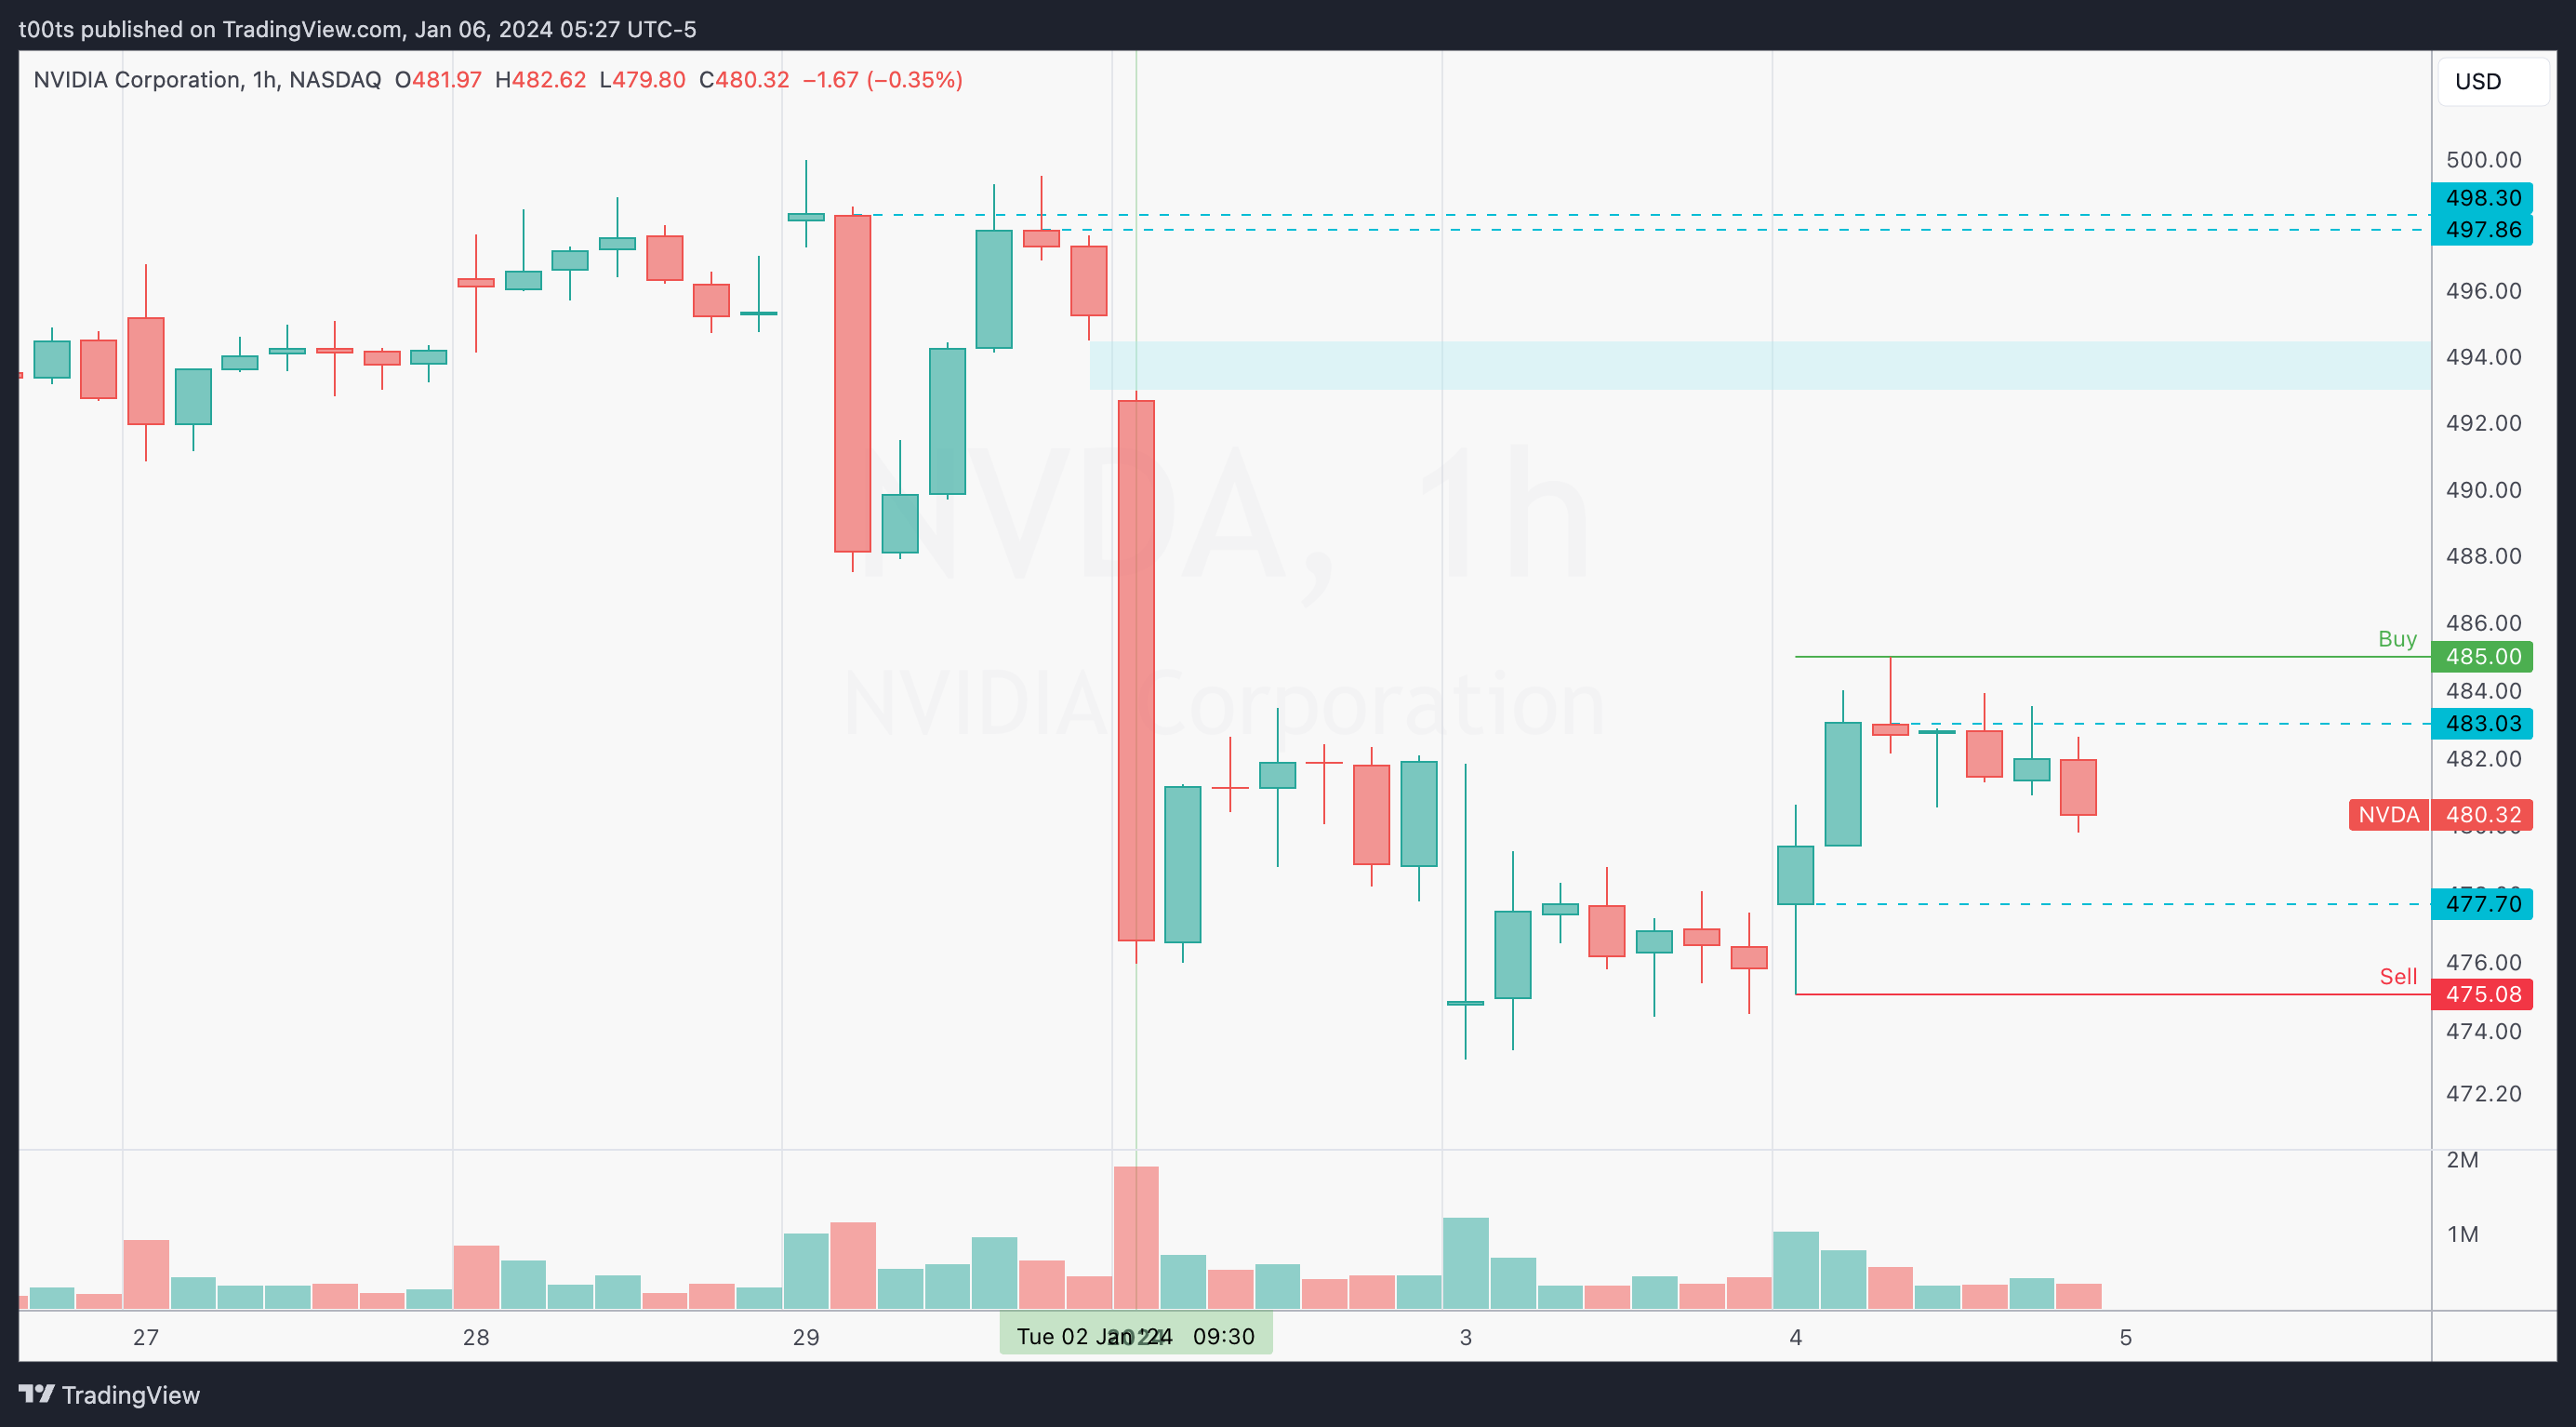
Hourly chart
Not much going on in the hourly chart. We can see how buyers are holding price despite the overall market pullback. On Jan 3rd sellers attempt to bring price down but buyers accumulated all day between $474 and $475. Yesterday they managed to close a little higher, again, despite a very weak market.
In terms of levels, there's plenty of room to the upside if we can trend above $483. We just went over how price trading above $485 would hurt short sellers. Now we're seeing that there's plenty of room to move if that does happen. These little cues give us context to frame our ideas and eventually decide whether or not an opportunity is worth our time and risk.
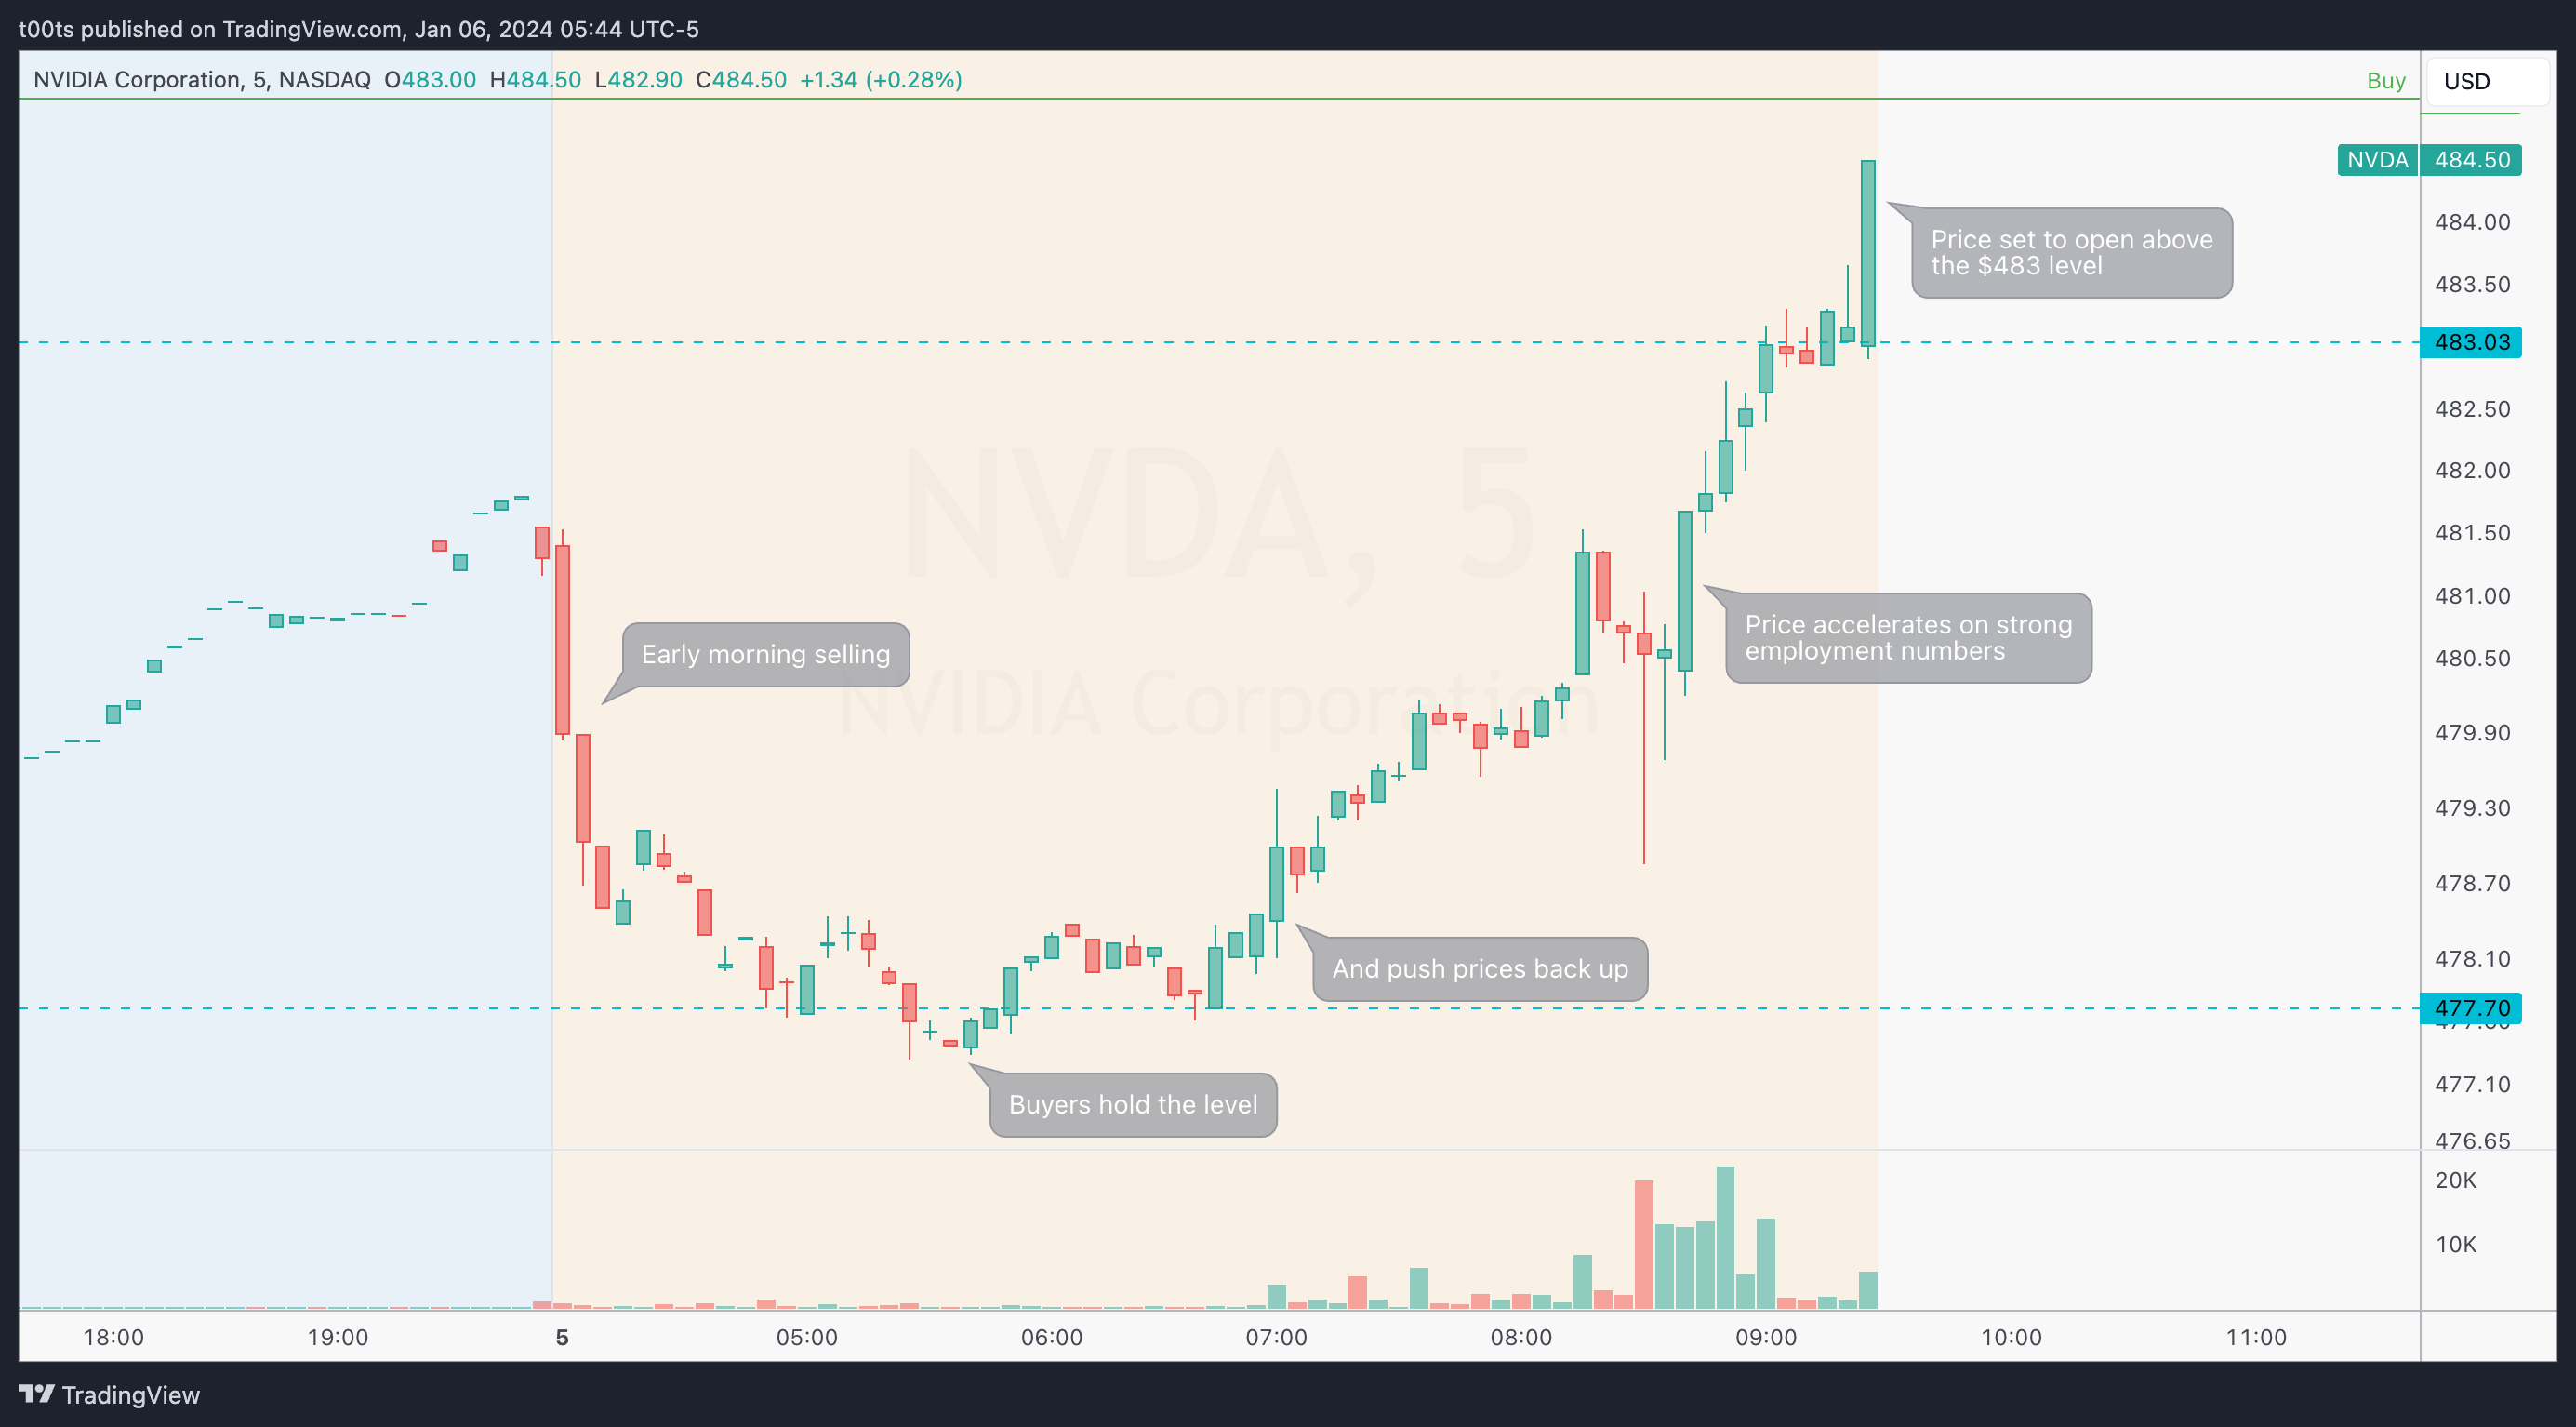
Pre-market action
Here's where NVDA really grabbed our attention and became In Play. This pre-market action cannot go unnoticed, as we're set to open above the $483 level we were just going over a minute ago. The trend is very strong and denotes buyers have completely taken over during the pre-market session. Not surprisingly, after an initial push down, price turns at a level and comes straight up to test the next one. We're also very close to the $485 where shorts are in pain.
Pause for a moment and put yourself in the mind of someone who's short this stock. What are you thinking? What is your game plan? How are you preparing yourself to defend your position? Do you know where you're willing to cut it? Again, participant psychology is everything here. You'll get all the right answers.
The trade
Back to our CPT Framework:
Cue(s)
Relative strength vs. the overall market in last two sessions
Strong uptrend during the pre-market, denoting further relative strength
Intraday cue: Price consolidating above daily buy, putting shorts in trouble
Intraday cue: Price breaking out of the consolidation, causing pain for shorts
Plan
Price has been chopping around above our daily buy after a strong opening drive move. We're expecting news at 10am, so we can either buy the low of the range and risk against our daily buy level, or wait to see how price reacts to the 10am news and, if we do break out, find a potential higher low on the 5m/2m chart and take the trade, targeting the gap fill above.
Trigger
Price breaking above the signal bar that establishes the potential higher low.
5m chart
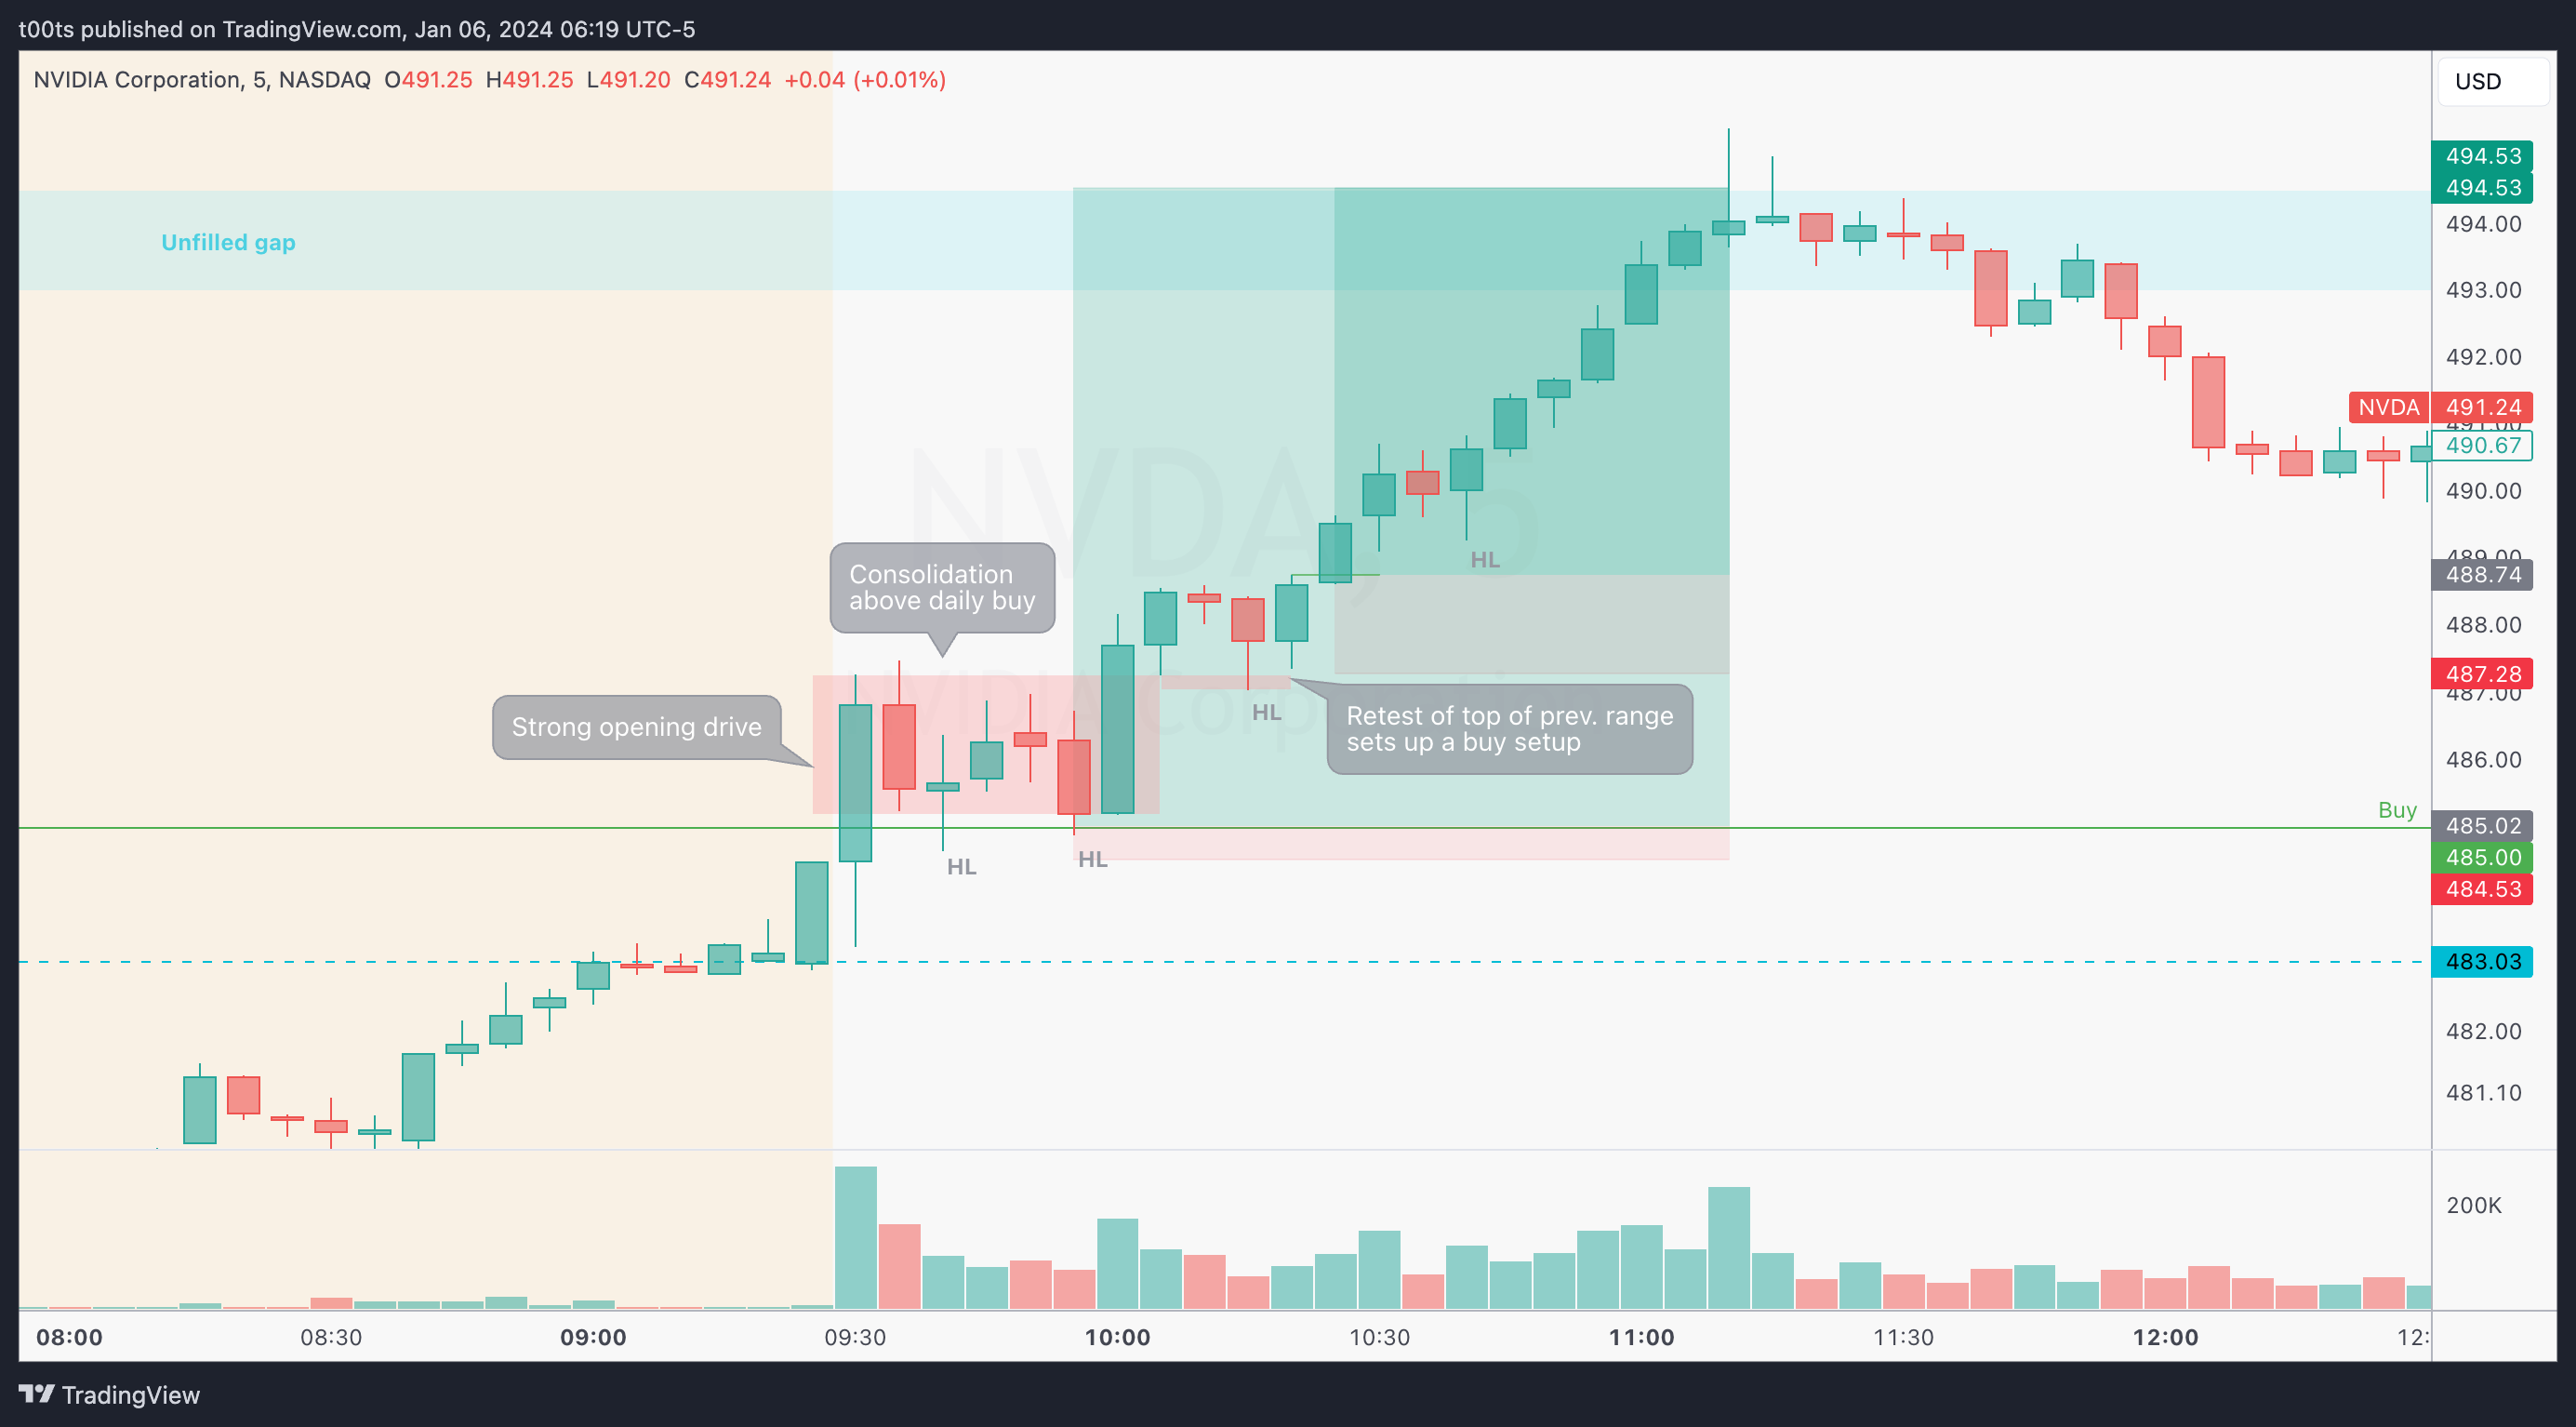
What we see immediately is a strong push right off the open. We dip under the opening print for a few seconds and immediately push above our daily buy line. At this point many shorts are probably still holding onto their positions, it could be a quick bull trap and then down we go. In all honesty, I did take a small stab at a short here in case we did fail. But we didn't. Price held the daily buy beautifully, twice, before pushing higher and putting all the shorts in real trouble.
2m chart
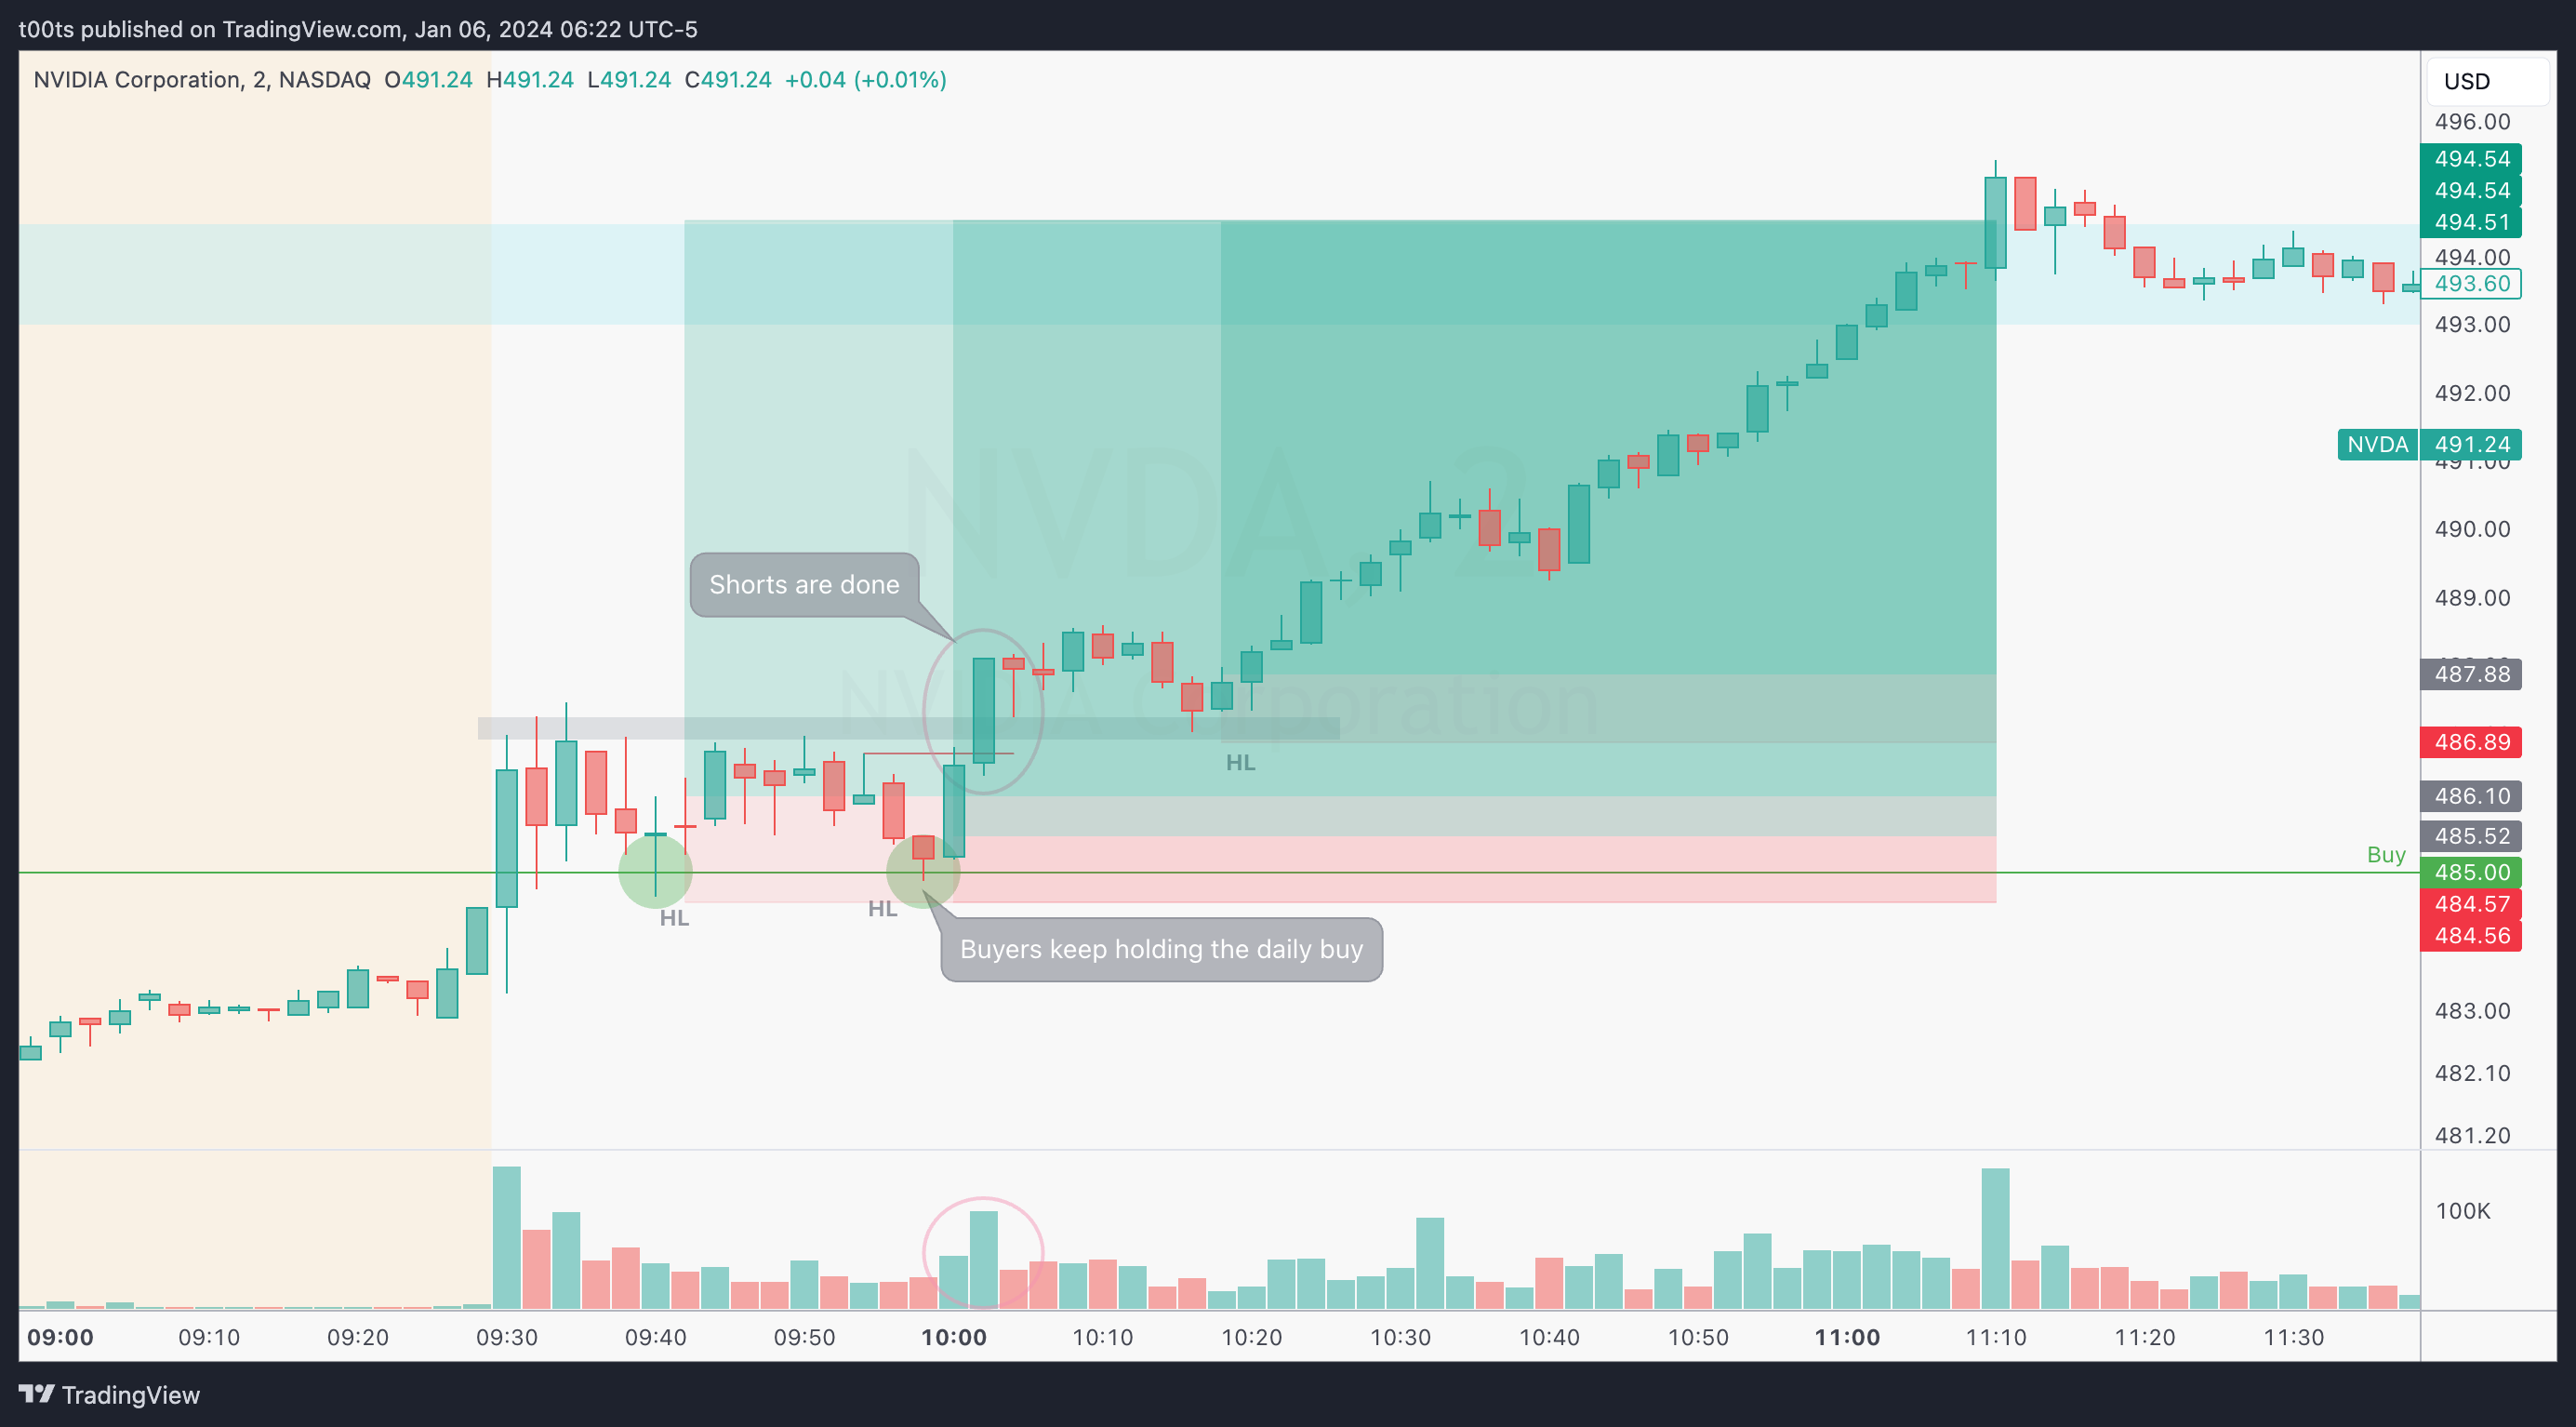
The 2m chart gives us closer detail of multiple valid entries for the long trade. That first entry on the first higher low does trigger and, while you do hold through some chop, price never stops you out. The second entry, on the second higher low, is in my opinion risky because we had 10am news coming out. Of course if you have a stop in place the market can't hurt you, but again, I was trading this and chose not to take it because of the news. The third entry, which aligns with the second entry of the 5m chart we just saw, is in my opinion the safest entry. Despite having no actual level there, we do have enough cues to support our trade idea.
Closing notes
One of those trades for the keen and prepared. There were a few valid entries offering anywhere from 6R to 8R. I personally failed to capitalize on this one. As Tom Dante says: “It's very easy to take good trades. What's hard is not doing anything stupid in between”. I got distracted with the possibility of shorts setting up a bull trap and while scrapping for peanuts failed to position myself properly for the long. This has been my attempt of reviewing this play so I can hopefully find myself on the right side next time.
I am posting one trade writeup every day throughout 2024. I focus on large caps using levels and price action. The subscription is absolutely free and will always be. I will strive to provide value by offering clues and ideas for you to enhance your edge. Let’s grow together!
👌🏼