
Adv. Micro Devices (AMD) - Jan 8th 2024
A profitable sympathy play to NVDA's multi-month breakout

Higher timeframe context
AMD and the whole semiconductor industry have been leading the market for the past few months.
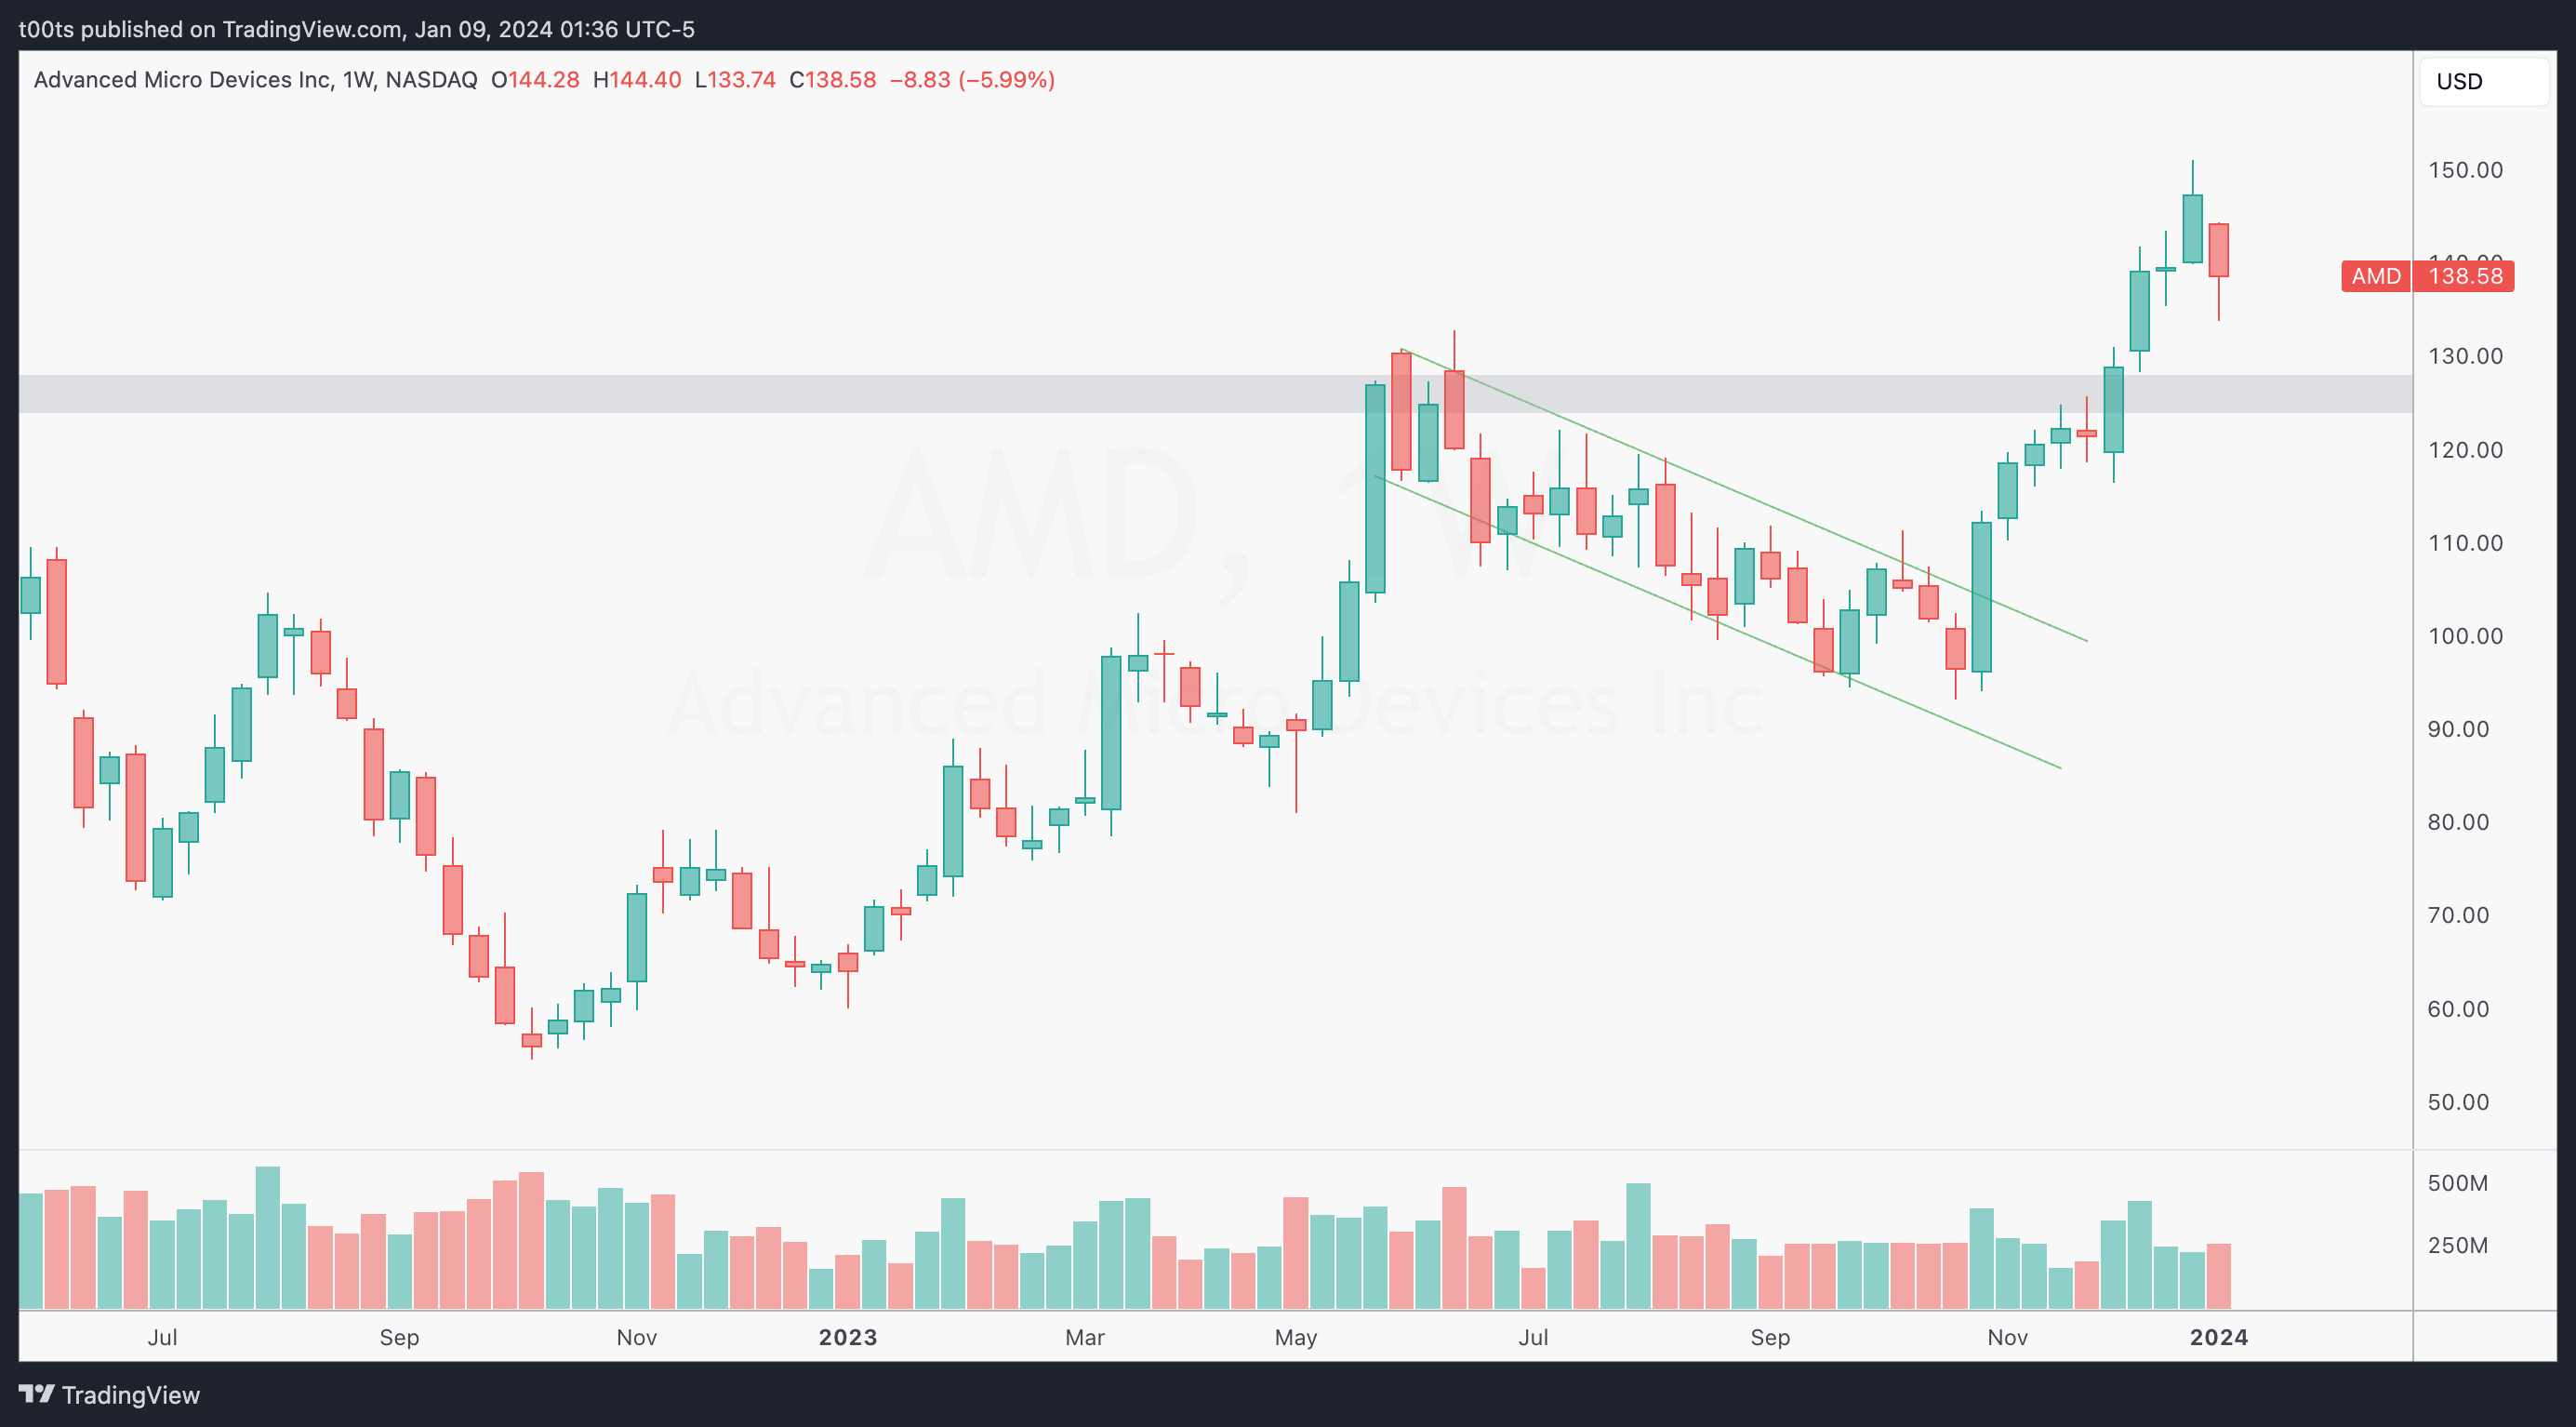
Weekly chart
The weekly chart displays a solid uptrend with a recent pullback matching that of the overall market. Nothing too fancy to highlight here. The strength is clear and the pullback is healthy.
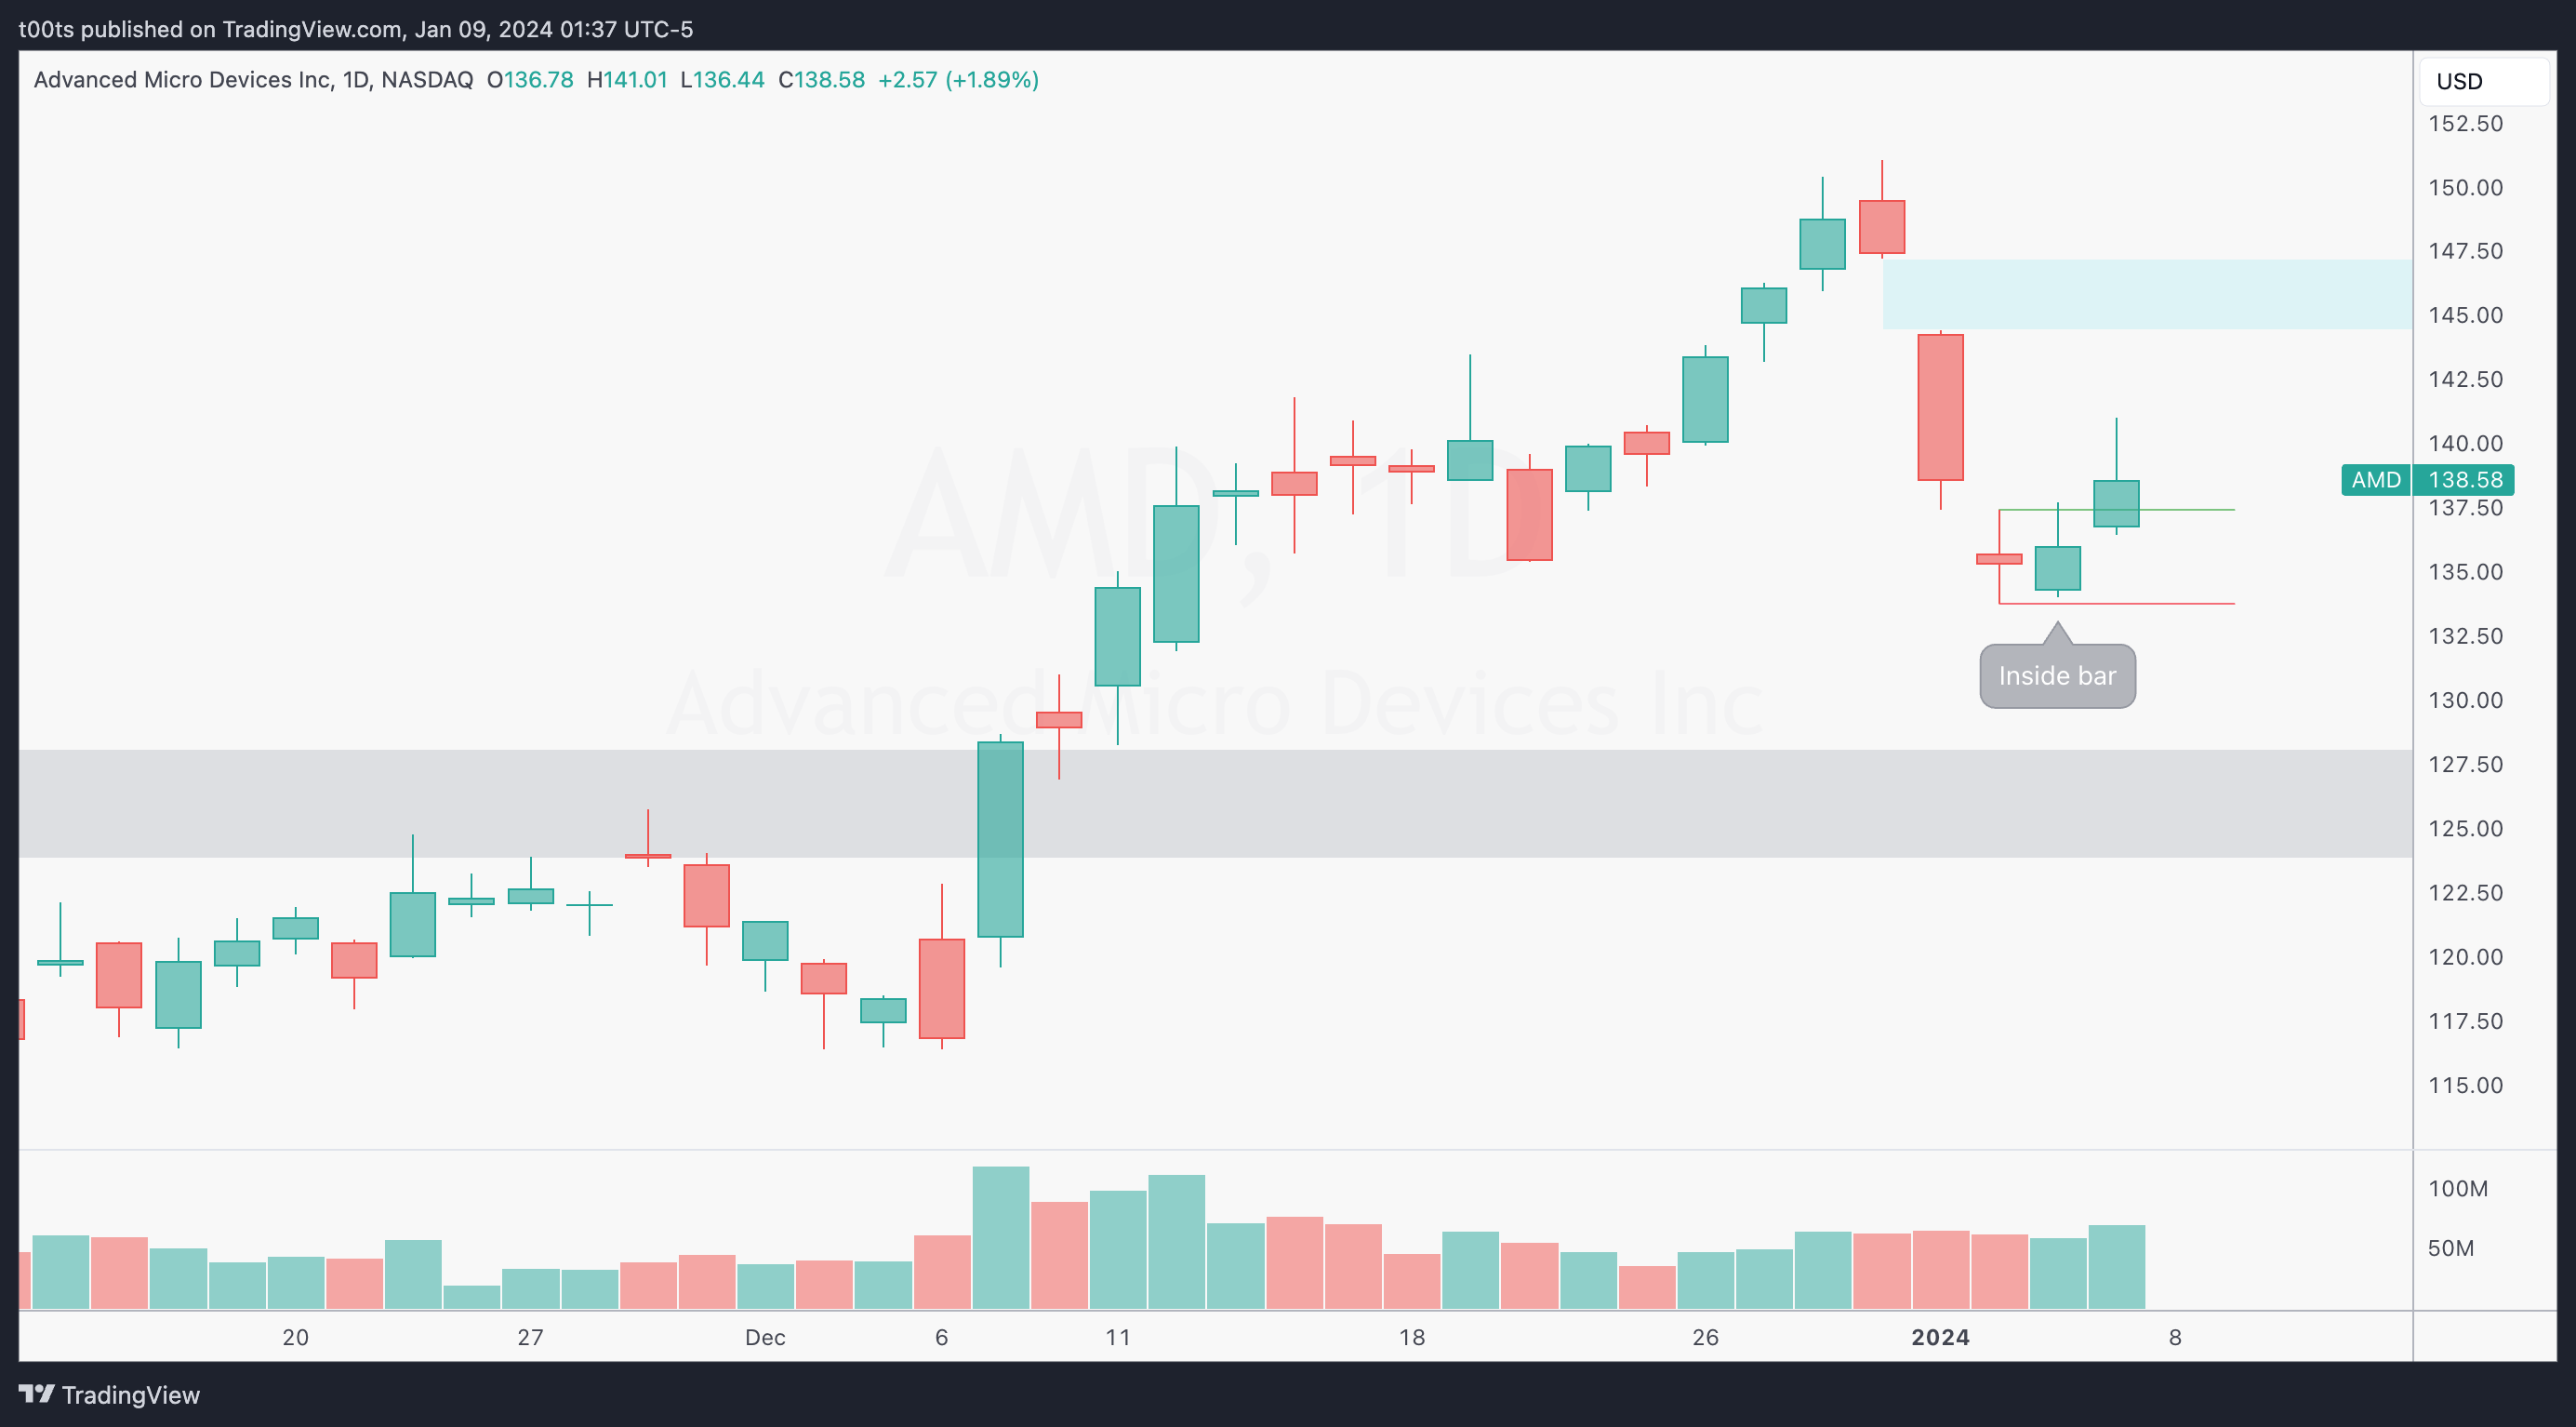
Daily chart
When we zoom into the daily chart, we notice a similar pattern to what we discussed last week when dissecting NVDA. After the sharp downturn, price ranged for a couple days and then broke out to the upside. The bar I've marked as inside bar is technically not an inside bar, but in trading, nothing will ever be perfect. So when it's close enough, you can take it for what you'd expect. Unless the low of this breakout bar is taken out, shorts are not in play, at least not with high certainty.
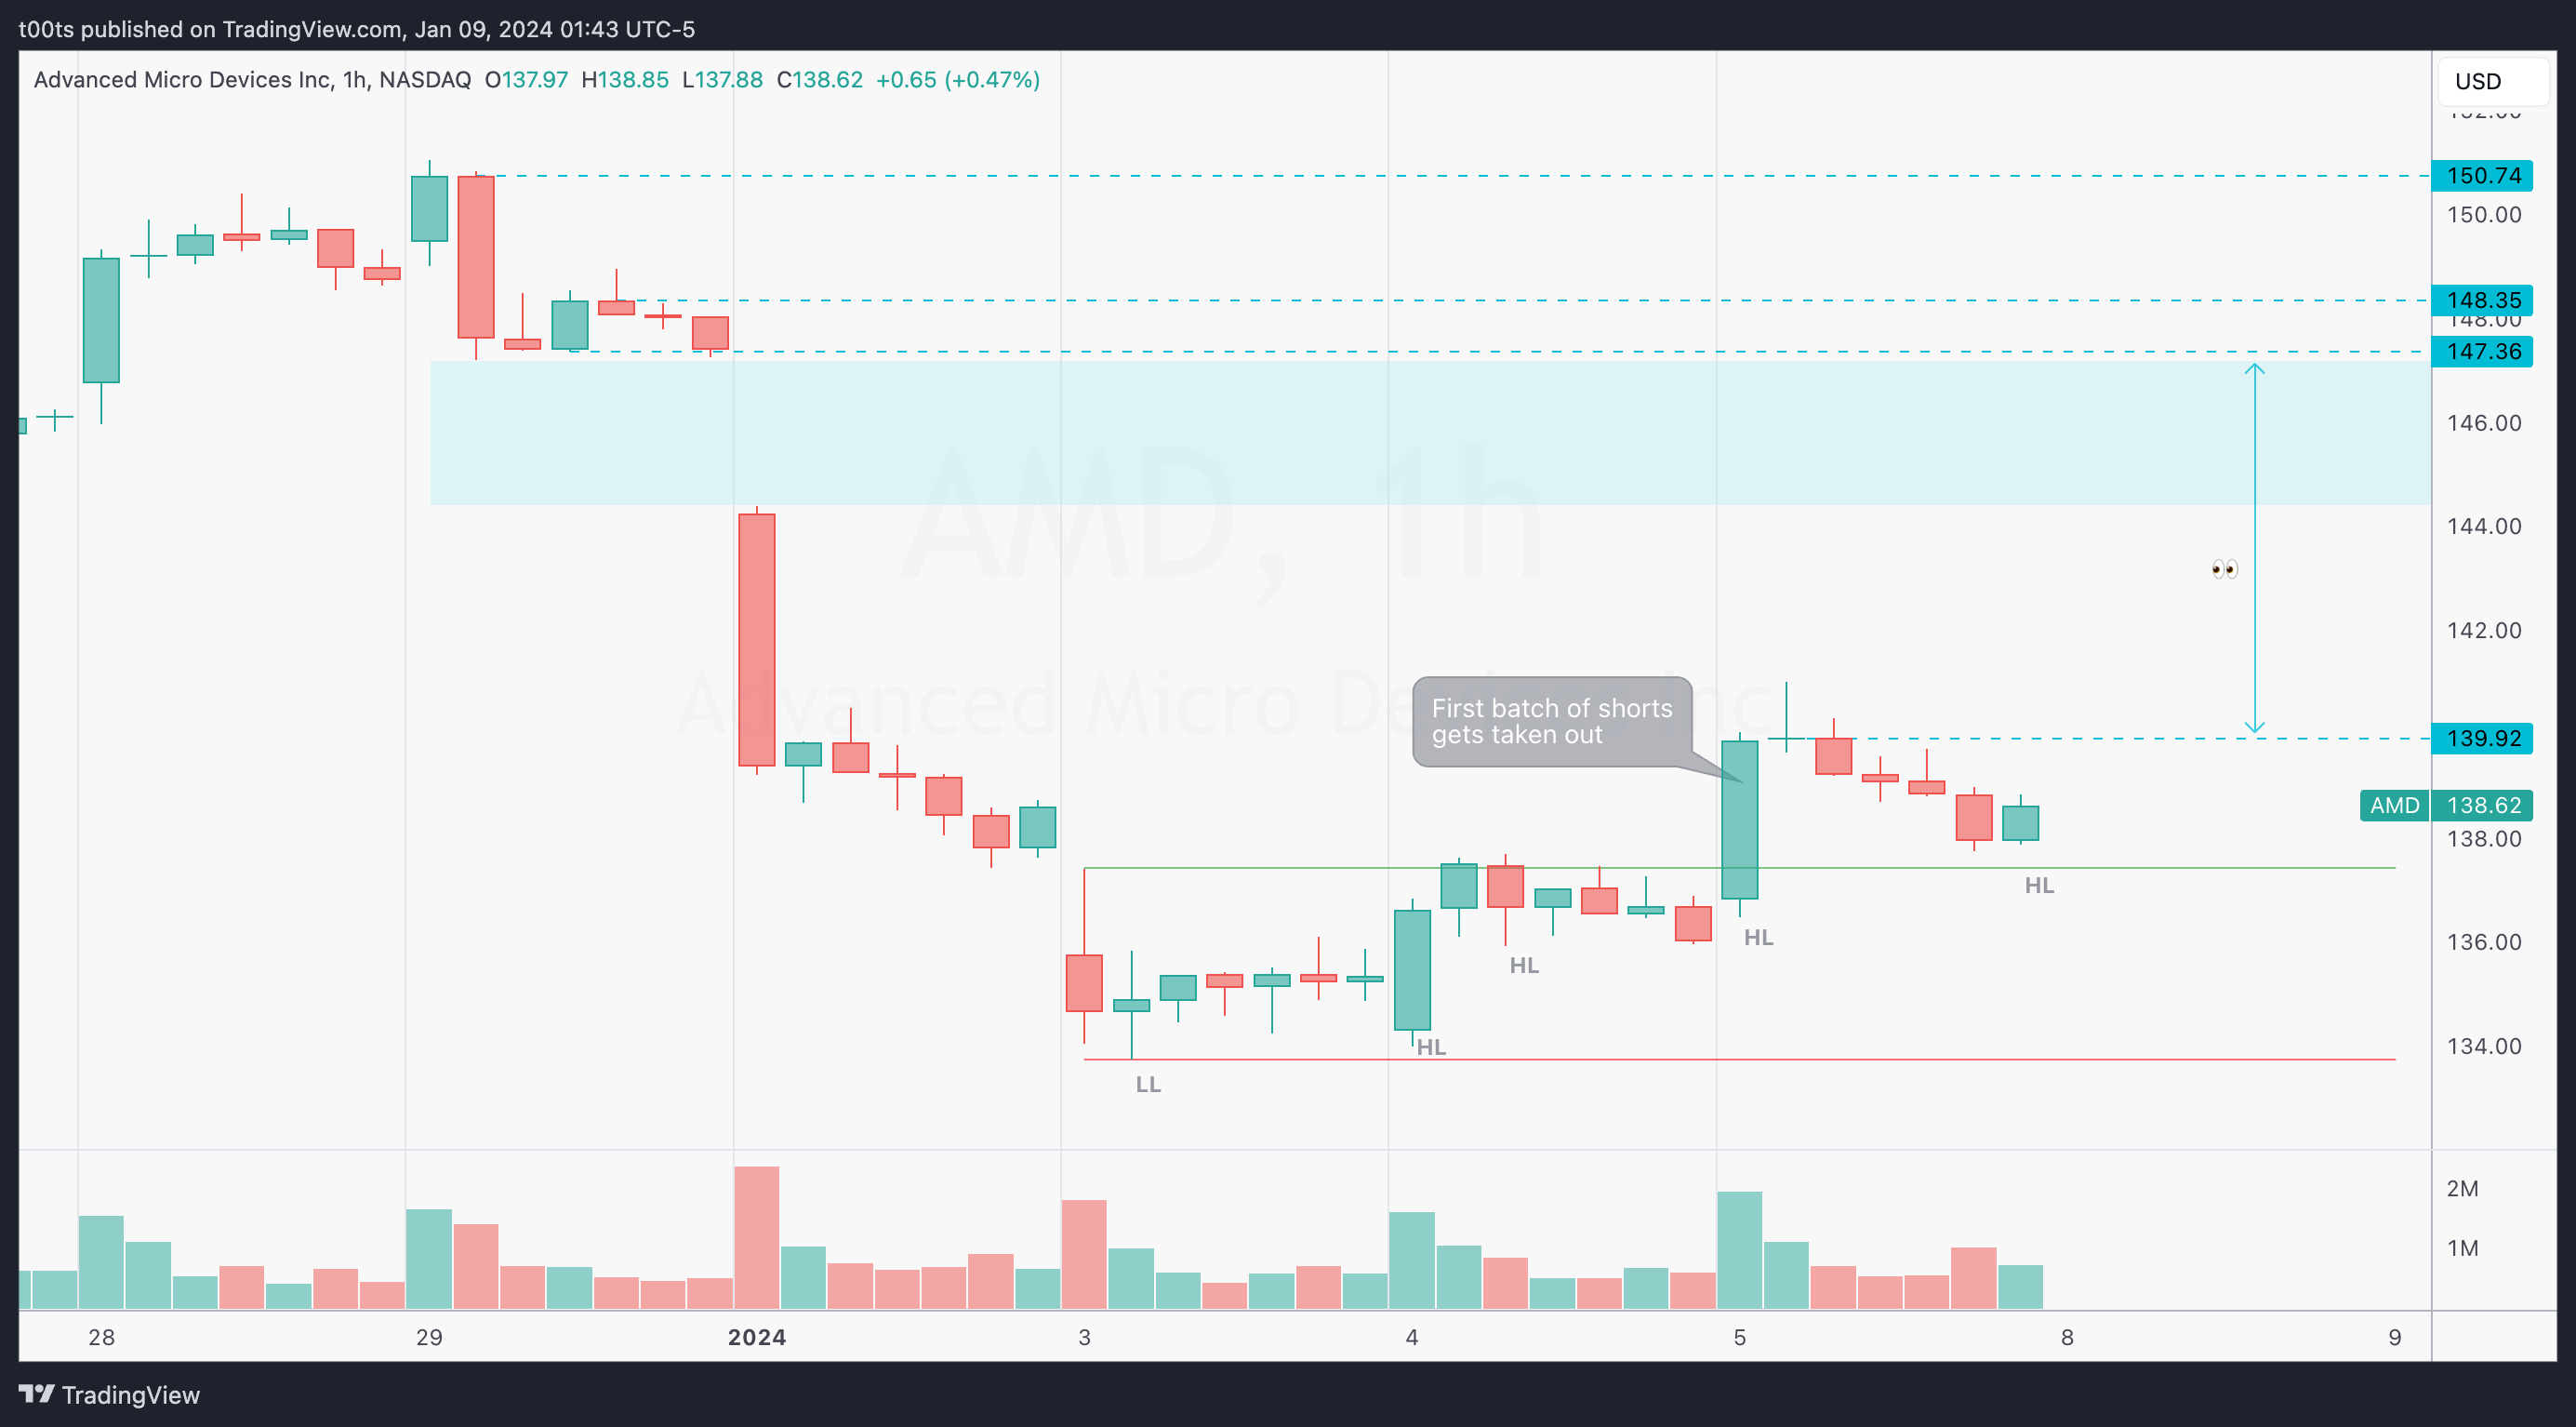
Hourly chart
Despite the strong move down right at the start of the year, the hourly chart displays an uptrend. We can clearly observe higher lows being formed consistently, and we can now appreciate with greater detail how that first batch of shorts is forced to cover their positions as buyers are still willing to bid at these prices.
Two things stand out here: The gap above and the amount of room we have to the upside if the $140 area breaks. If we can trend above the $139.92 level, there's around 7 points of upside with no relevant levels.
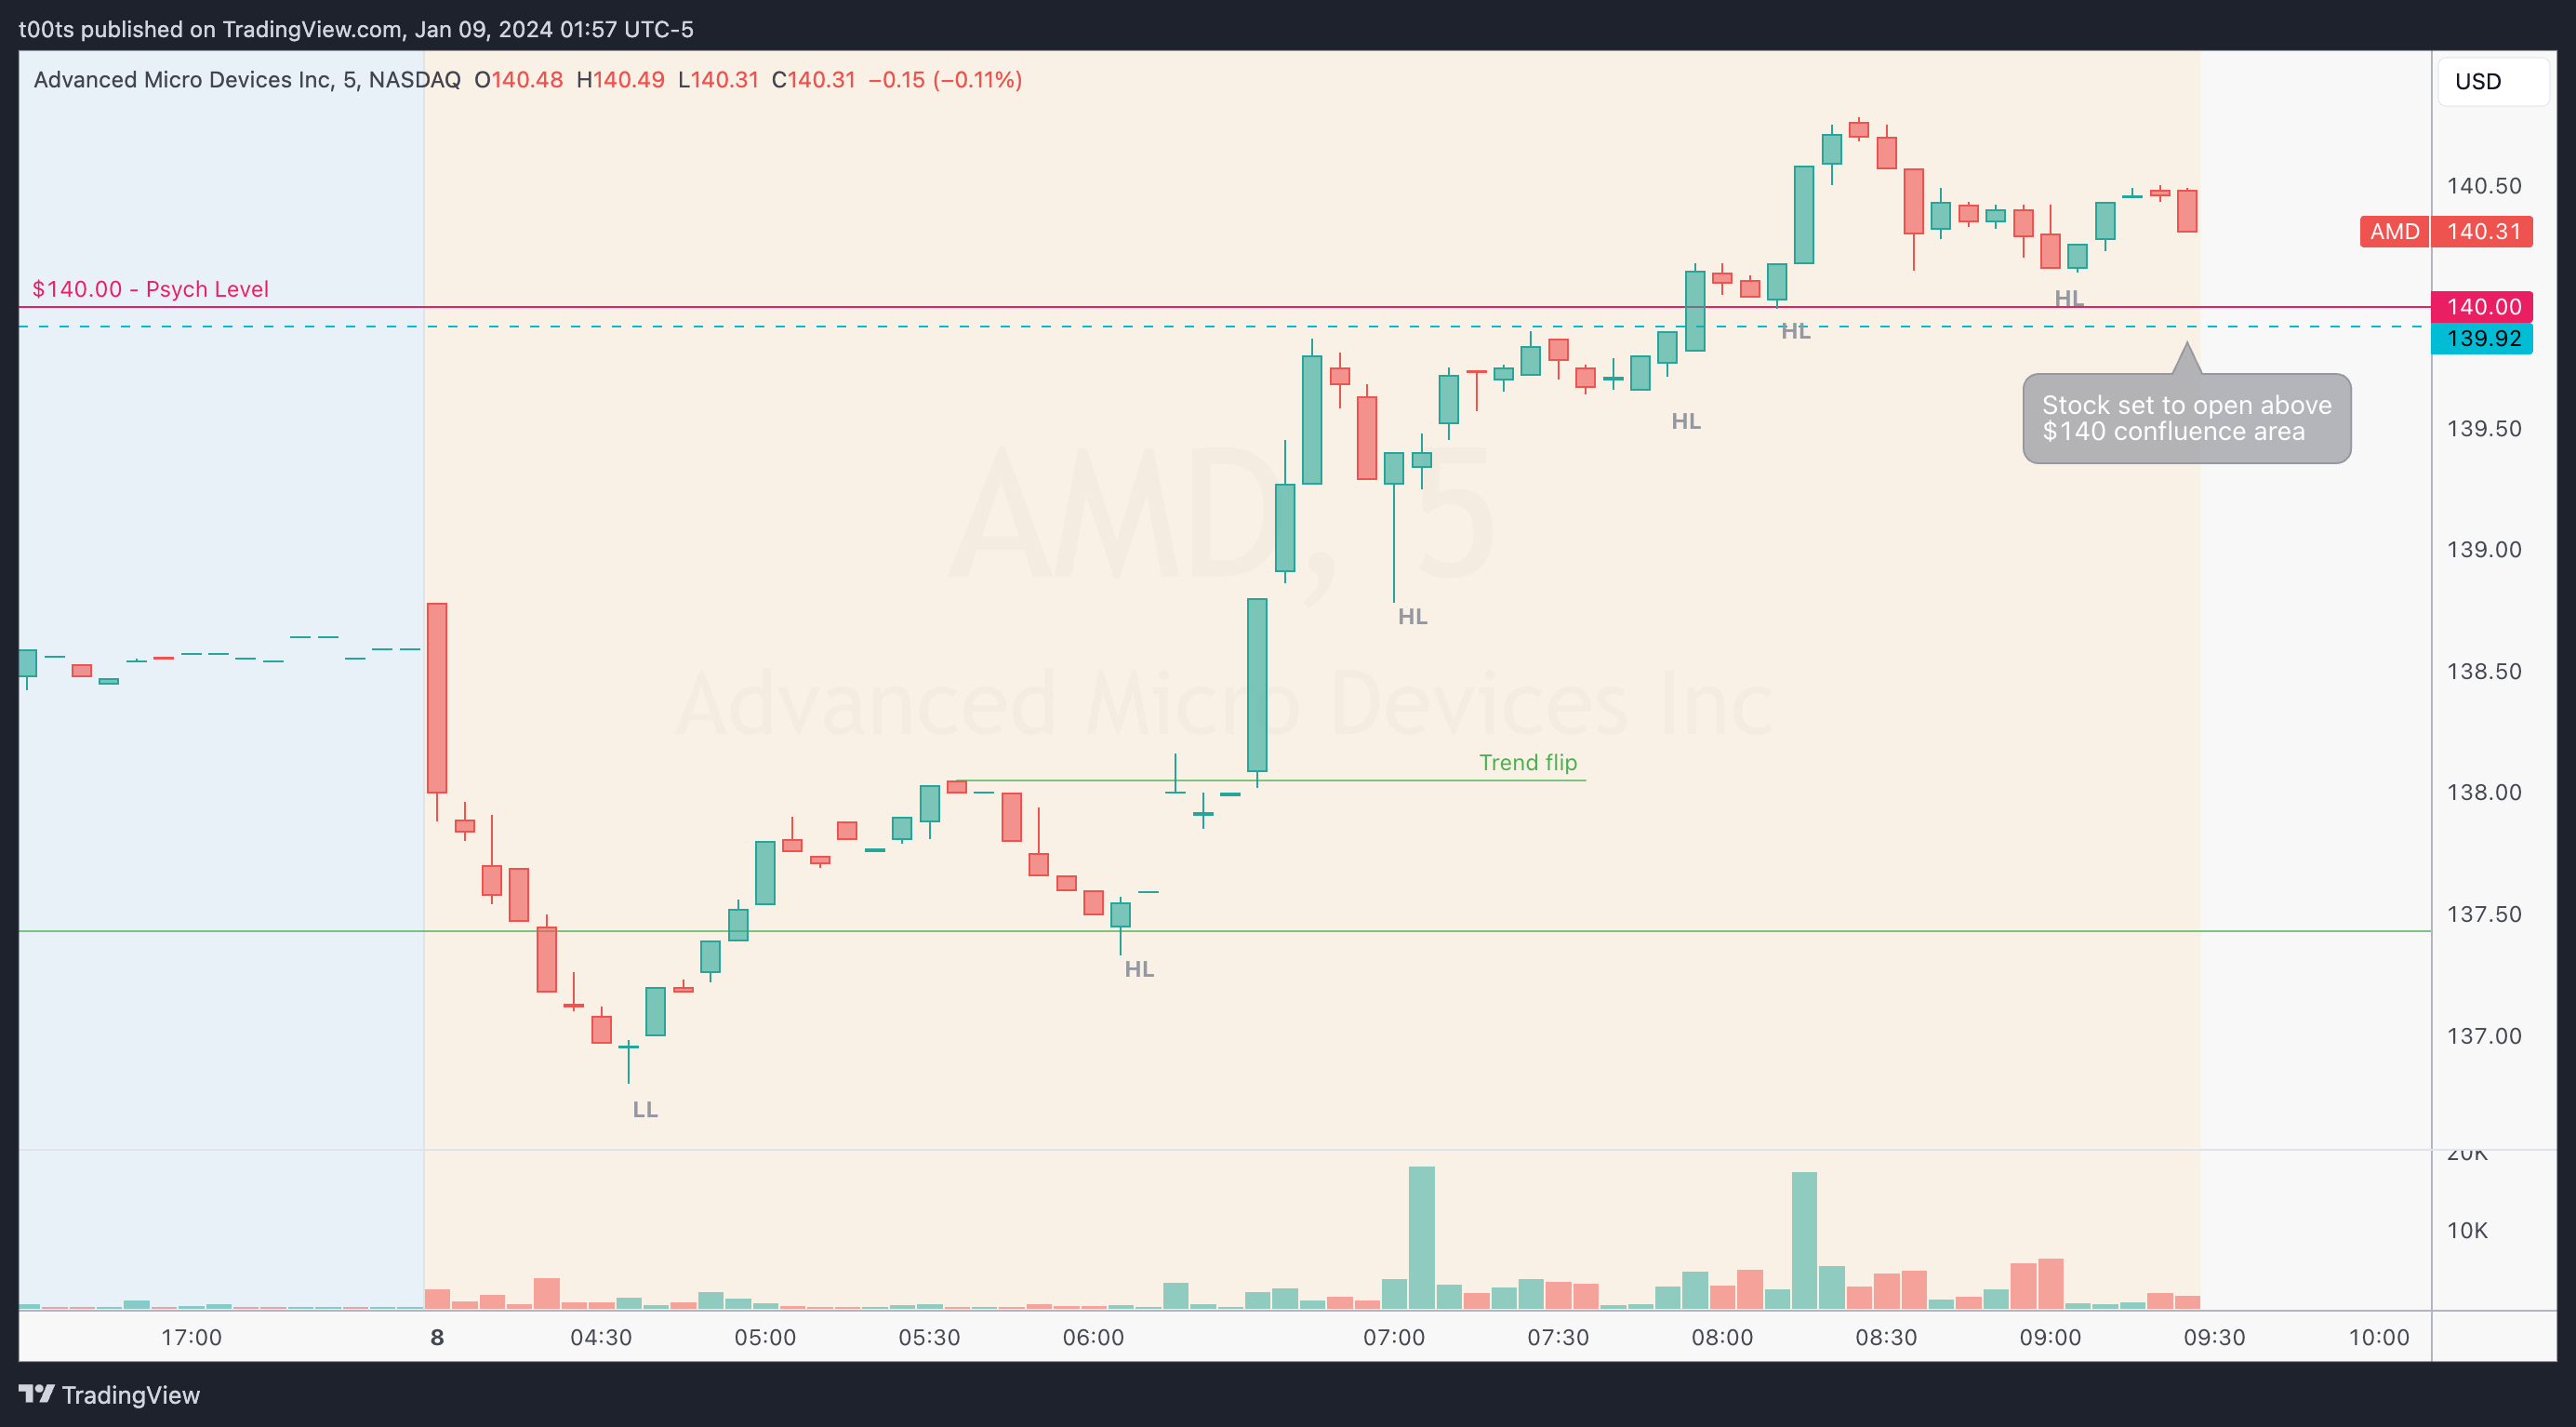
Pre-market action
Some plays are brought to our attention by the pre-market action, usually in the form of relative strength or weakness vs. the indices. This was one of them.
As we can see in the chart below, after a move lower back into the range, buyers quickly take over and start forming a pretty strong uptrend. Eventually, price is set to open above the $140 psychological level and our $139.92 level of interest. This is a setup we've seen before, and we're surely interested in trading it.
The trade
The reference for this trade is the $139.92 level, or the $140 area overall. Ideally, we'd want to see a retest of these levels to go long, risking off of them. But the retest never comes, yet the trade made sense anyway.
Let’s look at it with our CPT Framework:
Cue(s)
Market-leading stock
Strong pre-market action: Opening above our key level and the $140 psych. mark
A lot of moving room above, with no relevant levels of interest
Daily unfilled gap above
Intraday cue: Strong opening drive, price never comes down to test the level
Intraday cue: Inside bar after initial push, potential 3-bar play
Plan
Stock opens strong and fails to test the $140 area, so we have to find ourselves another entry.
Any bullish entry will do. Usually, when trading a strong stock near the open, I'll go for a higher low on the 2m chart. There's plenty of traders that use retests at VWAP, 5m EMA9, or a combination of both.
In this case, as price develops, the second 5m bar of the day forms an inside bar in the upper range of the first bullish trend bar. This sets up a 3-bar play setup which we can trade off of. Why? Because we can establish a clear entry and invalidation level. As shown on the chart, we use the inside bar breakout as a with trend entry, risking its lows.
Trigger
Price breaking above the inside bar and triggering a potential 3-bar play.
5m chart
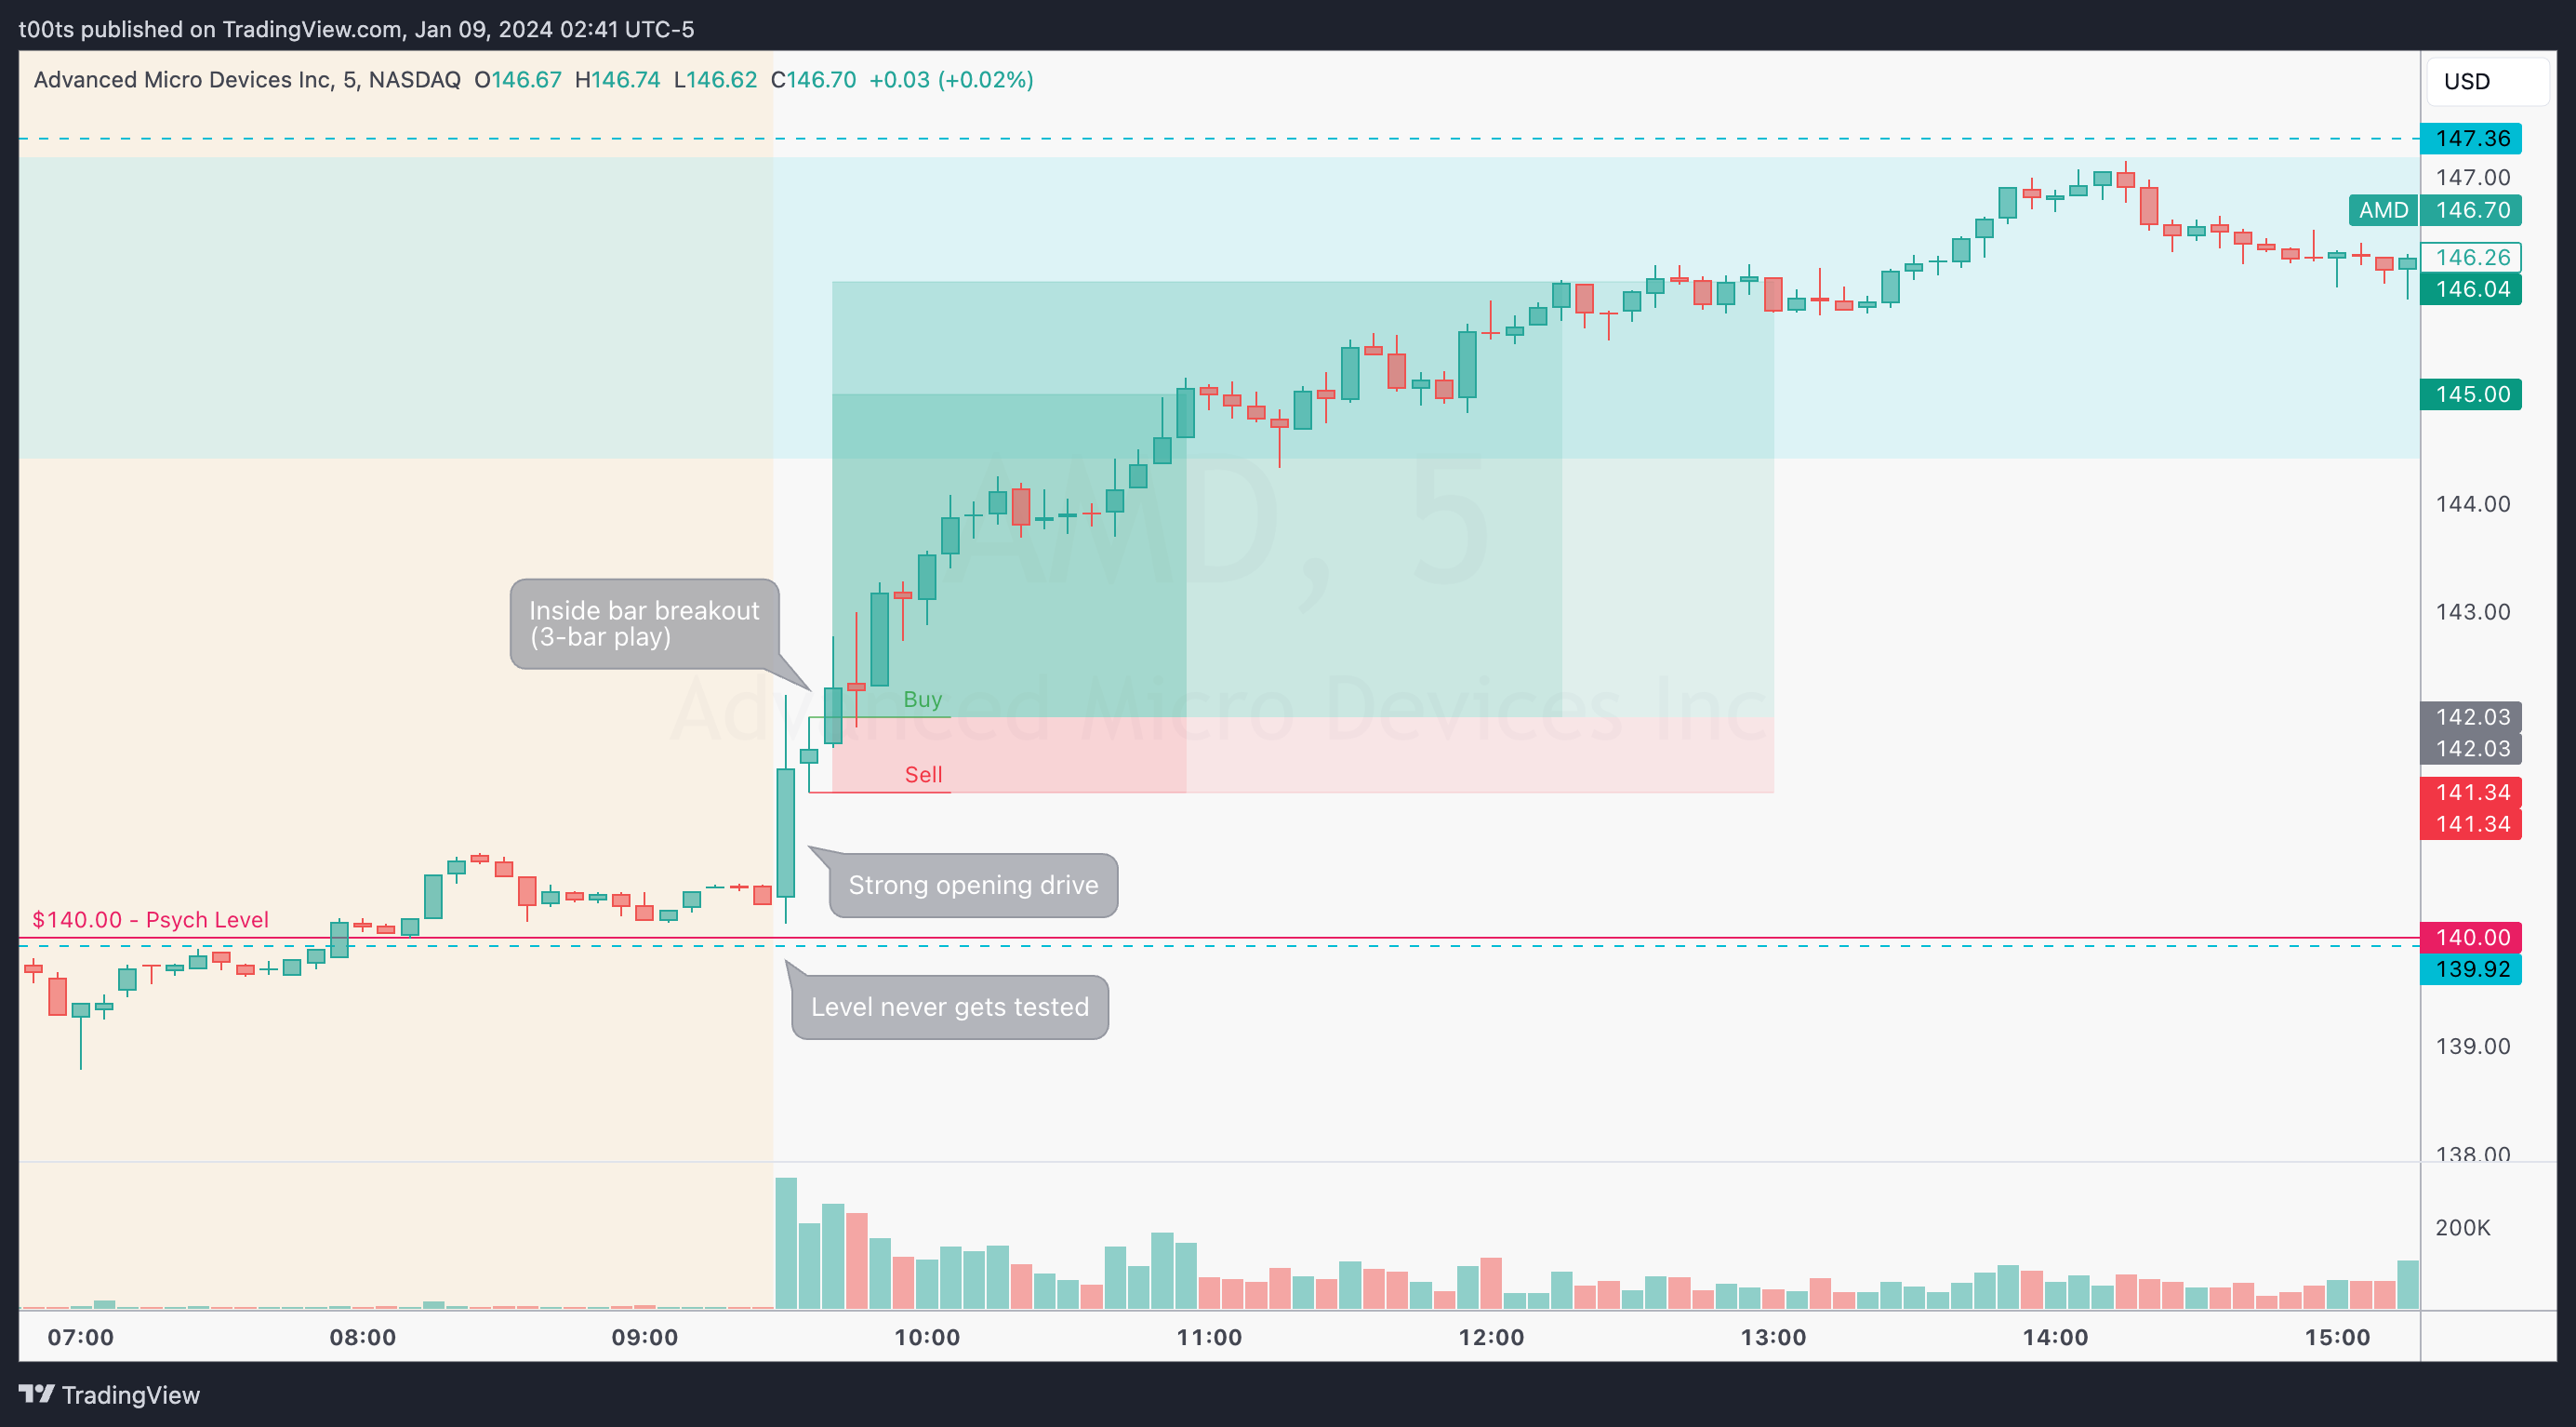
The action was so clean it’s hard to give any valuable comments here. AMD's counterpart NVDA was on an absolute tear breaking a multi-month range so that surely helped, but even when NVDA was later pulling back, AMD bulls proved to be more resilient and kept buying, further adding to our profits.
Personally, my first target was $145 psychological level. More often than not, these levels act both as magnets and as targets for many traders. I held a core until 1pm EST, where I finally closed the trade.
In hindsight, I failed to hold for that last move. But, as I posted on 𝕏, the trade was no longer worth holding for me. At that point the stock was starting to range and my risk-to-reward became too skewed. It just made more sense to lock it in.
The following chart shows my trailing stops. I want to go over each of them briefly to add a bit of sauce to a, so far, rather straightforward post:
5m chart with trailing stops
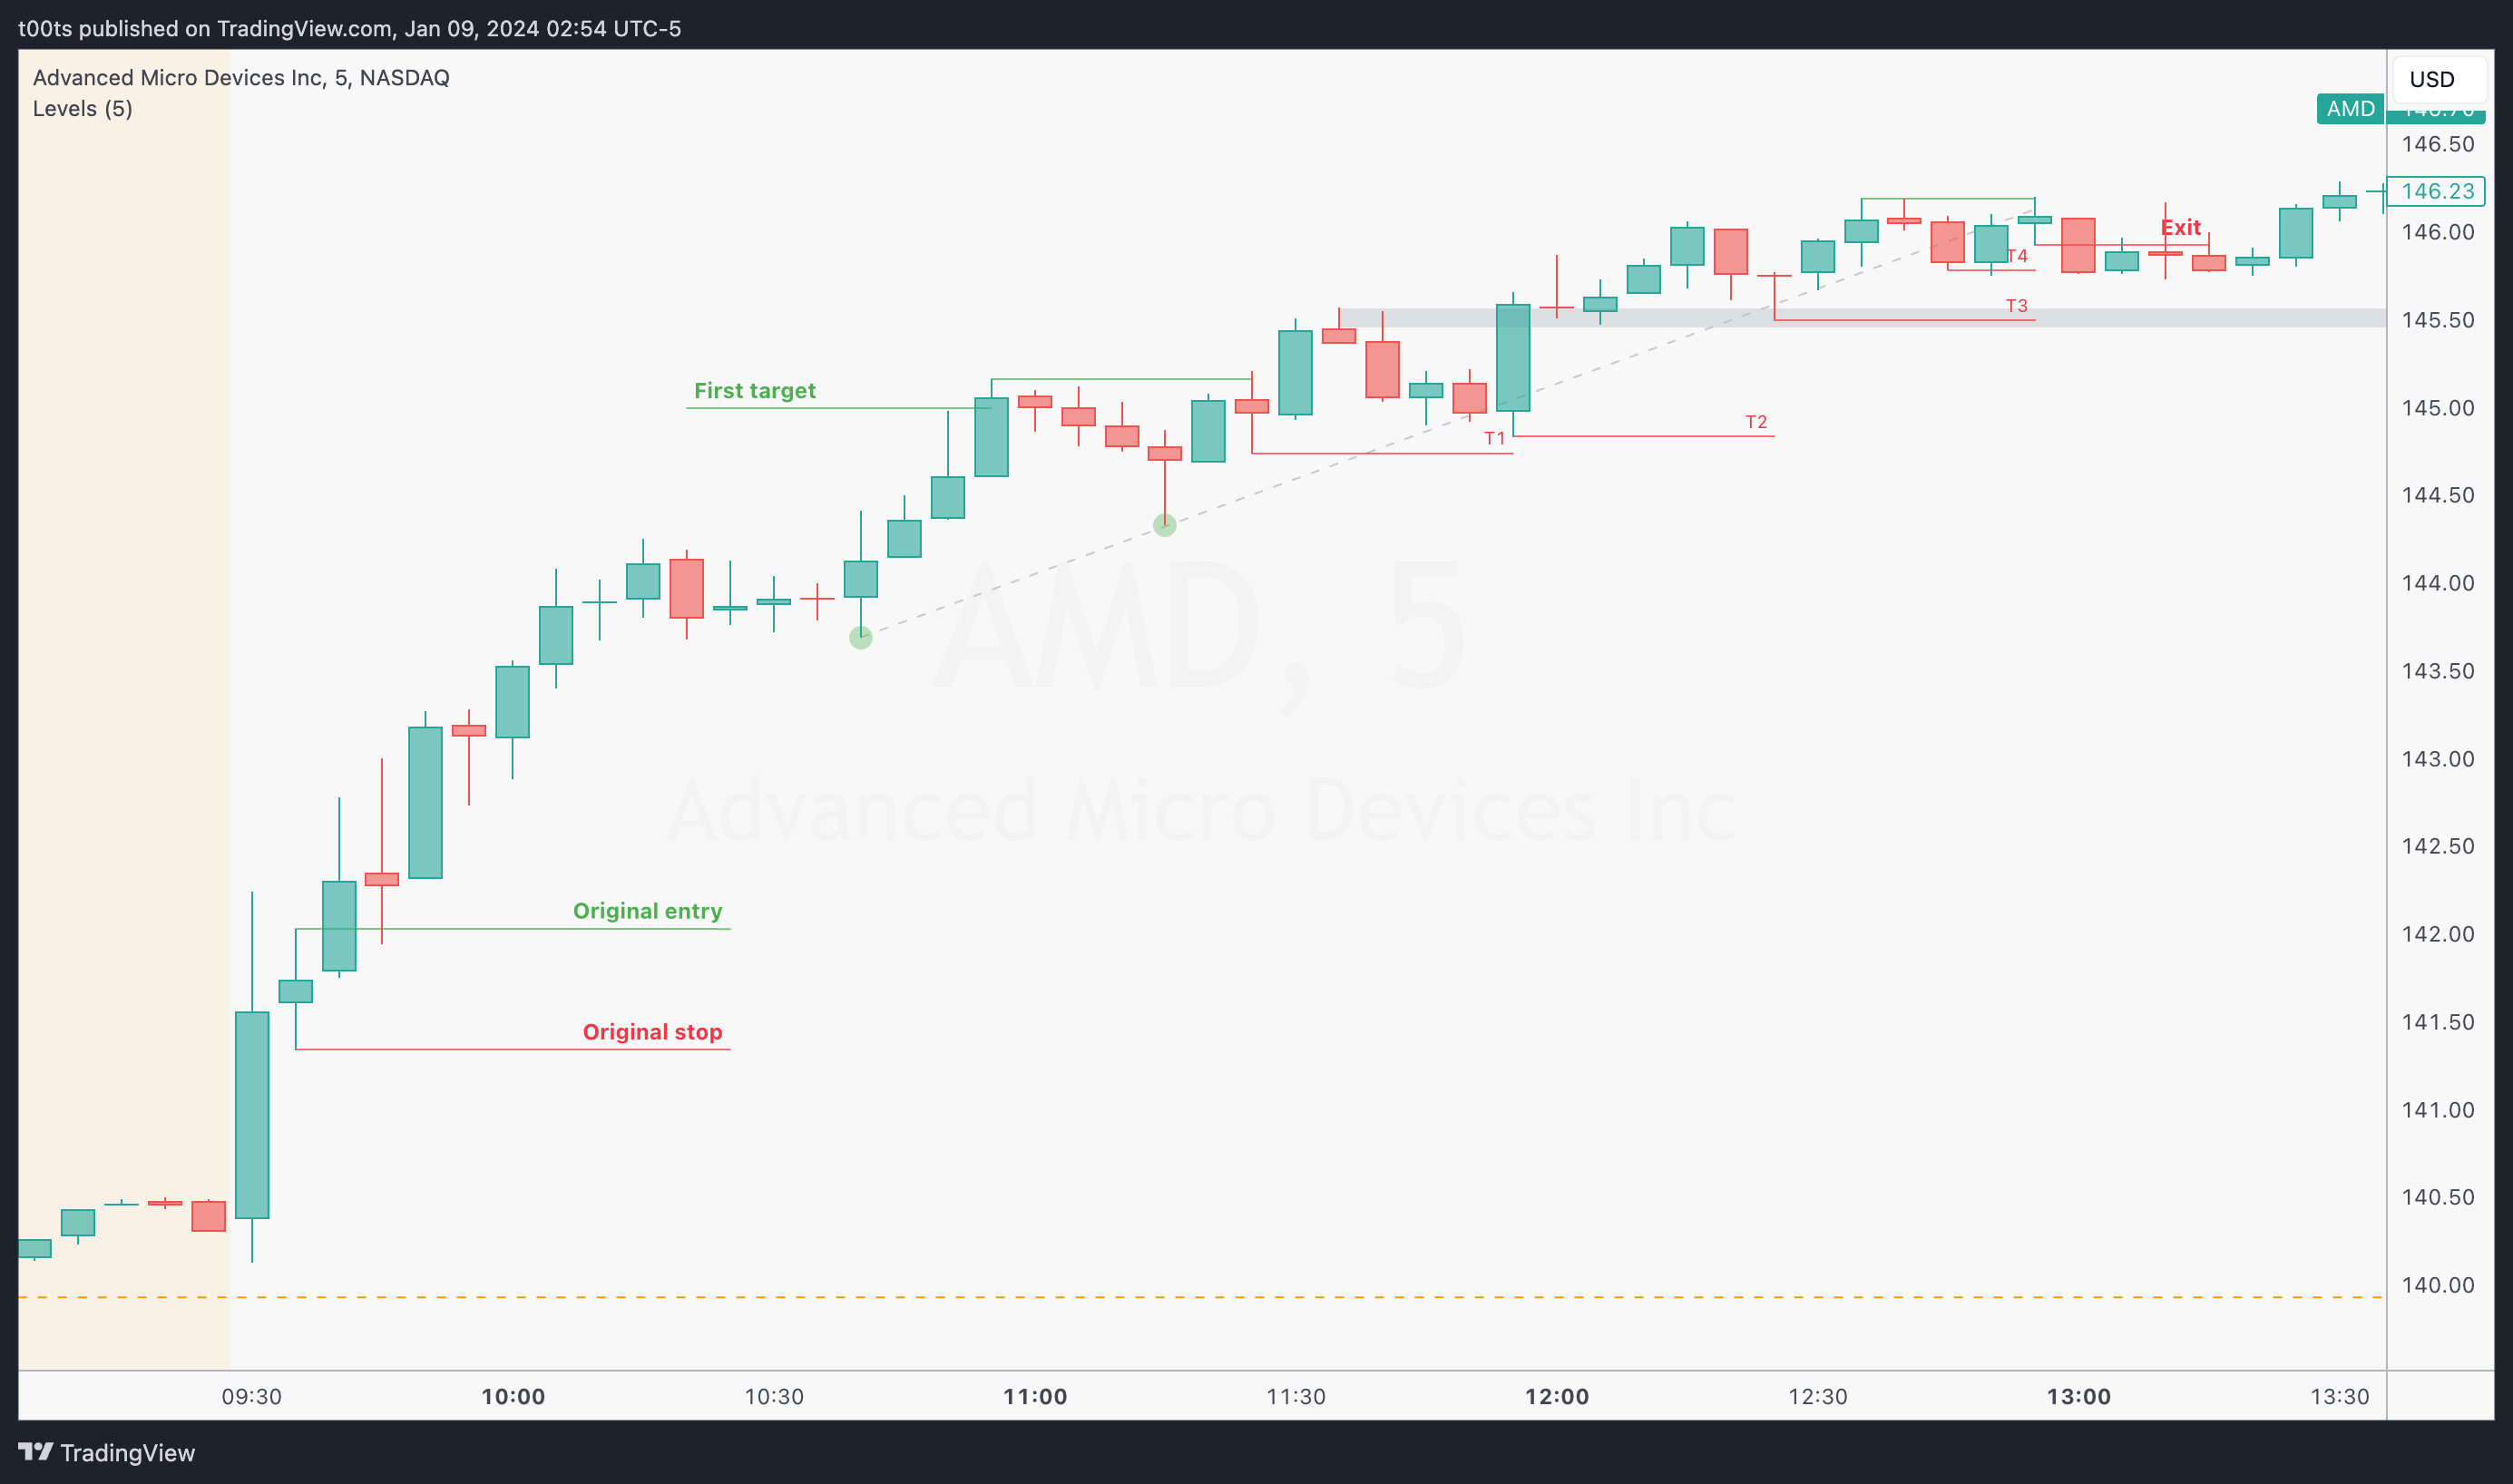
The first time I actually decide on a trailing stop, the stock is up over 2% since the original entry (~3pts).
Why didn't I trail my stop before that? Because there was no reason to. Price action wasn’t giving any signs of turning the trend any time soon.
While it's worth noting that I had trimmed the position at $145, I never saw a case for a short. Anyone who's been following these daily publications knows that we always wait for second entries before approaching a counter-trend trade. So, if you're long and nervous, think of what you'd need to short. We didn’t get signs of weakness up to that point.
First trail (T1): A potential failure to go higher sets up the moment that red bar closes below the previous high of day (marked in green). I was ready to exit my position if we broke below that.
Second trail (T2): I should've added there. That was a two-legged pullback with the lows of the second leg breaching those of the first, to then continue higher. This is by far my favourite setup in a trending market, but I missed it. I then noticed the trendline and saw we had breached it mildly before the continuation higher, so I figured those lows were a good place to ratchet the stop to.
Third trail (T3): Pretty standard support/resistance flip here. Nothing fancy.
Third trail (T4): First bar to close below the trendline. Set my stop below, and although it did trigger, I was actually watching this and held for a bit longer.
Final exit: Trendline had been broken and momentum was decreasing. The retest of the trendline creating a double top on the day led me to tighten up the stop even further, to the lows of that small green doji. The moment it broke down, I got out of the rest of my position.
Side note: A trendline break does not mean the trend will turn. It just means buyers and sellers are closer to equilibrium and sideways price action may follow.
Closing notes
This was one of the easiest trades to hold I remember. The thing I liked most about this trade was how, despite not getting a test of a level right off the open, price action offered a solid entry early in the day that allowed for a great trade. Most eyes were on NVDA yesterday, which completely took off rallying 15pts straight off the open in the first 20 minutes of trading. That's hard to catch unless you've planned for it. AMD was a straightforward sympathy play that offered a good opportunity to capitalize on.
I am posting one trade writeup every day throughout 2024. I focus on large caps using levels and price action. The subscription is absolutely free and will always be. I will strive to provide value by offering clues and ideas for you to enhance your edge. Let’s grow together!