Higher timeframe context
These Q4 earnings had to be one of the most anticipated releases of this earnings season, if not the most.
Tesla stock has been showing extreme relative weakness while the overall market and many high beta names have been consistently making new highs throughout the past few weeks.
There were high expectations on Elon and the management team to step up on the earnings call and calm investors, giving solid answers to key concerns and offering positive guidance moving forward; but instead all we got was a broader long-term view of the company's future vision without any short-term outlook.
Weekly chart
The weekly chart going into earnings was holding this area of interest around the $200 mark. I have little to add here with respect to our previous TSLA writeup in terms of the weekly action.
Price is sitting in the lower bound of the huge range we're in. The obvious trade here is to go long, as we're essentially at support. However, with earnings coming up, it's always a gamble.
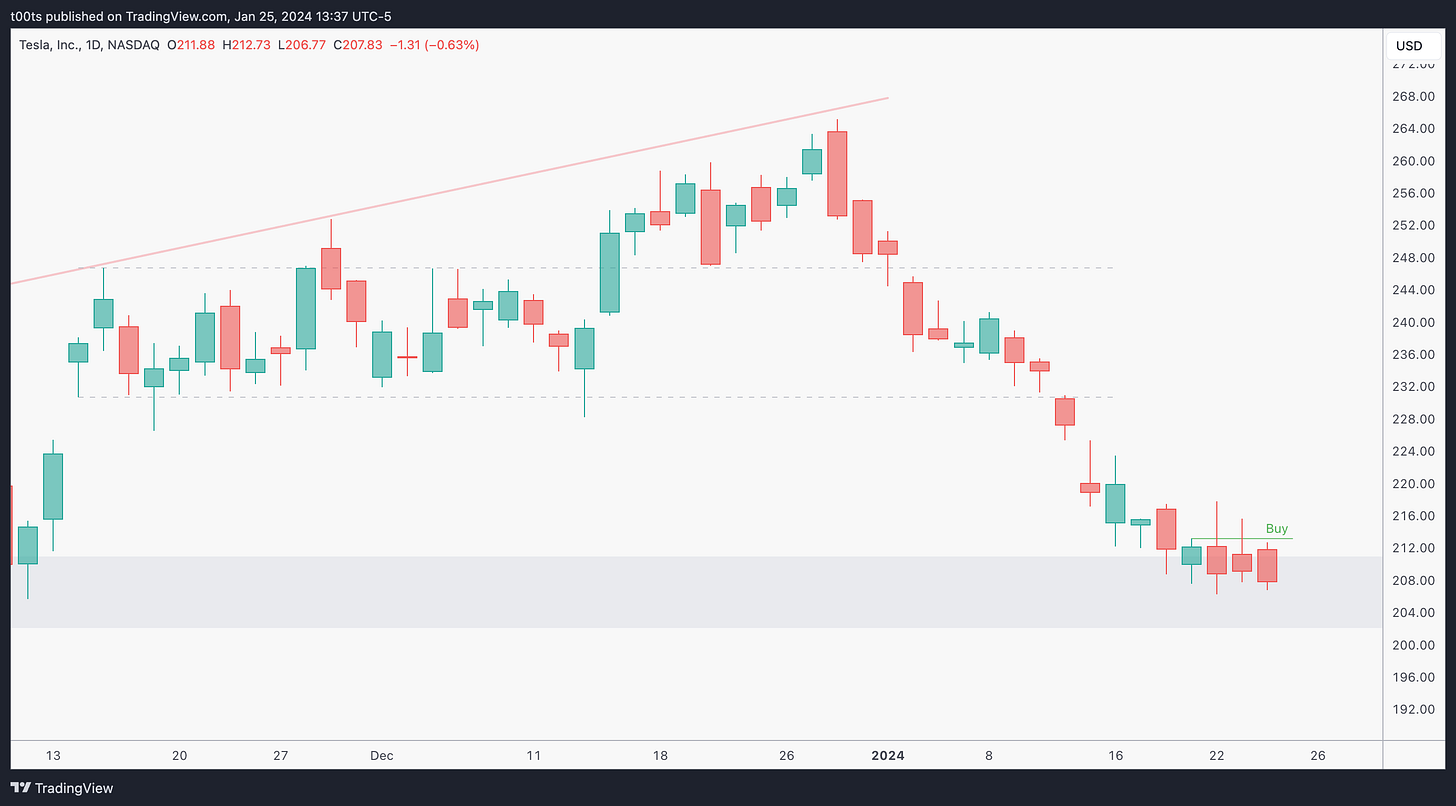
Daily chart
The daily gets a little bit more interesting because these last few days leading into earnings have been extremely weak. For context, the overall market is up over 1% and most big names are making new all-time highs.
Tesla stock is quite an outlier, as it can’t seem to catch a bid lately. The support level seems to be holding as buyers absorb all the selling, but there's not enough buying to bid prices up. Every bounce fails.
Hourly chart
Skipping the hourly chart because the stock is gapping down over 8% on a bad earnings report.
Pre-market action
After the report came out, price actually held the $200 mark for a while. Eventually, as the conference call kicked off, stock started to fade, closing at the lows.
The pre-market open today was very weak. Anyone who was hoping for a gap up immediately knew that was probably not going to happen. There's a slow and steady downtrend that leads us to the open, with just a quick irrelevant pop at 8am that gets shot back down immediately.
The trade
There are many eyes on this stock at this point. And I mean a lot. Not only traders but also bigger players and even long-term holders are looking at this meltdown, with emotions definitely kicking in. I myself had started a sub $200 swing which I had to quickly cut.
Also, keep in mind this long trade is probably one of the most crowded trades in the market right now. So many people expecting a bounce after 5 straight red weeks!
Let's go over the trade of the day, using our CPT Framework:
Cue(s)
Weakest high-beta name for the past few weeks
Earnings miss and weak forward guidance for this year
Bearish sentiment across the board
Gapping below major support level
Crowded long trade
Intraday cue: Reversal bar on failure to trade above the opening print
Plan
We're set to open with no levels around. We're looking for rejections at the $195.79, or a clear entry off the opening print. In this case, as we'll see, we got a beautiful signal bar at the opening print which we'll use for our short trade.
Trigger
Price breaking below the signal bar
5m chart
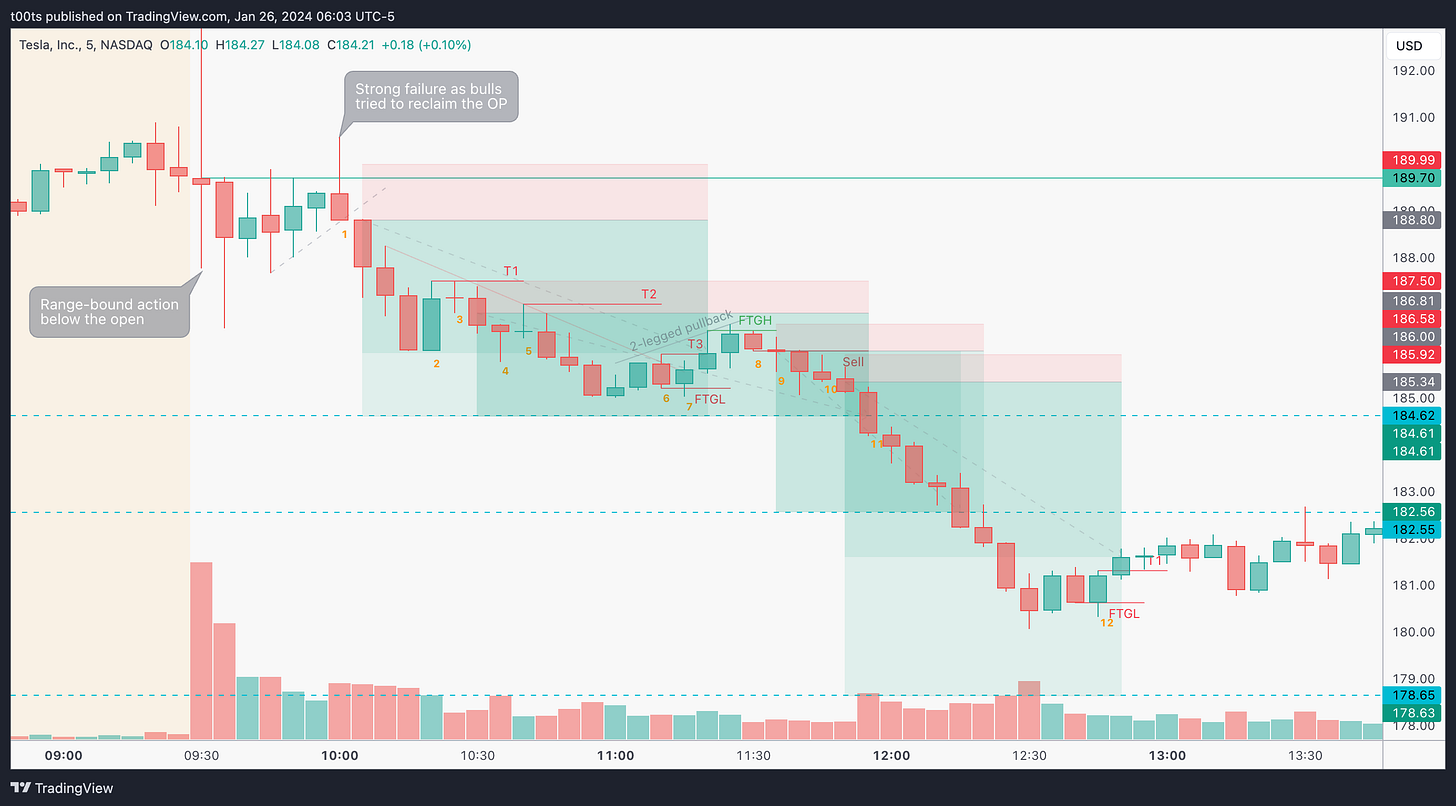
I was watching TSLA all morning, even aded to my shares position early in the day to try and catch a bounce. The tape was heavy all morning. Look at how price can't reclaim the opening print. It just consistently ranges below it until it finally gives up and drops. Let's dissect the drop:
Bar 1, is our signal bar. Clear, textbook reversal bar at the 10am failed attempt by bulls to reclaim the opening print and turn the day green. We have the opening print as level to risk against, and the conviction that buyers have been struggling all morning.
Bar 2 is the first bounce we get from buyers after price makes a new low of the day. I was watching, and volume was scarce. At this point, for all those longs filled with hopium, this is probably their last bet on a bounce.
Bar 3 is an inside bar that sets our first pivot to trail our stop, and frankly would allow us for another entry at the break of its lows.
Bar 4 fails to go lower right at the previous low of the day, and although it doesn't meet the criteria for a reversal bar, one could argue that it gives reasons to trail the stop.
I've been thinking about this and I believe there's more reasons to hold than there are to trail. The main one being that there's really not much momentum. If there was strong momentum to the downside I wouldn't doubt it, but price has been slow all day. It's not like we're expecting a push out of nowhere.
Bar 5 would have triggered that stop if we had trailed it, but instead it sets a new pivot for us to keep trailing our stop, and it now becomes the 3rd touch point of the downward trendline I've marked in slightly transparent red.
Bar 6 forms another pivot we can use to trail our stops, not surprisingly rejecting at that same trendline.
Bar 7 fails to go lower and sets up a potential breakout of the trendline we've been following. Price does indeed bounce and we get stopped out of our position in profit.
Bar 8 is an inside bar at the top of a two-legged pullback after a slight failure to go higher. It becomes a new signal bar to take an entry targeting new lows.
Bar 9 triggers the entry to the downside. Very slow action. There's no point being nervous about slow action unless you're doing something against your system.
Bar 10 is another inside bar that very conveniently allows us to add to our position, or get involved if we missed the previous entry.
Bar 11 is a solid trend bar that breaks the $184.62 level and kicks off the downtrend all the way down to the $180 area.
Bar 12 fails to trade lower on what looks like a bear flag, so we trail our stop to its highs. We're not really interested in giving back too much. The stock is already down a lot.
Closing notes
Imagine how many traders have been trying to capture longs on this name for weeks now, with no luck. Imagine how many thought this huge gap down was yet another opportunity to attempt a long trade into the gap fill and got cooked. This is why it's so important to leave biases aside and have a system you can trade confidently. All these traders were oblivious to the trend that was in front of them and failed to capitalize on so many opportunities.
Here's something I learned a long time ago: Every single dumb trade you take will be immediately followed by a huge opportunity you won't be able to capitalize on because you wasted your mental capital in something that wasn't worth it. So essentially, every time you take a dumb trade you lose twice.
I am posting one trade writeup every day throughout 2024. I focus on large caps using levels and price action. The subscription is absolutely free and will always be. I will strive to provide value by offering clues and ideas for you to enhance your edge. Let’s grow together!


