Higher timeframe context
I've been posting updates on this TSLA weekly chart for some time now. We went over how bulls tried to hold at a certain point but never got the follow-through they were looking for. The momentum to the downside was too strong, and frankly, still is.
Tesla stock has been struggling to catch a bid lately. Despite the CyberTruck launch, the Optimus Robot progress updates, and more recently FSD v12 starting to be rolled out to select drivers; there seems to be no hype left for the stock. Elon has been a little weird on 𝕏 lately, but that's just part of the package of being a TSLA shareholder.
Weekly chart
Despite that trendline breakdown, retest, and the move back down, this weekly chart is essentially in a range between the $200 and the $260-$280 area. While we can agree that the overall trend is down, it's important to look beyond the trend lines as they're a tool for bias. Current price action is sitting between the two previous pivots, marked with green and red horizontal lines, so even if we're in an overall downtrend, price is currently ranging.
Daily chart
The daily chart is conveniently sitting at that support area I marked on the weekly chart.
Although we trade off hourly levels, if there's a very obvious higher timeframe level or area, it's good to have it marked on your charts for reference. Price has held there in multiple occasions and we could see similar behaviour soon.
On this last day, price traded below previous bar lows and closed green. While far from a reversal bar, this does open the door to a potential relief bounce, especially at this area. I added a 200 moving average to give the reader additional context.
Hourly chart
This hourly chart is in a clear downtrend. The failure to go lower at this weekly support area gives us a reason to believe that a short-term relief bounce could happen soon. If it does, our first immediate target would be the $216.88 level above. It seems pretty strong (look at the move that followed) and marks the last [lower] high pivot, so breaking that would open the door to a potential trend flip. Bears are expected to defend that area.
Pre-market action
Pre-market action was irrelevant to this trade. Stock opened flat, literally. It wasn't under my radar nor in my gameplan for the day. But I tend to always have TSLA up anyways
The trade
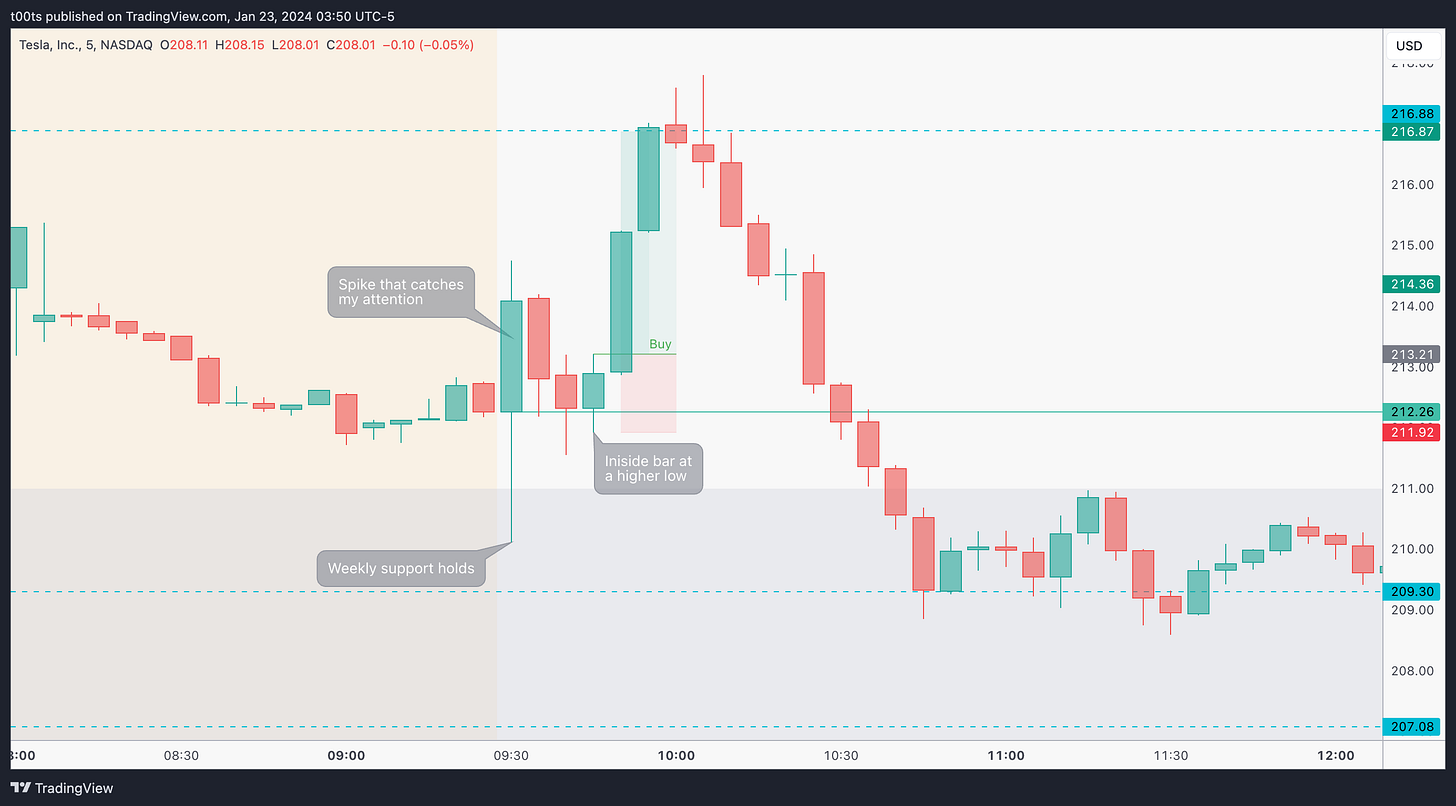
TSLA caught my eye during the first 5m candle. It made a big sudden move to the upside as soon as it touched the gray area. I figured there was a chance of getting that relief bounce we were talking about. I was long IWM and the trade was working well so I started watching her as well.
Using our CPT Framework:
Cue(s)
Arguably over extended move to the downside
Mild failure to go lower at an important weekly support area
Intraday cue: Sudden spike to the upside as price touches the support area
Plan
As we get that spike I put TSLA on my radar. I'm essentially watching to see if there's any buy opportunity. I'm not forcing any trade nor eager to get involved as I already have an open trade working well. The moment we get the inside bar at a higher low with the opening print to risk against, I had a clear signal bar for a long trade setup.
Trigger
Price breaking the highs of the signal (inside) bar.
5m chart
Trade works quickly and it's pretty self-explanatory. It's really a very simple base-hit setup that worked well. Most of the time this is all you need.
2m chart
For the sake of completeness, here's a 2m chart. We appreciate a 2-legged pullback after the quick bounce that sets up one of my favourite trade entries right at the opening print. This entry doubled the trade's risk-to-reward ratio with respect to the 5m entry. Of course, this had to be your main watch for you to be so focused on the lower timeframes, but we might as well cover it for the sake of the analysis.
Price does breach the $216.88 level, but the moment it fails to hold it, keeping in mind we're in an overall downtrend, it's wise to either scale out or take profits completely. I was personally looking to add to this trade and ended up sitting there just watching the meltdown that came right after.
Closing notes
While I was very happy to participate in this move despite not expecting to trade TSLA at all, I felt a bit of FOMO from not being able to catch any of the drop off the $216.88. It was never in my plan, so I don't really feel bad about it, but the fact that I was watching for a long re-entry while seeing it melt got to me a bit.
Might review that drop in the next few days and try to dissect what cues I could've used to plan for that trade or get involved in it as it happened.
I am posting one trade writeup every day throughout 2024. I focus on large caps using levels and price action. The subscription is absolutely free and will always be. I will strive to provide value by offering clues and ideas for you to enhance your edge. Let’s grow together!


