
Arm Holdings (ARM) - Jan 10th 2024
Taking advantage of failed patterns to profit off trapped traders

Higher timeframe context
While still in its early days as a publicly traded company, one could say ARM has landed in the market at the right time. The semiconductor sector has been leading the way lately as investors pile into the AI race.
Ironically, ARM doesn’t really make chips. Instead, they focus on designing and creating instruction sets for modern chip architectures. These designs are licensed to companies like Qualcomm, Samsung or Apple; who actually build them and use them for their products. Remember Apple’s transition to “Apple Silicon”? Ever wondered what “Apple Silicon” is? Well, spoiler alert, it’s just the fancy name they chose for their new ARM-based processors.
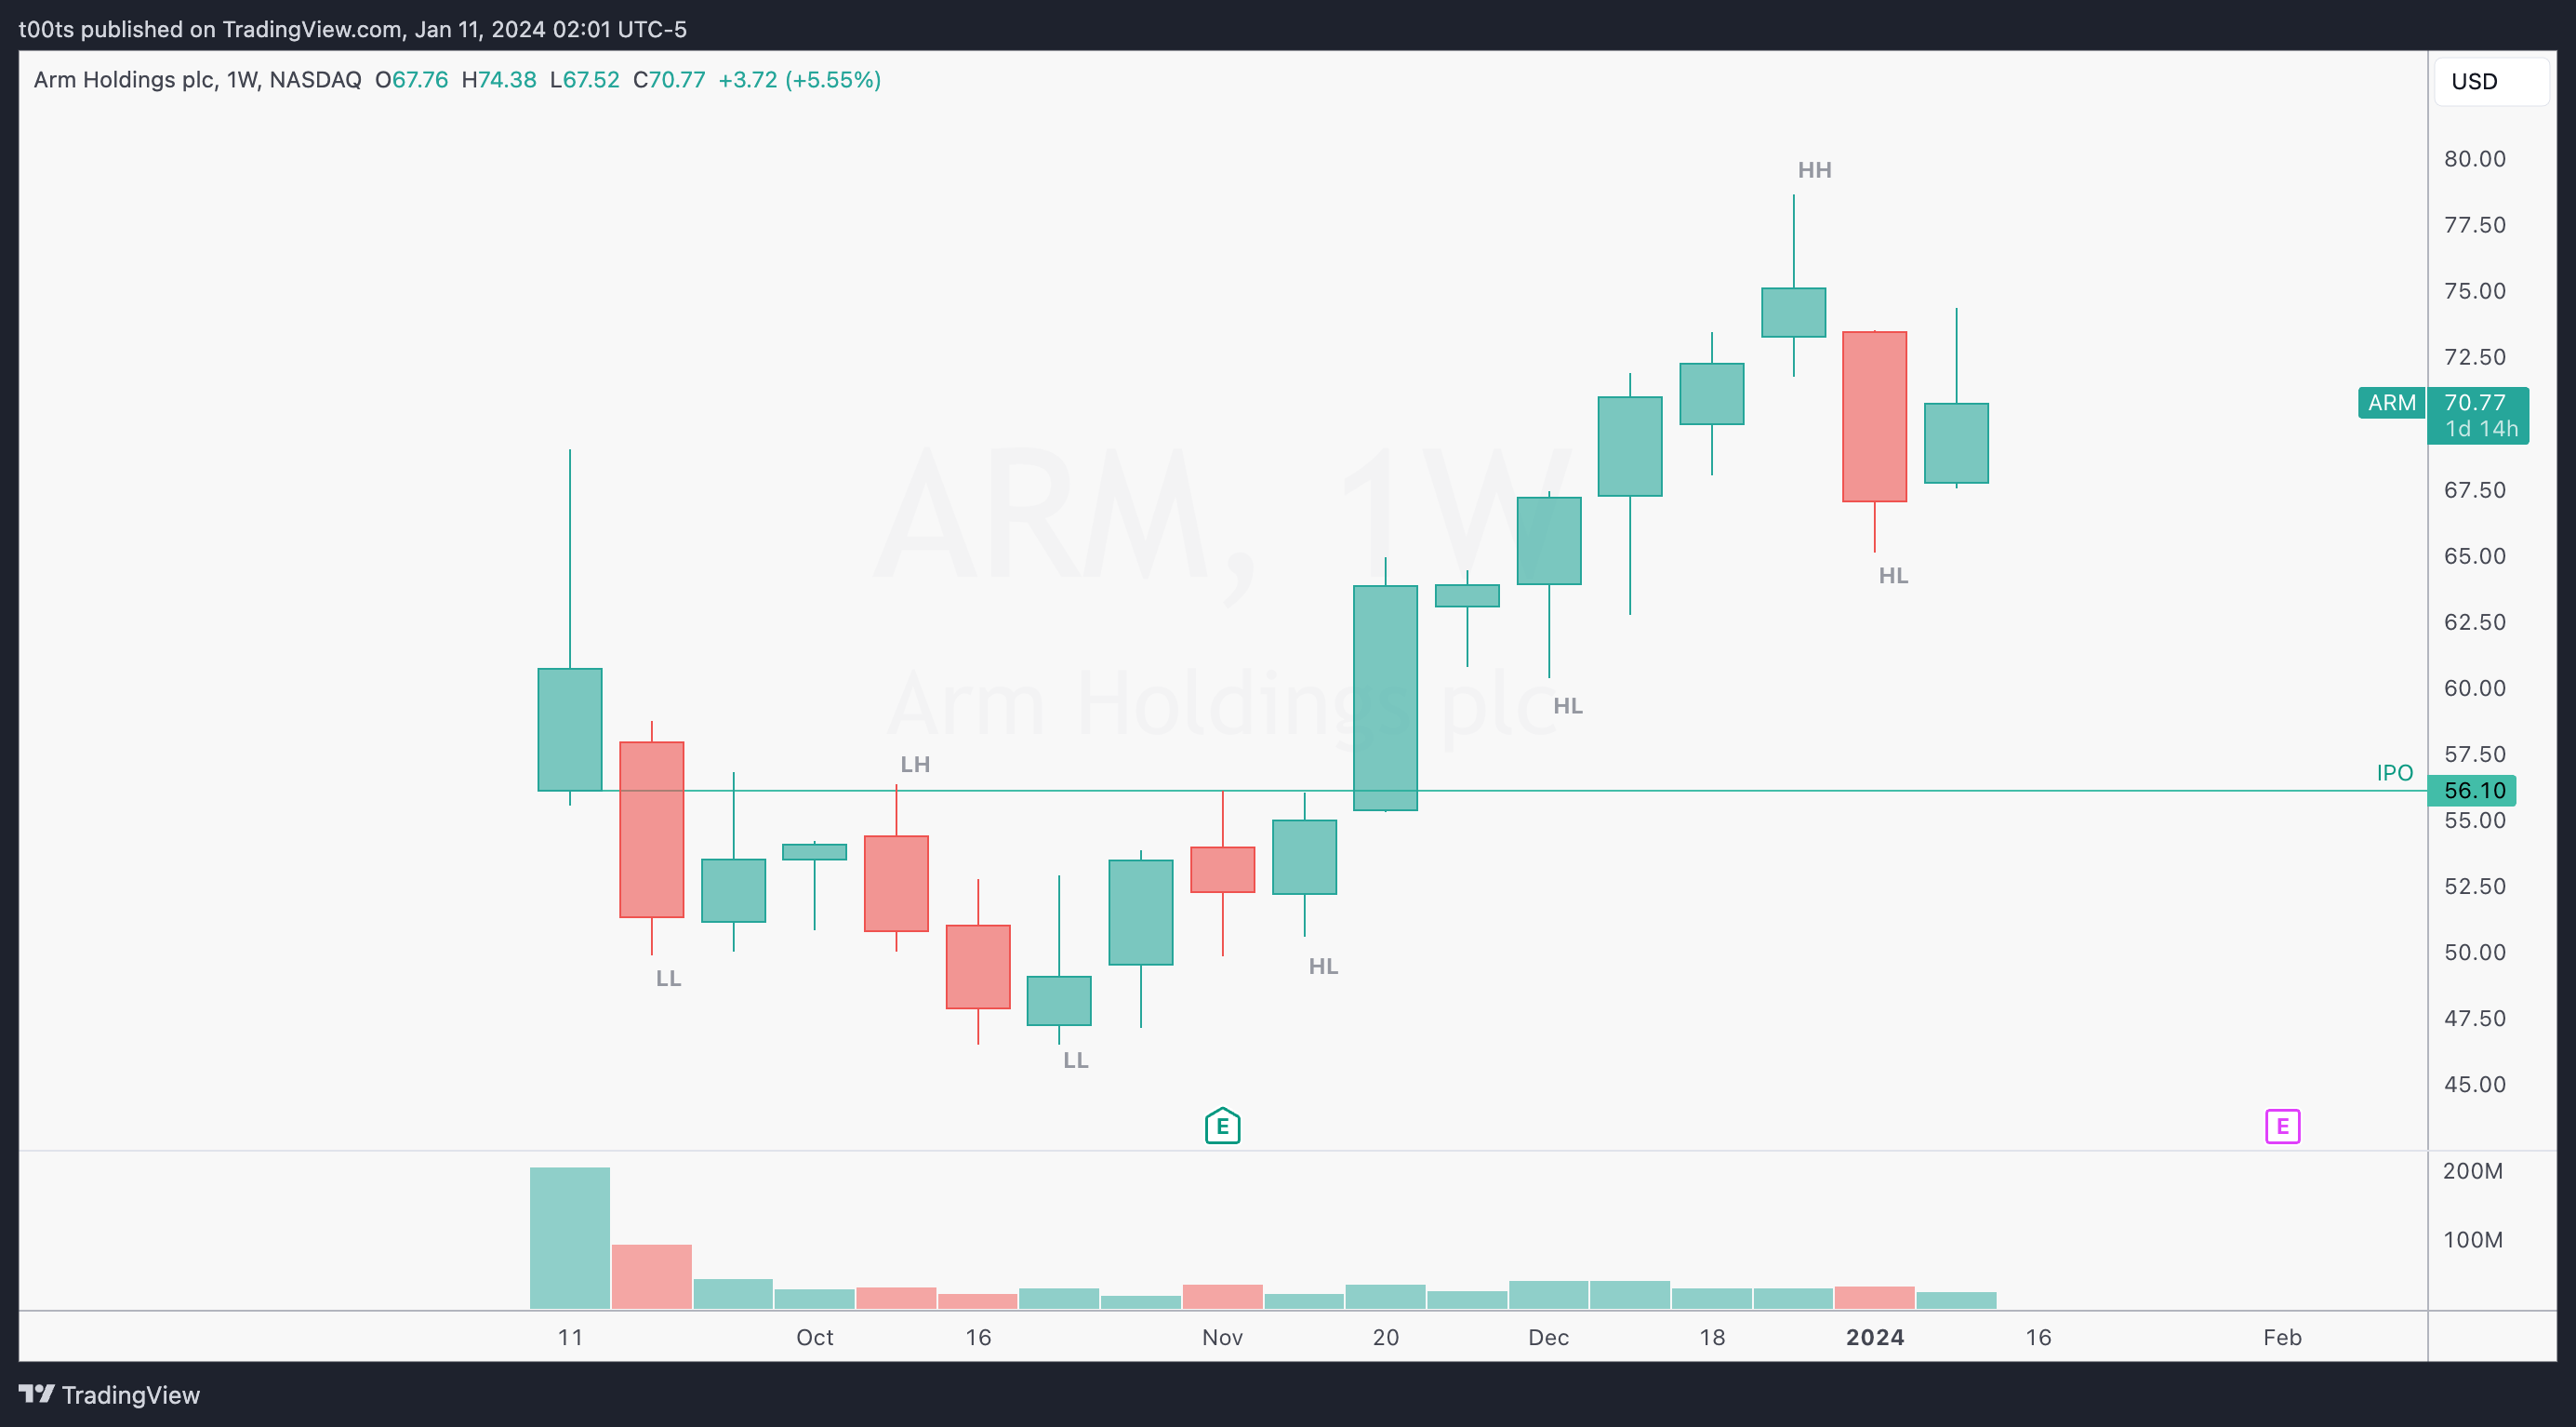
Weekly chart
The weekly chart displays a clear uptrend. In fact, this last leg up has been quite pronounced. We can see how the stock broke out the original IPO price with strength and essentially took off into a solid uptrend for such a new stock. Price has left some notable wicks behind, denoting continued interest from the bull side.
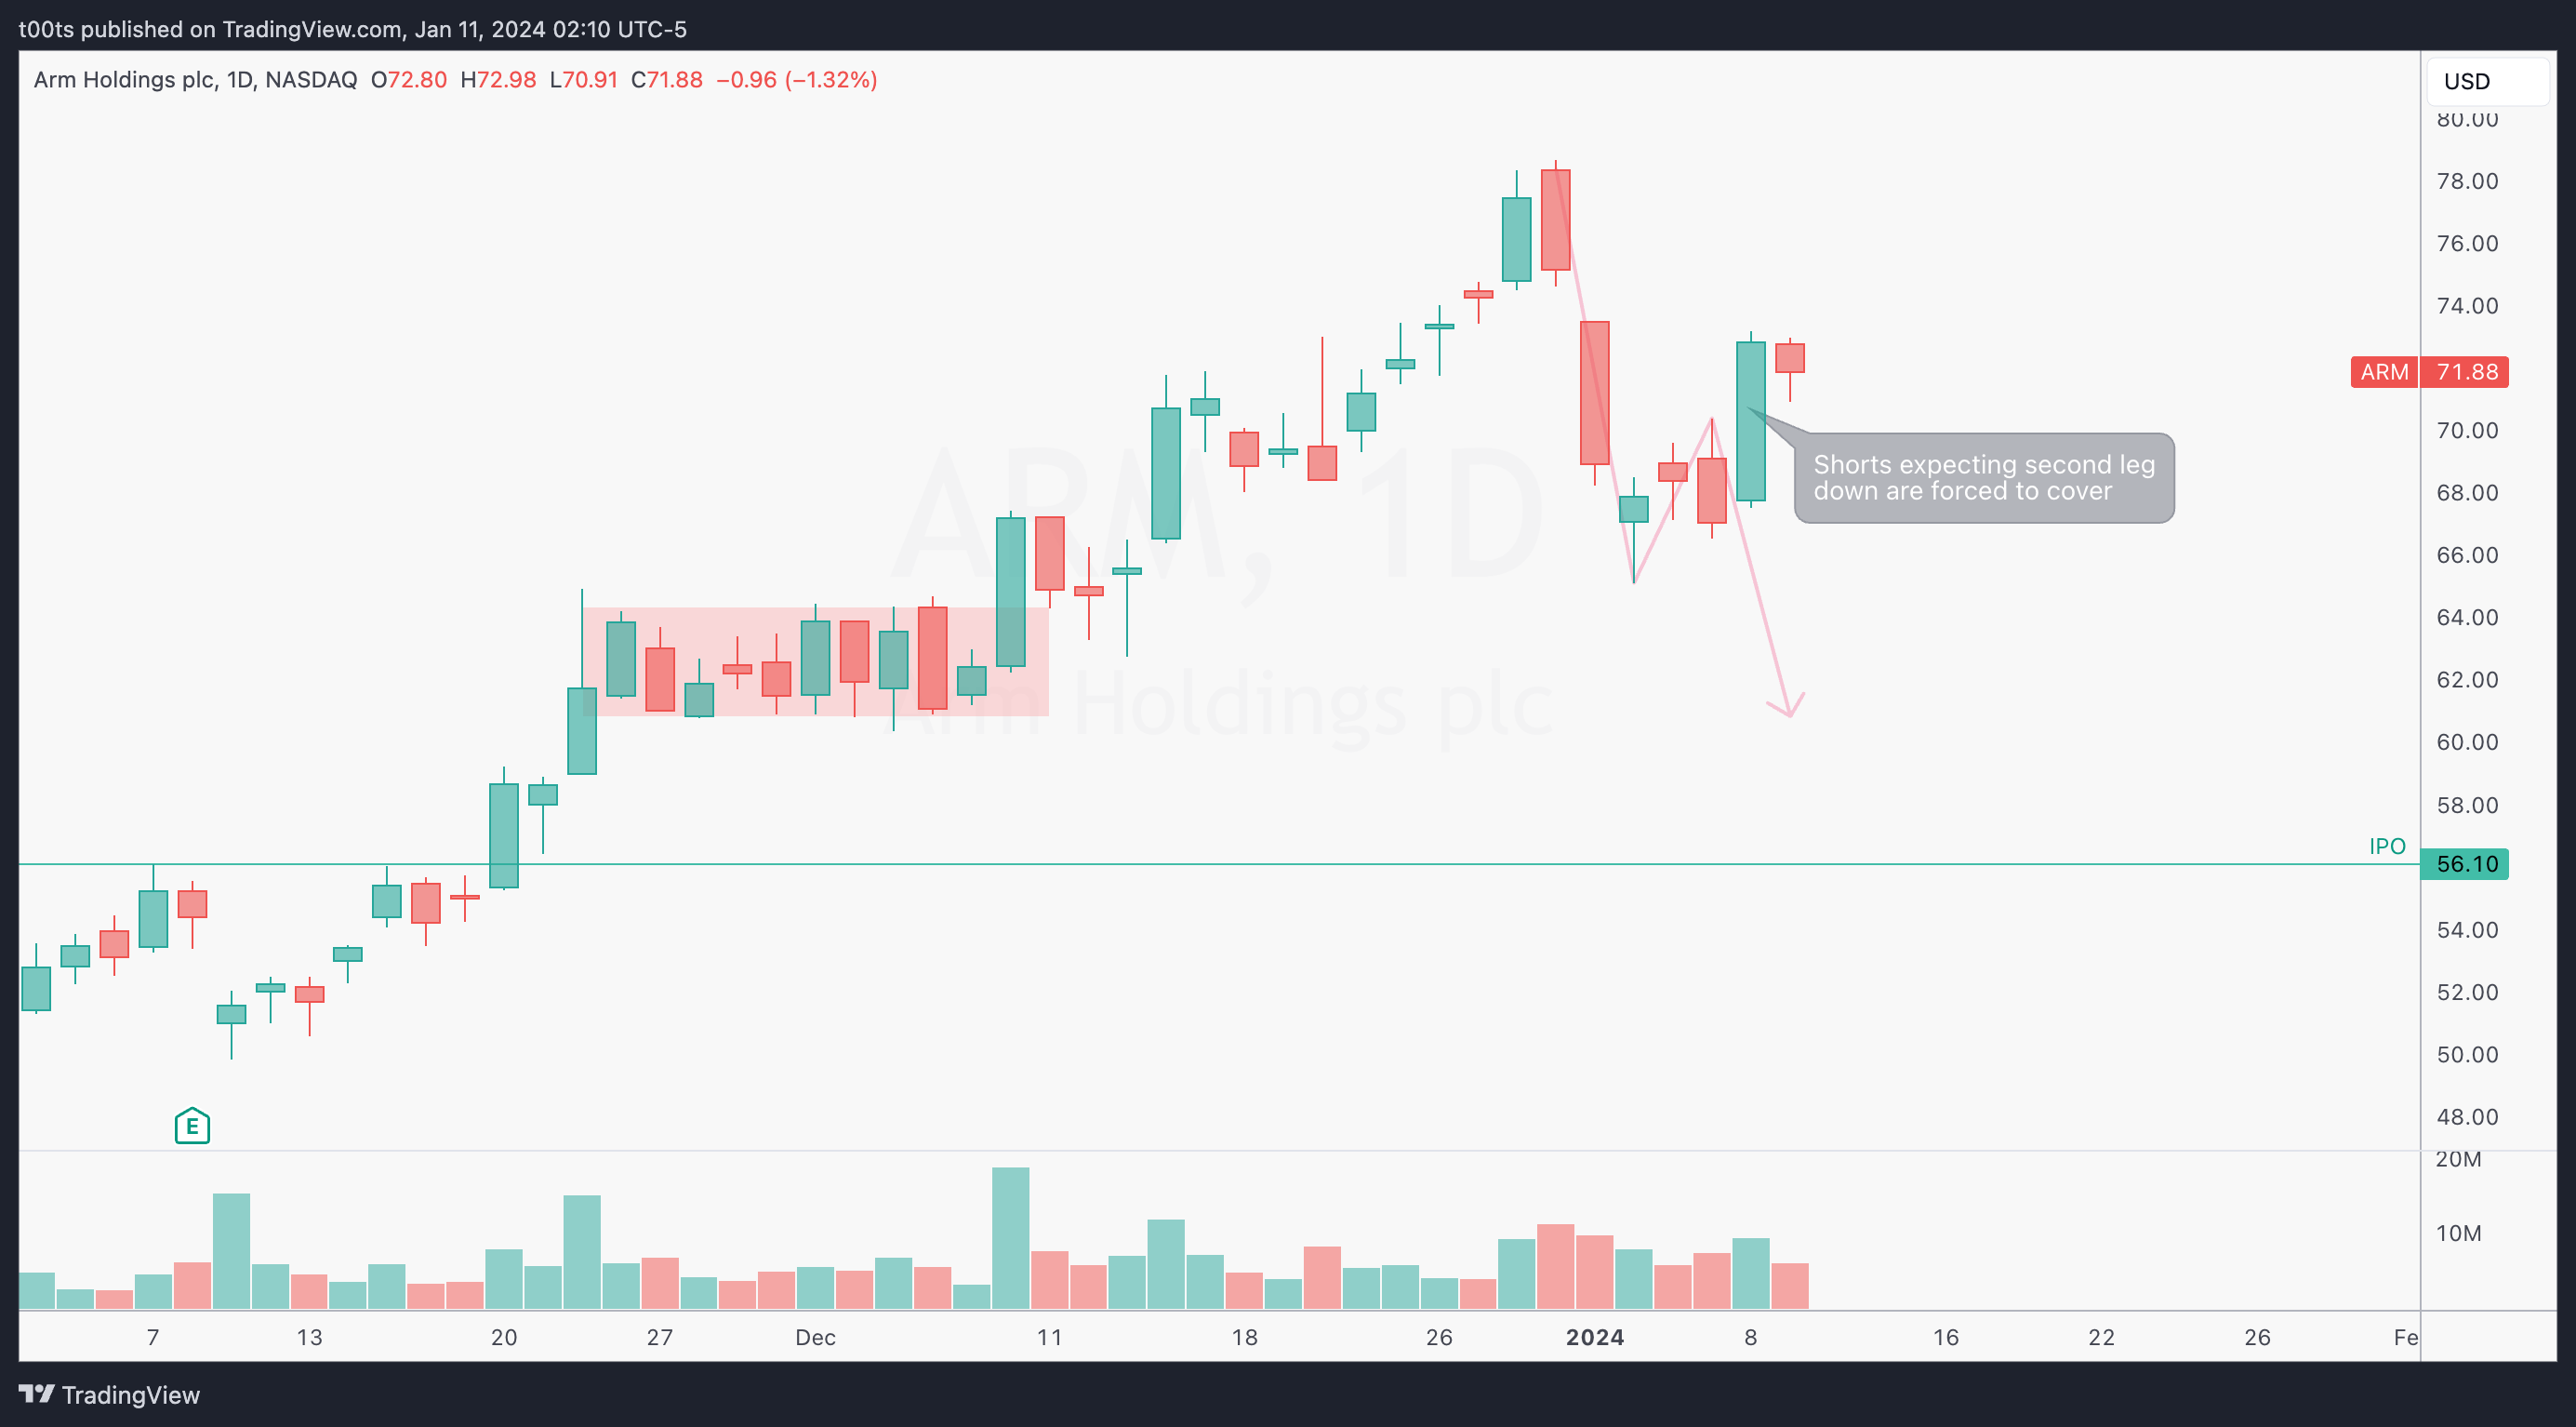
Daily chart
When we zoom into the daily chart, there's a few things that caught my eye and made this name one of my main watches for the day. Recent price action shows a large bull trend bar that takes out all the shorts that had been piling in for a second leg down after the market-wide pullback we saw at the start of the year; followed by a small inside bar fully contained within the upper half of the bull trend bar. This is a textbook 3-bar play setup. It doesn't get any better than this.
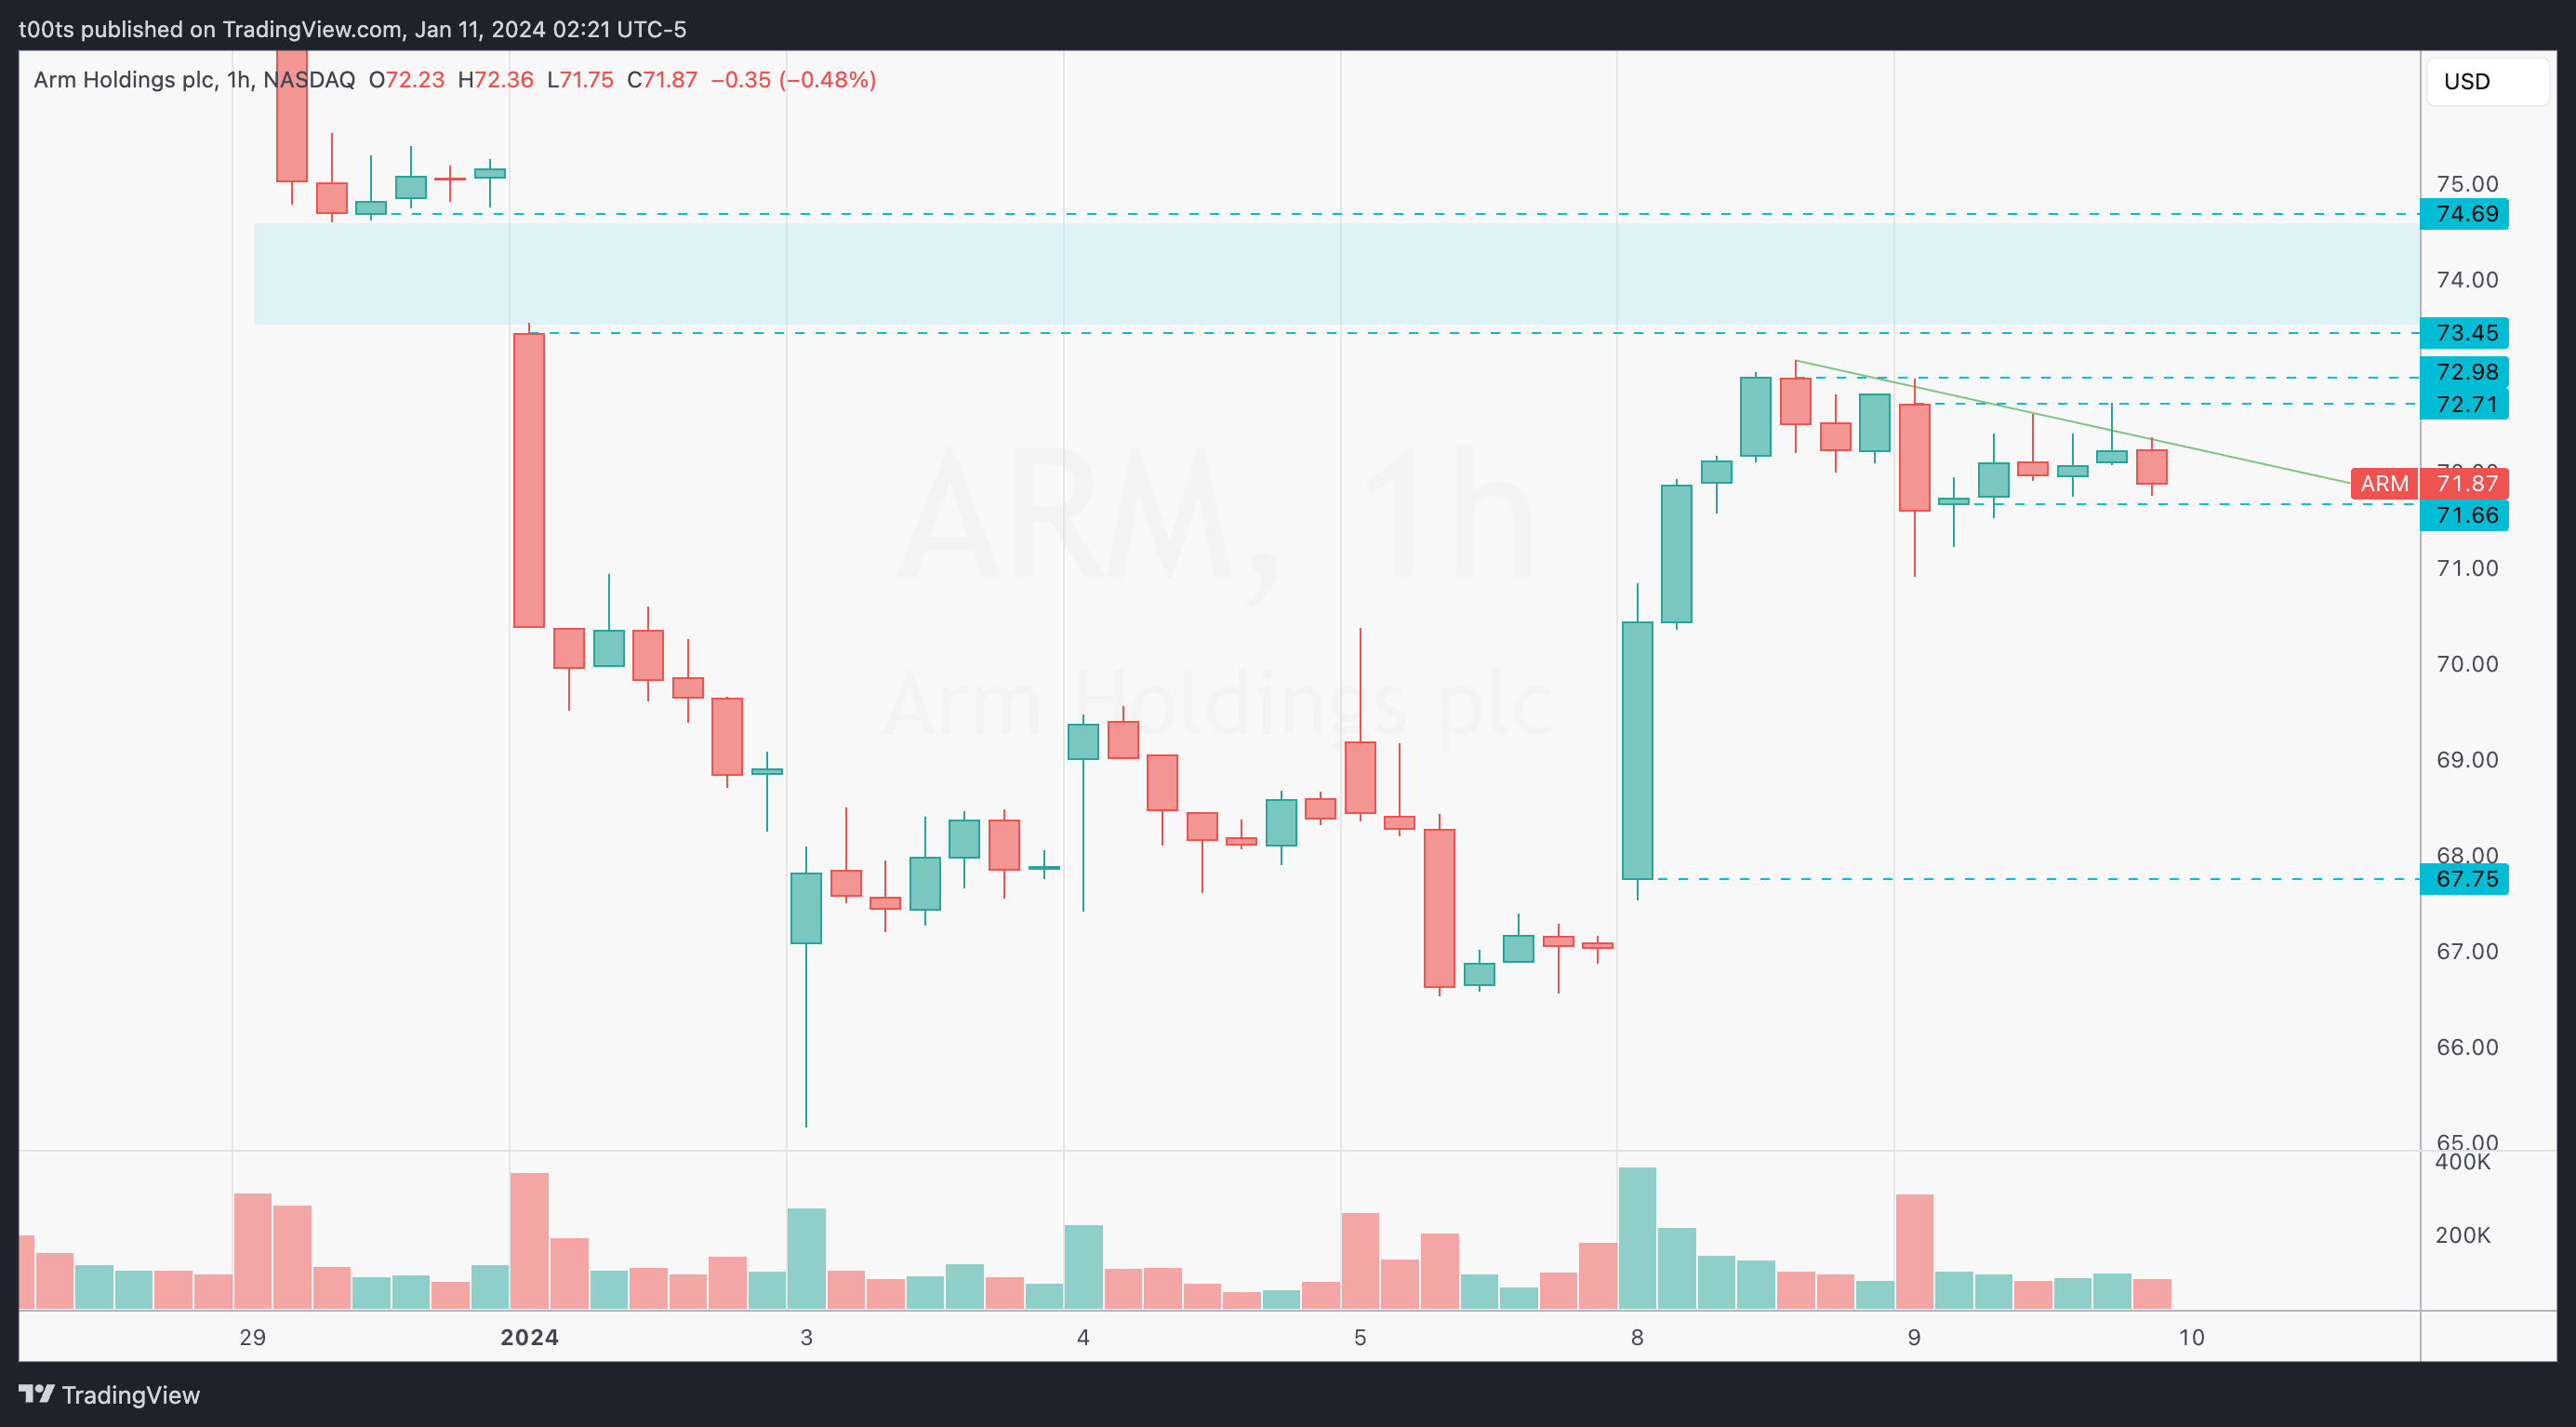
Hourly chart
I believe the first thing any trader sees on this hourly chart is a bull flag. (If you see something else, please comment below!)
For the record, I'd agree. Price does look like it's flagging, and there's an unfilled gap above. The upside move is a bit crowded in terms of levels, but I'd say the only one that looks really strong is the $73.35, which corresponds to the yearly open. With respect to the downside, as we've seen with other names that make strong moves, there's a lot of room without significant levels. Definitely worth noting.
Pre-market action
Stock is set to gap up slightly into the open, which is surely enticing to all the bulls (like myself) looking to trade the daily 3-bar play setup. Just as a reminder, the trigger for this play is price braking the highs of the inside bar. So bulls are ready.
The trade
Using our CPT Framework:
Cue(s)
Weekly uptrend
Daily 3-bar play setup
Intraday cue: Triggers the daily 3-bar play setup
Intraday cue: Immediately fails the trigger level and the opening print
Plan
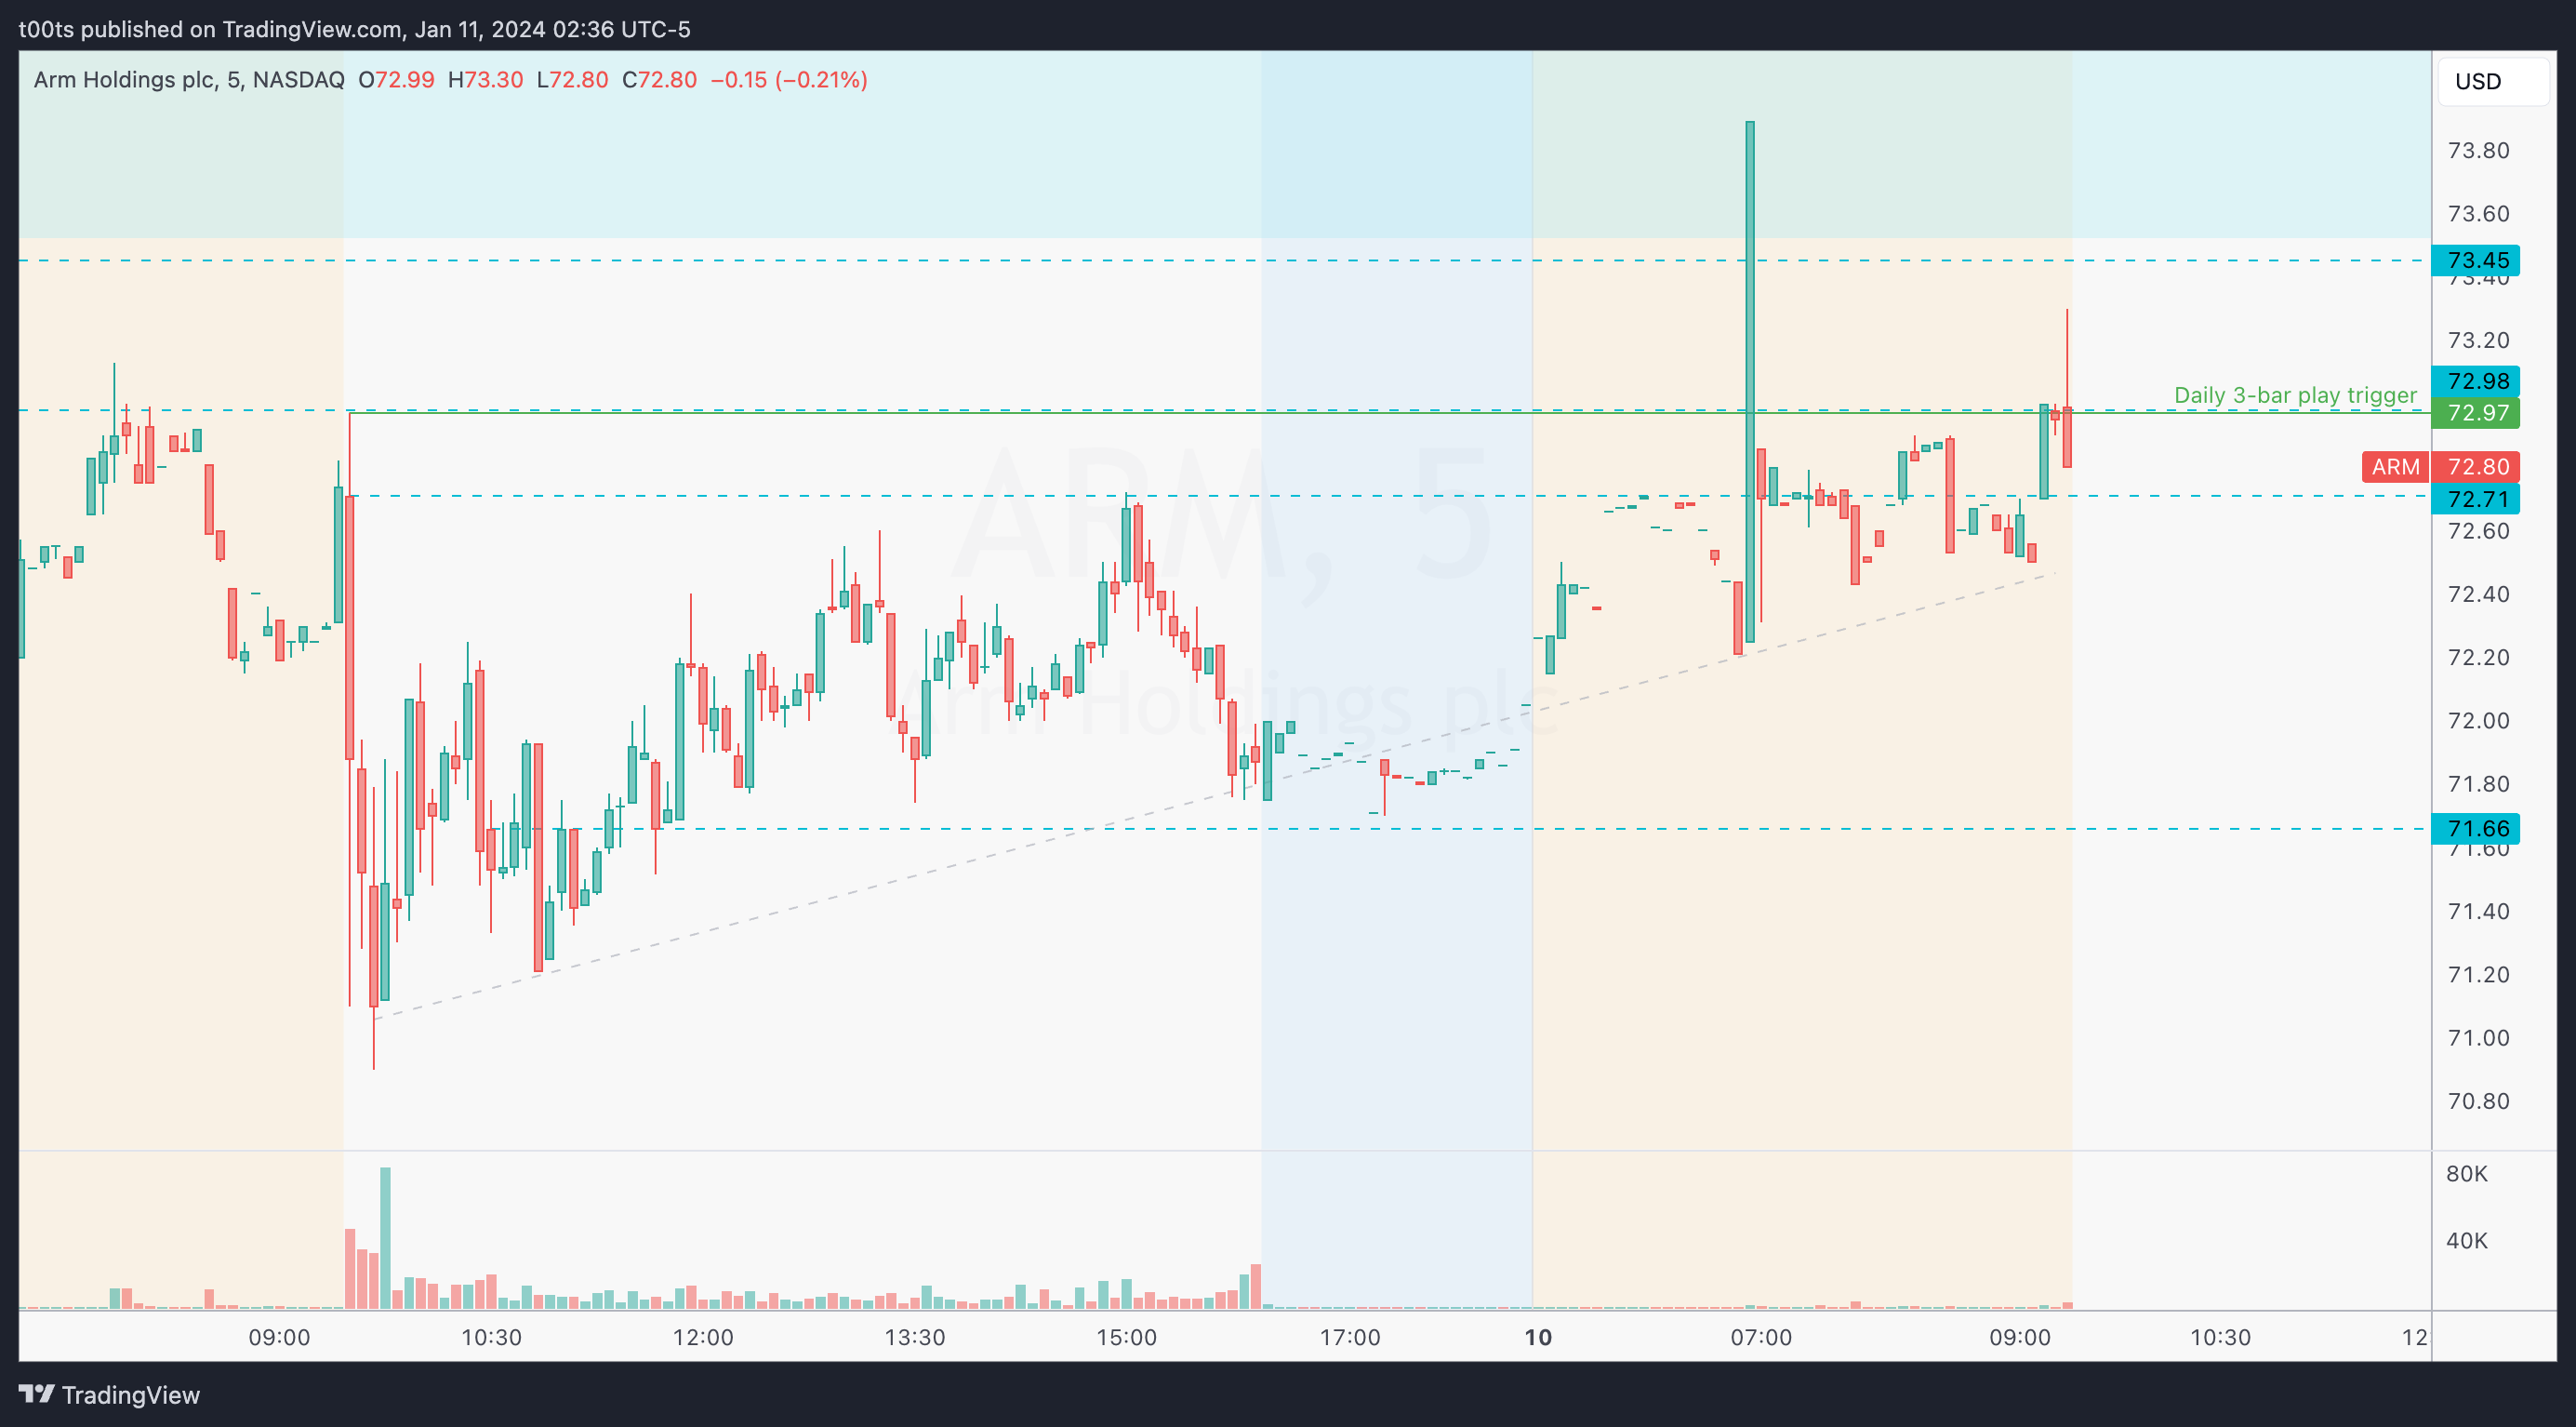
The first 5m bar triggers the daily 3-bar play setup, yet:
Fails to hold the strong $73.35 we mentioned earlier (yearly open)
Fails to hold the daily 3-bar play trigger level
Fails to close green; leaving us with a close below the opening print
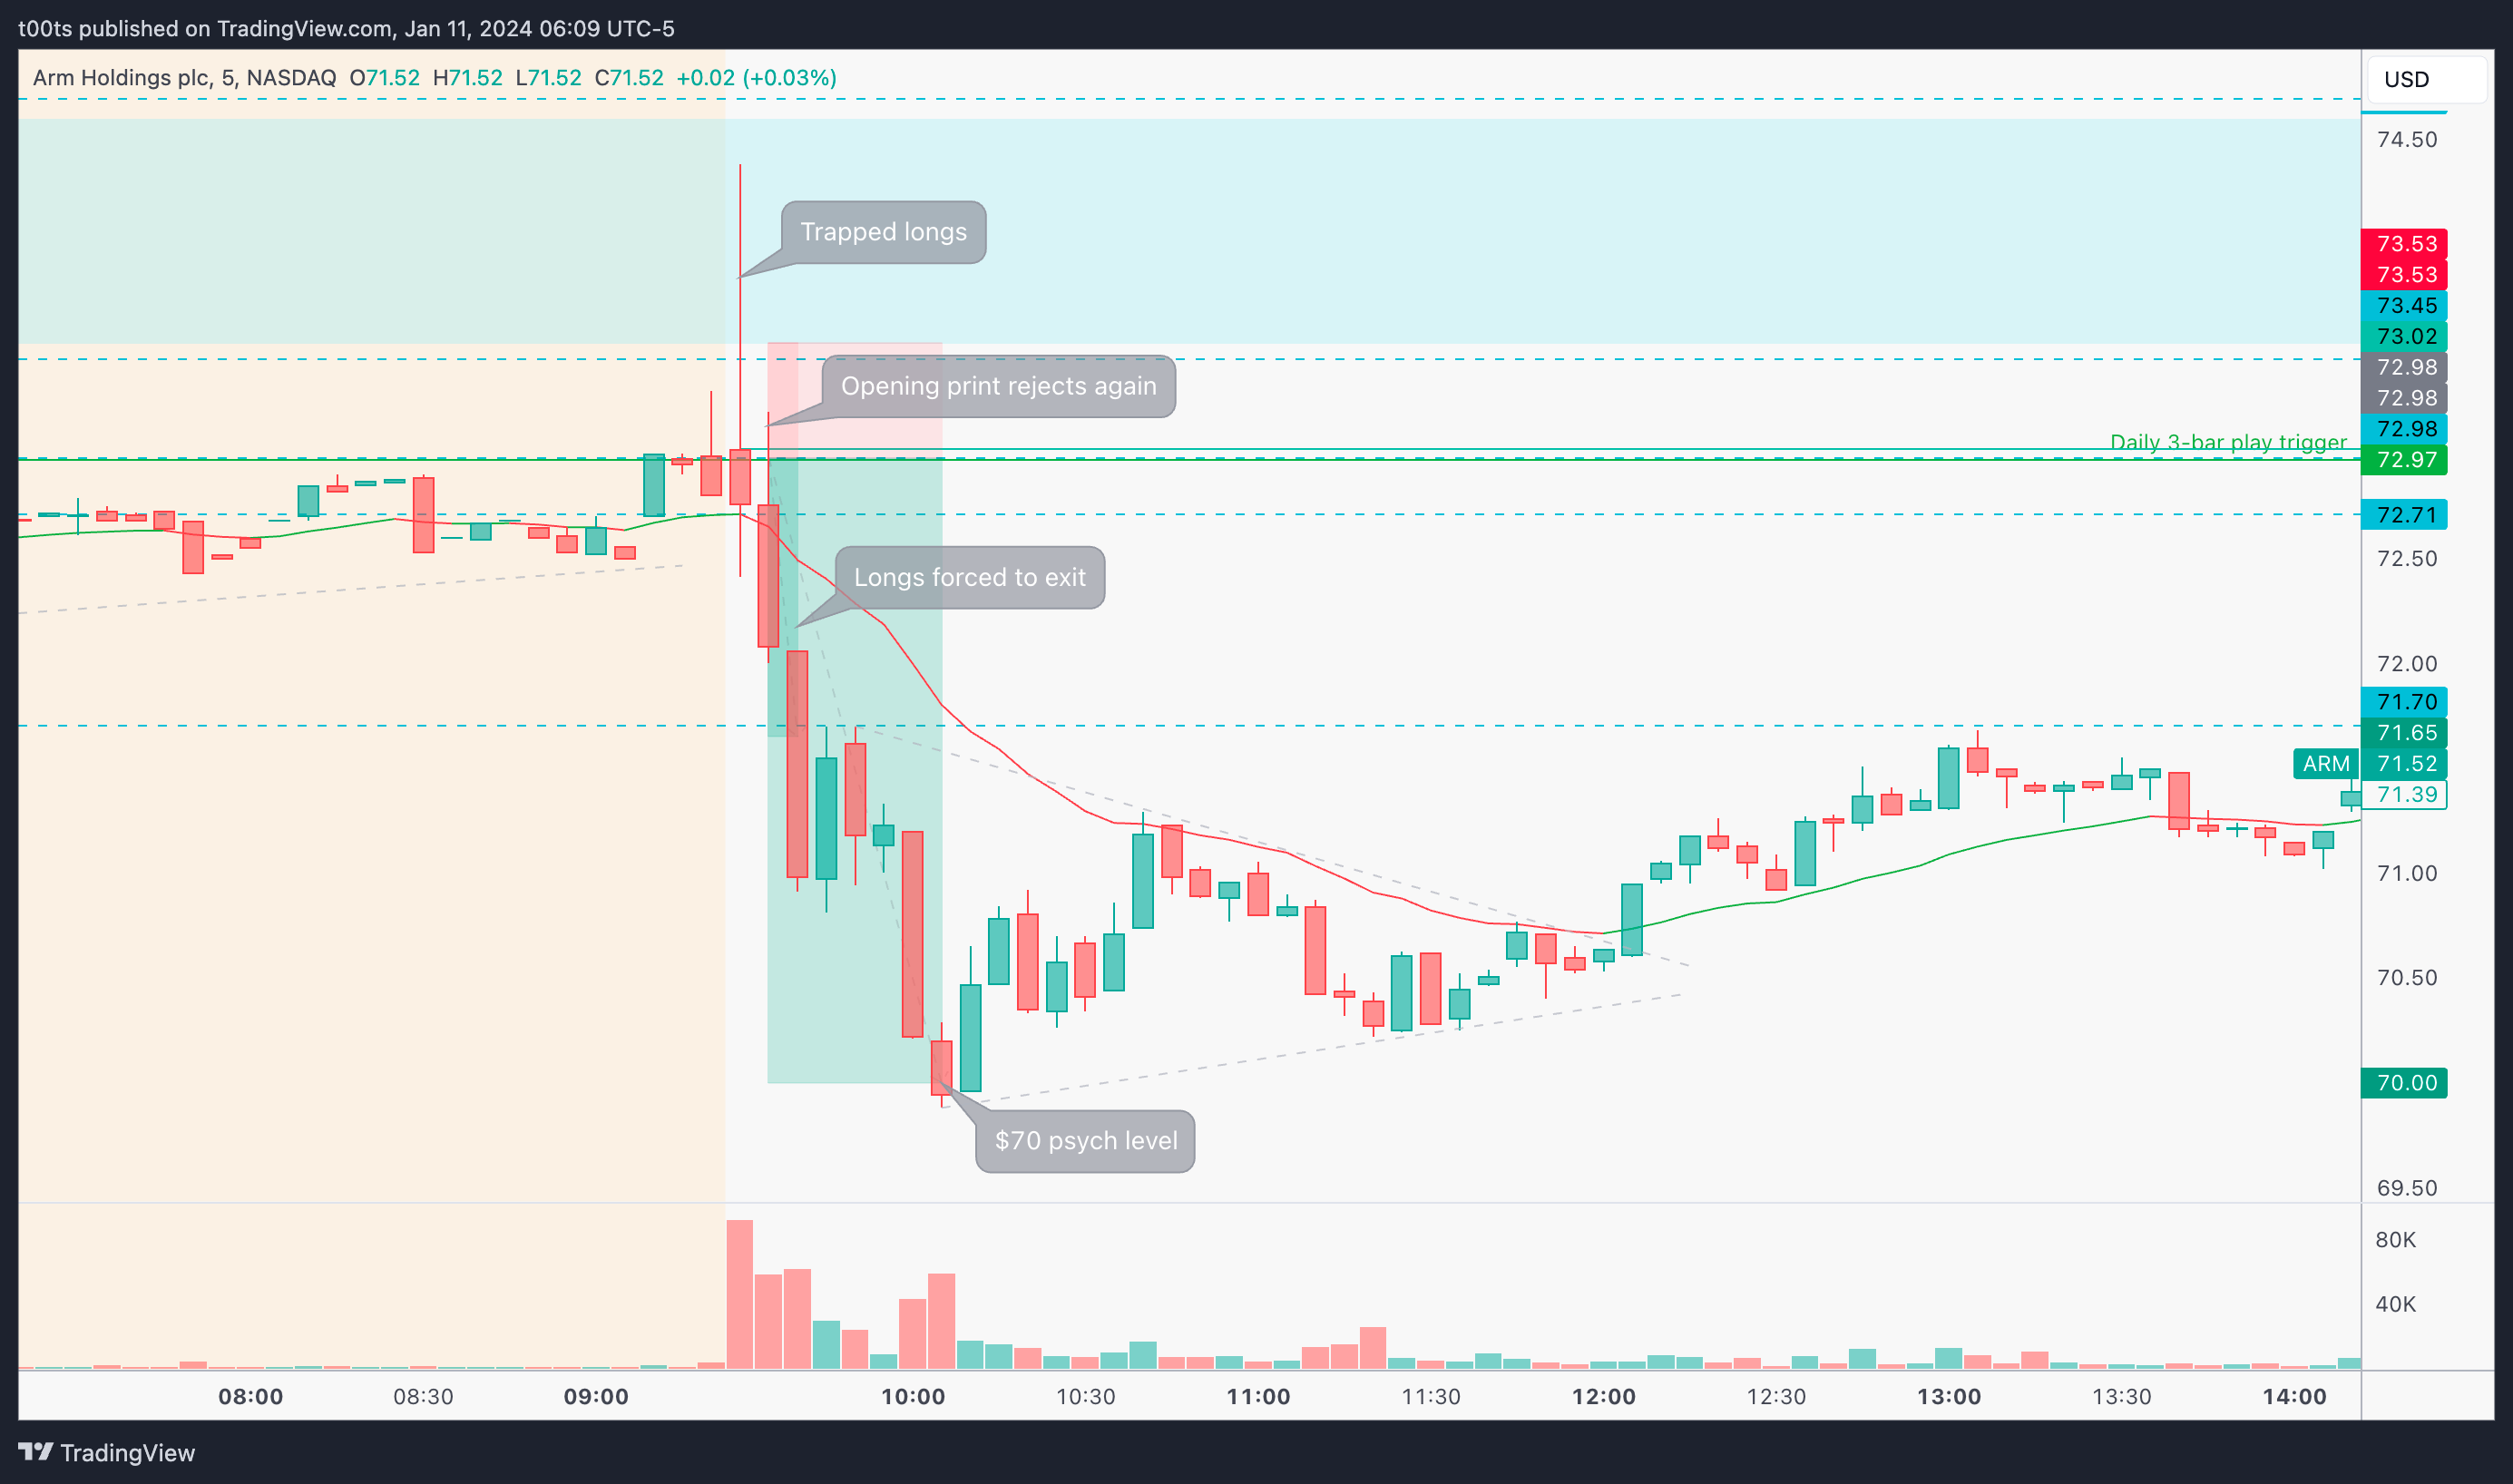
All the longs who jumped in as the daily 3-bar play triggered are now completely trapped and mostly in the red. A break below this bar's low should trigger a lot of their stops, leading to selling pressure.
I didn't want to wait for the lows to be breached, so my plan was to short the opening print, which coincidentally was just a few cents away from the daily trigger level. This offered me more confluence and a better R:R, as ultimately I was willing to risk against the $73.35 level.
Trigger
Price retesting the opening print.
5m chart
2m chart
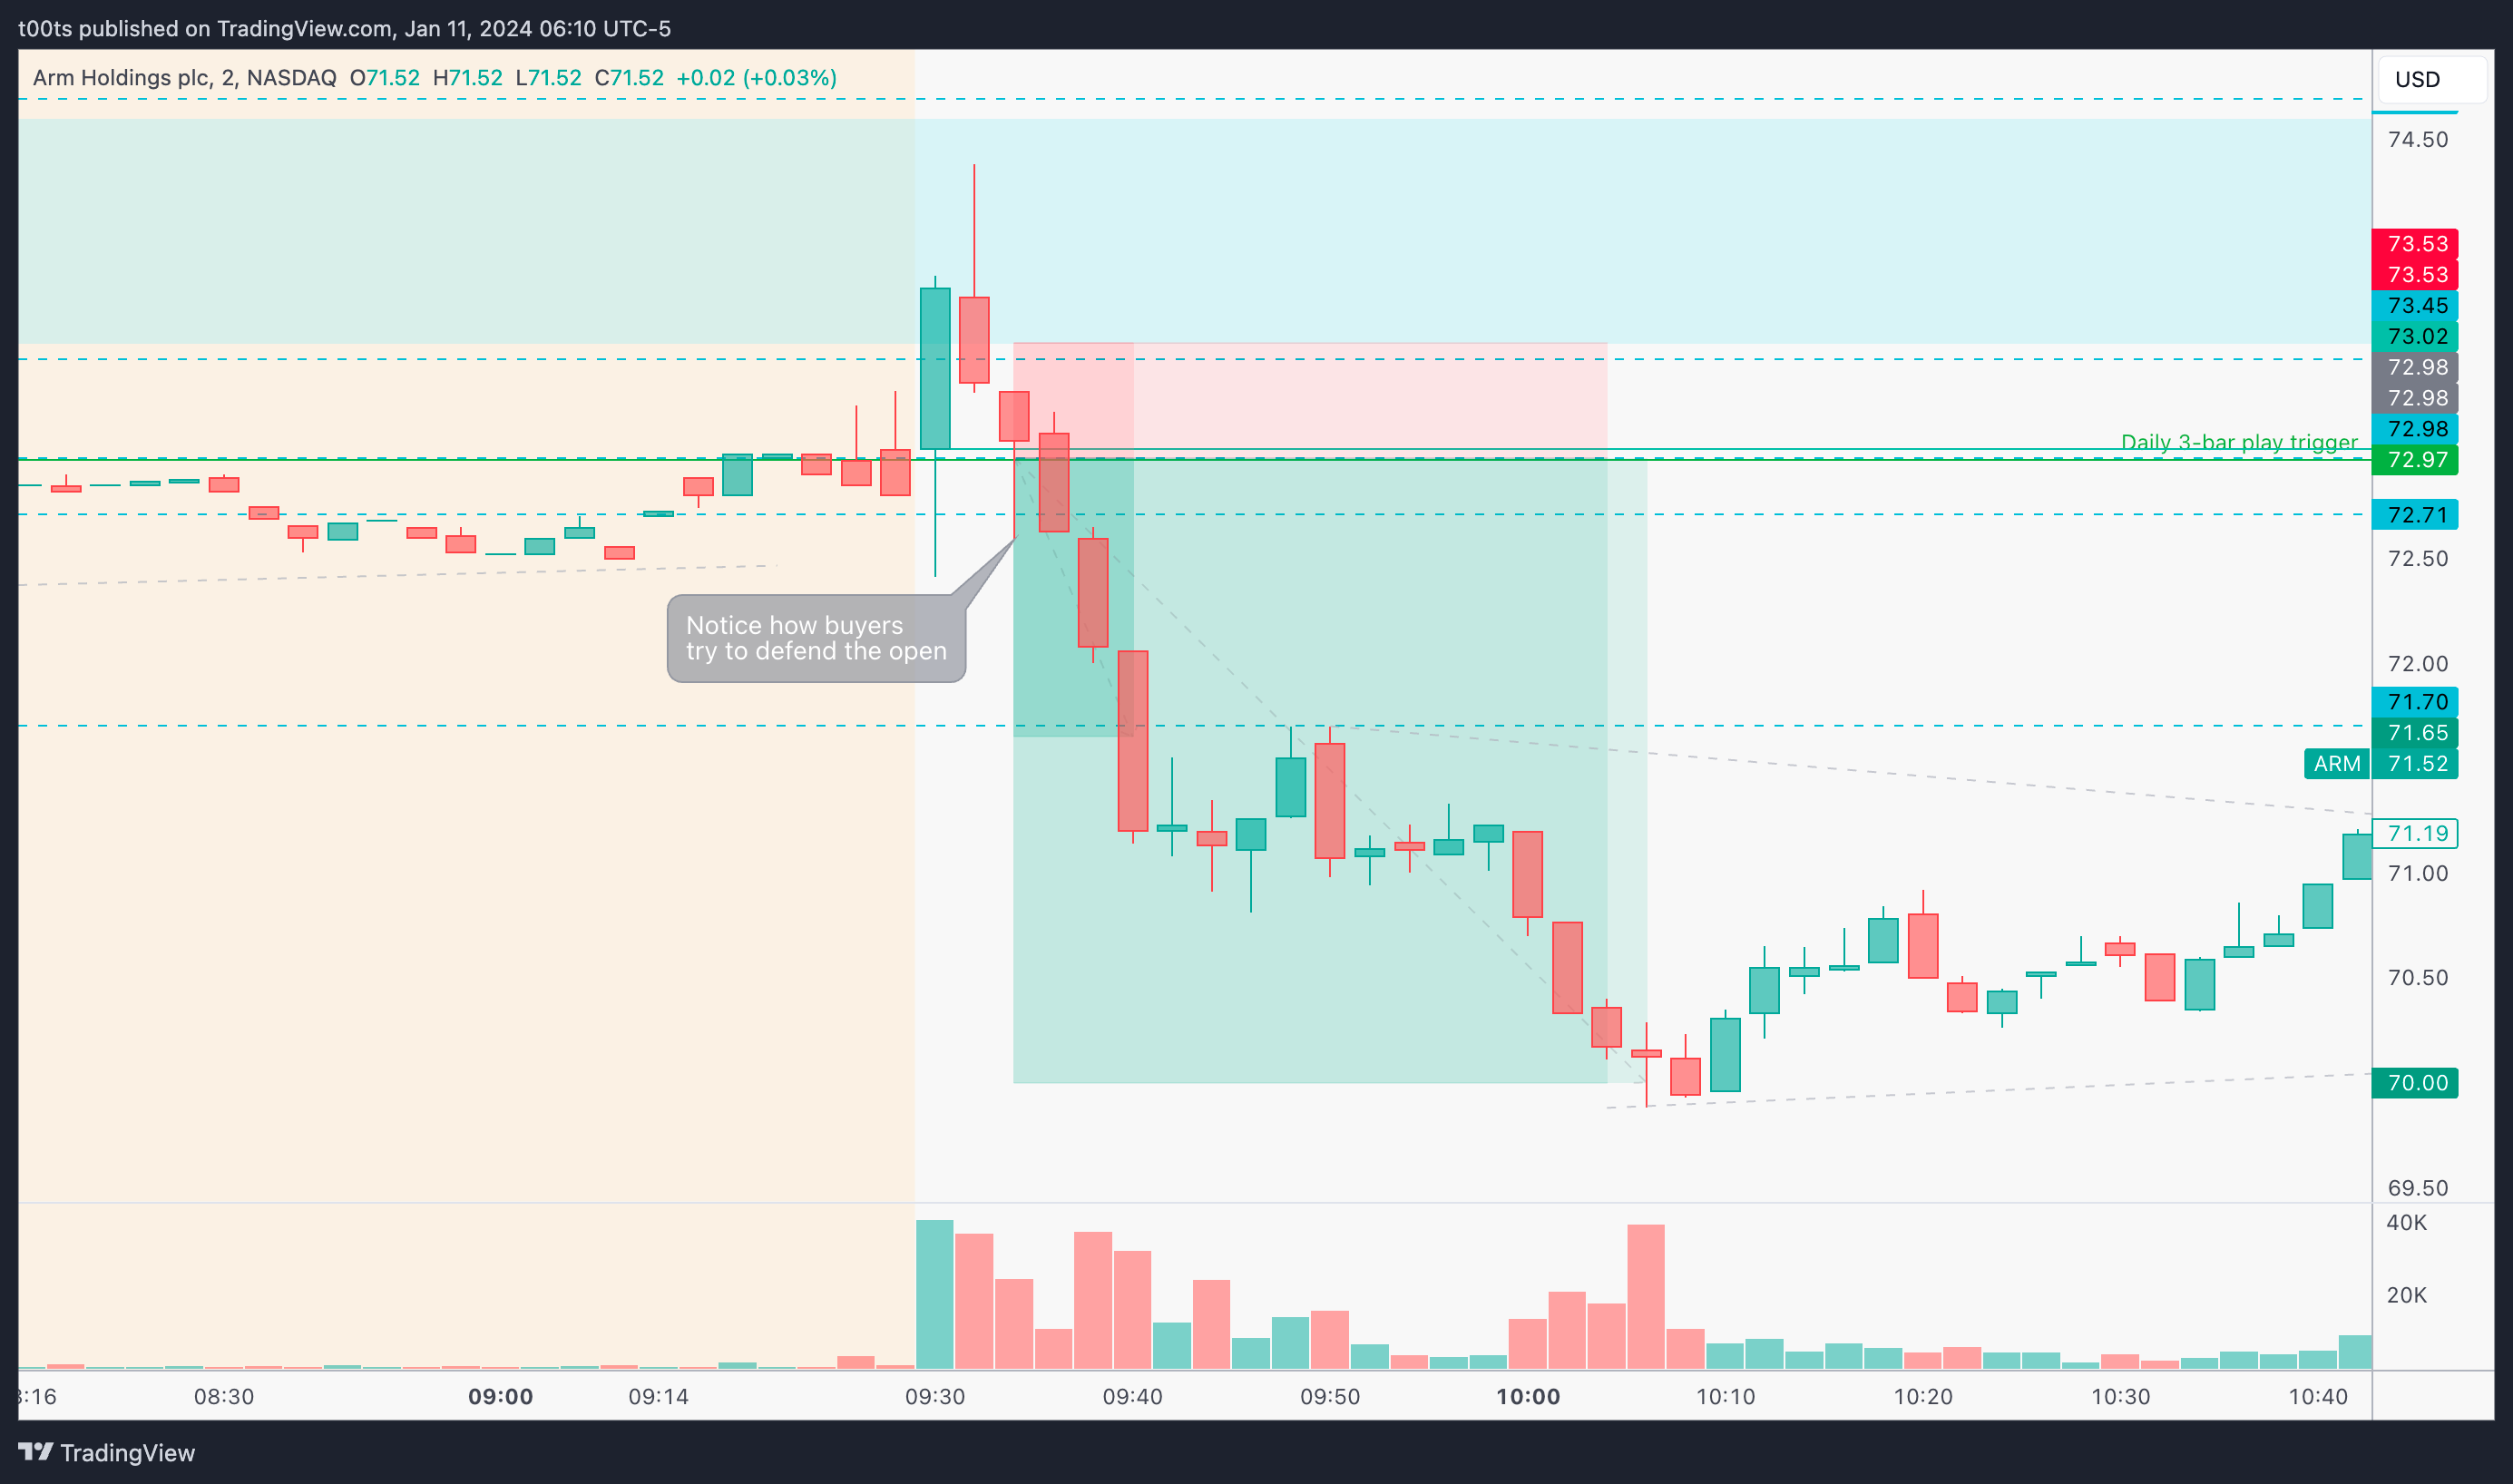
One of those entries where I didn't really wait for an entry setup. The rejection on the open was so strong in real-time it just told a story by itself. Add that to the overall context of the trade and it really made sense to just jump straight in. You could've waited for that breakdown of the first 5m bar low and risk against the opening print and still yield good results. There was also a clean retest and sell setup against the $71.66 level later on that you could take.
I personally trimmed most of my position at the $70 psychological level, and hindsight I was very glad I did because that marked the low of the day. Tried to hold the runners using the 20EMA I've preached a few times as reference, but didn't quite like the action and got out a lot earlier.
In the grand scheme of things, this was a counter-trend trade, so I'd rather be quick taking profits than sitting here waiting for a bigger move. On with trend trades I've learned to be more patient in holding through pullbacks. The trick is shifting your focus to a higher timeframe chart (15m and above). The moment I did that with ARM, I realized that for further downside we'd probably have to test the $71.66 again, and I wasn't willing to give that back, especially with weekly options.
Closing notes
You should never be excited about a trade, but I have to admit I got a bit excited about this one. If you've been following this publication, you'll know that I love failure patterns. This all happened so quickly I was lucky to not get involved in the wrong side of the trade, which was really the side I was planning for.
This comes to show how you always have to be flexible with your plan and adapt to what's in front of you, not what's in your head. It also brings to the table the potential that these failed patterns convey. The most powerful setups are usually the obvious, textbook setups that fail, leaving traders trapped.
I am posting one trade writeup every day throughout 2024. I focus on large caps using levels and price action. The subscription is absolutely free and will always be. I will strive to provide value by offering clues and ideas for you to enhance your edge. Let’s grow together!