

Higher timeframe context
Tesla stock has been on an absolute meltdown for the past few weeks. The sentiment on the stock is as weak as it's ever been. The long trade was probably one of the most crowded trades in the market until the earnings drop kicked everyone out. Ever since, the stock has been experiencing what's commonly referred to as “post-earnings drift”, moving lower while everyone wonders how low can this name go.
Weekly chart
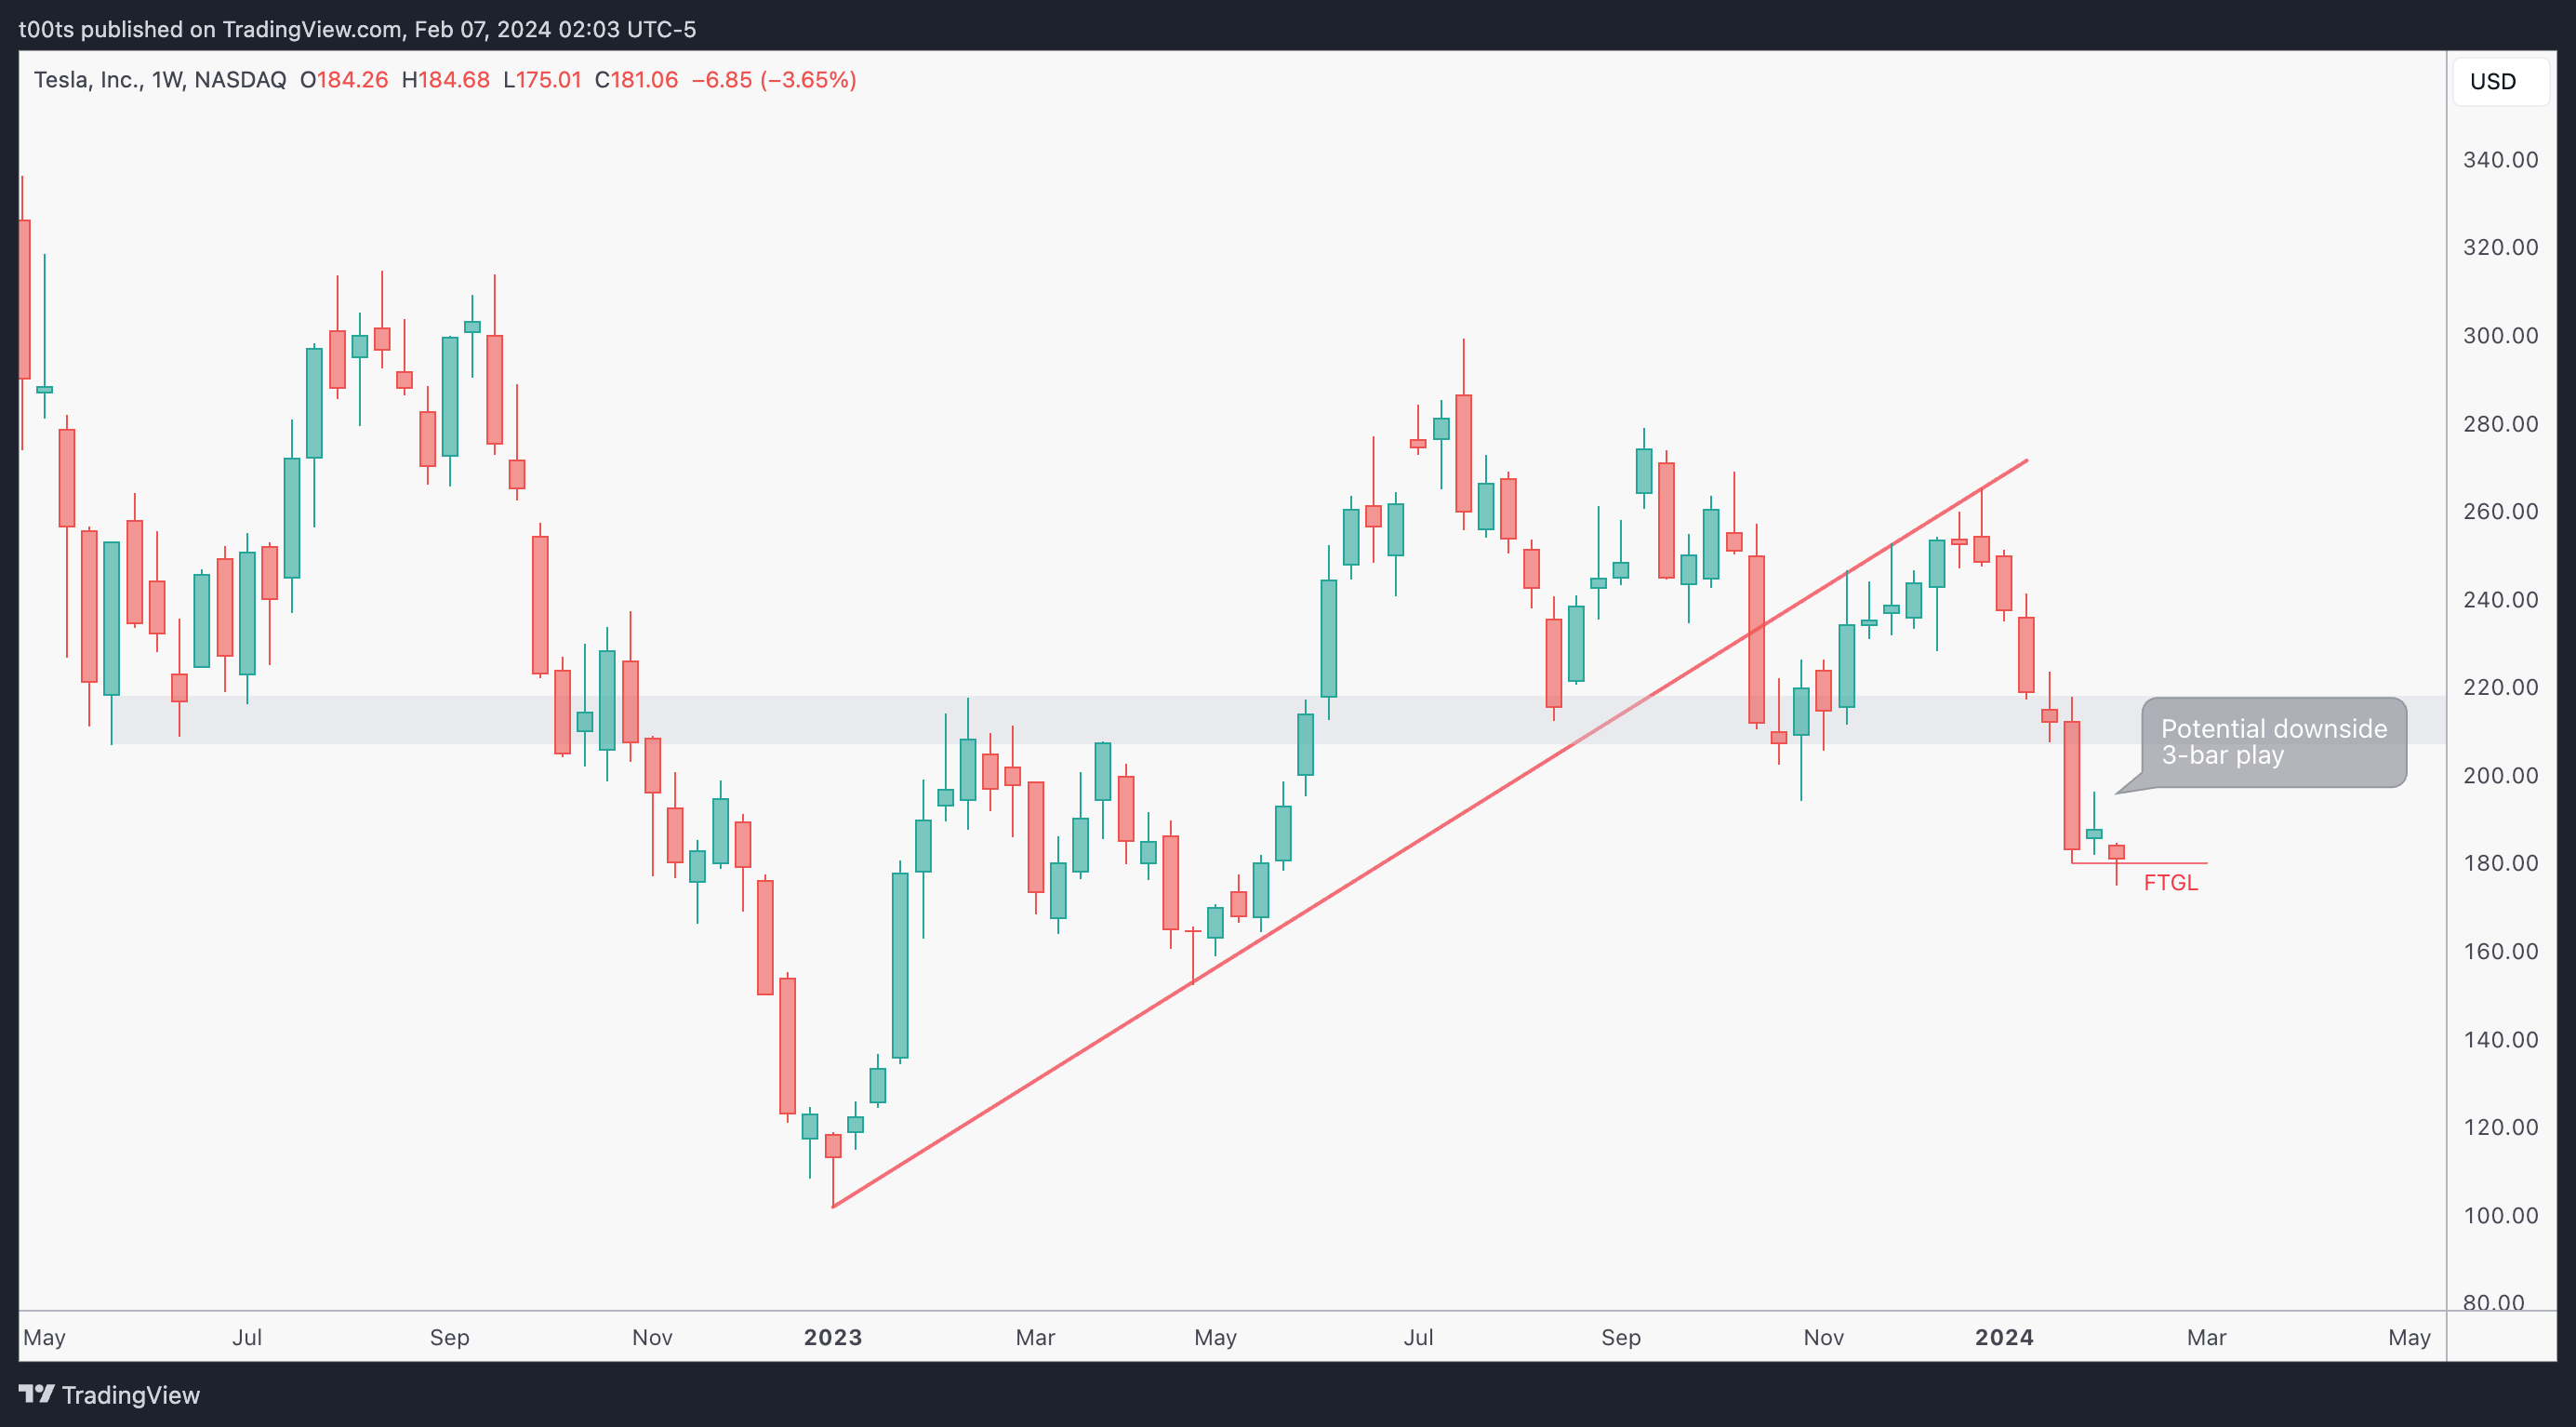
A weekly chart I have been posting about for some time now. Anyone who's been trying to long this has failed, myself included. No demand area, support level, Elliot Wave, or FIB has been able to stop this meltdown. But something stood out after Monday's price action.
Notice how there's a 3-bar play setting up to the downside. However, after Monday's close, it seems like the pattern could fail and leave a bunch of sellers trapped. This scenario catches my attention, as I love trading failed patterns.
Given the overextension to the downside, and the lack of any notable pullback since the drop started 6 weeks ago, this stock is a solid candidate for a relief bounce. That $210 area gave up on their last earnings and should get tested eventually.
Daily chart
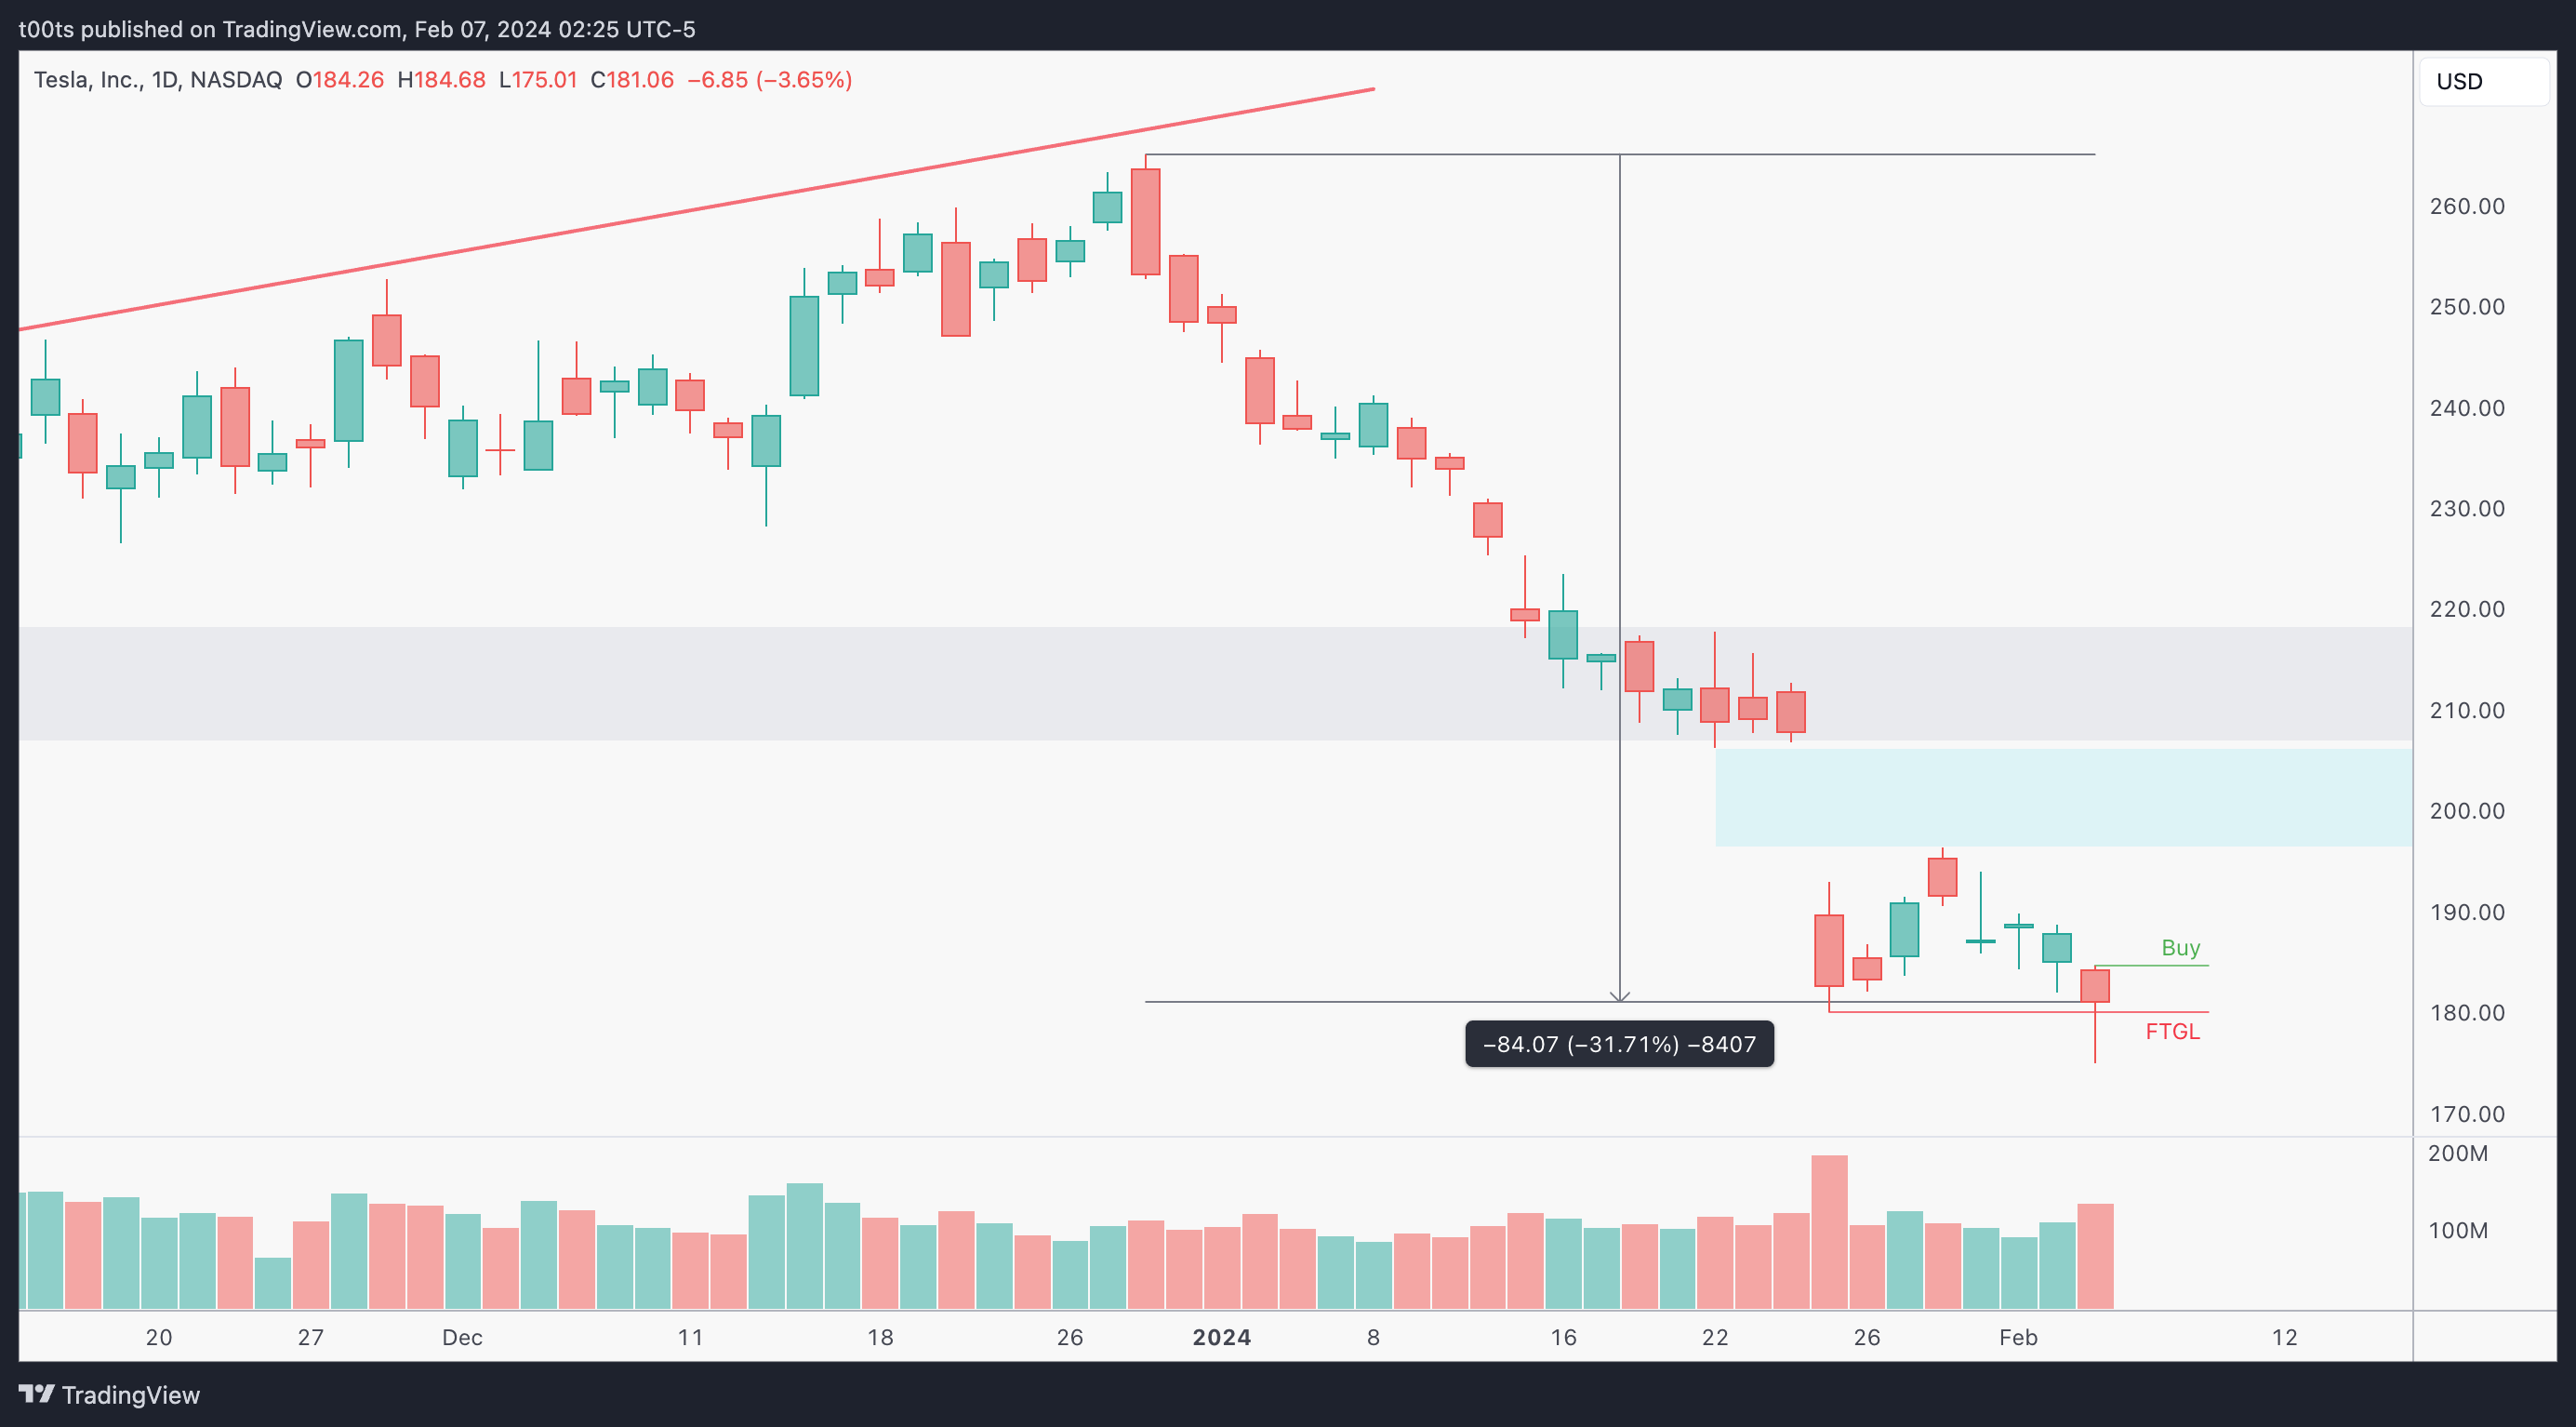
The daily chart gives us a detailed view of the magnitude of this -30% meltdown. Quite literally not a single bounce. We also see the gap that was left behind after the earnings after-hours drop. As we know, gaps tend to get filled, thus most of the time they act as magnets for price.
Let's take a closer look on Monday's action (last bar). While this is not a reversal bar, it trades 5pts below those weekly lows from the post-earnings drift drop, only to wick back up and close above the previous pivot mark. I've added volume to this chart. Notice that it's slightly above average for that day. Again, more clues.
Hourly chart
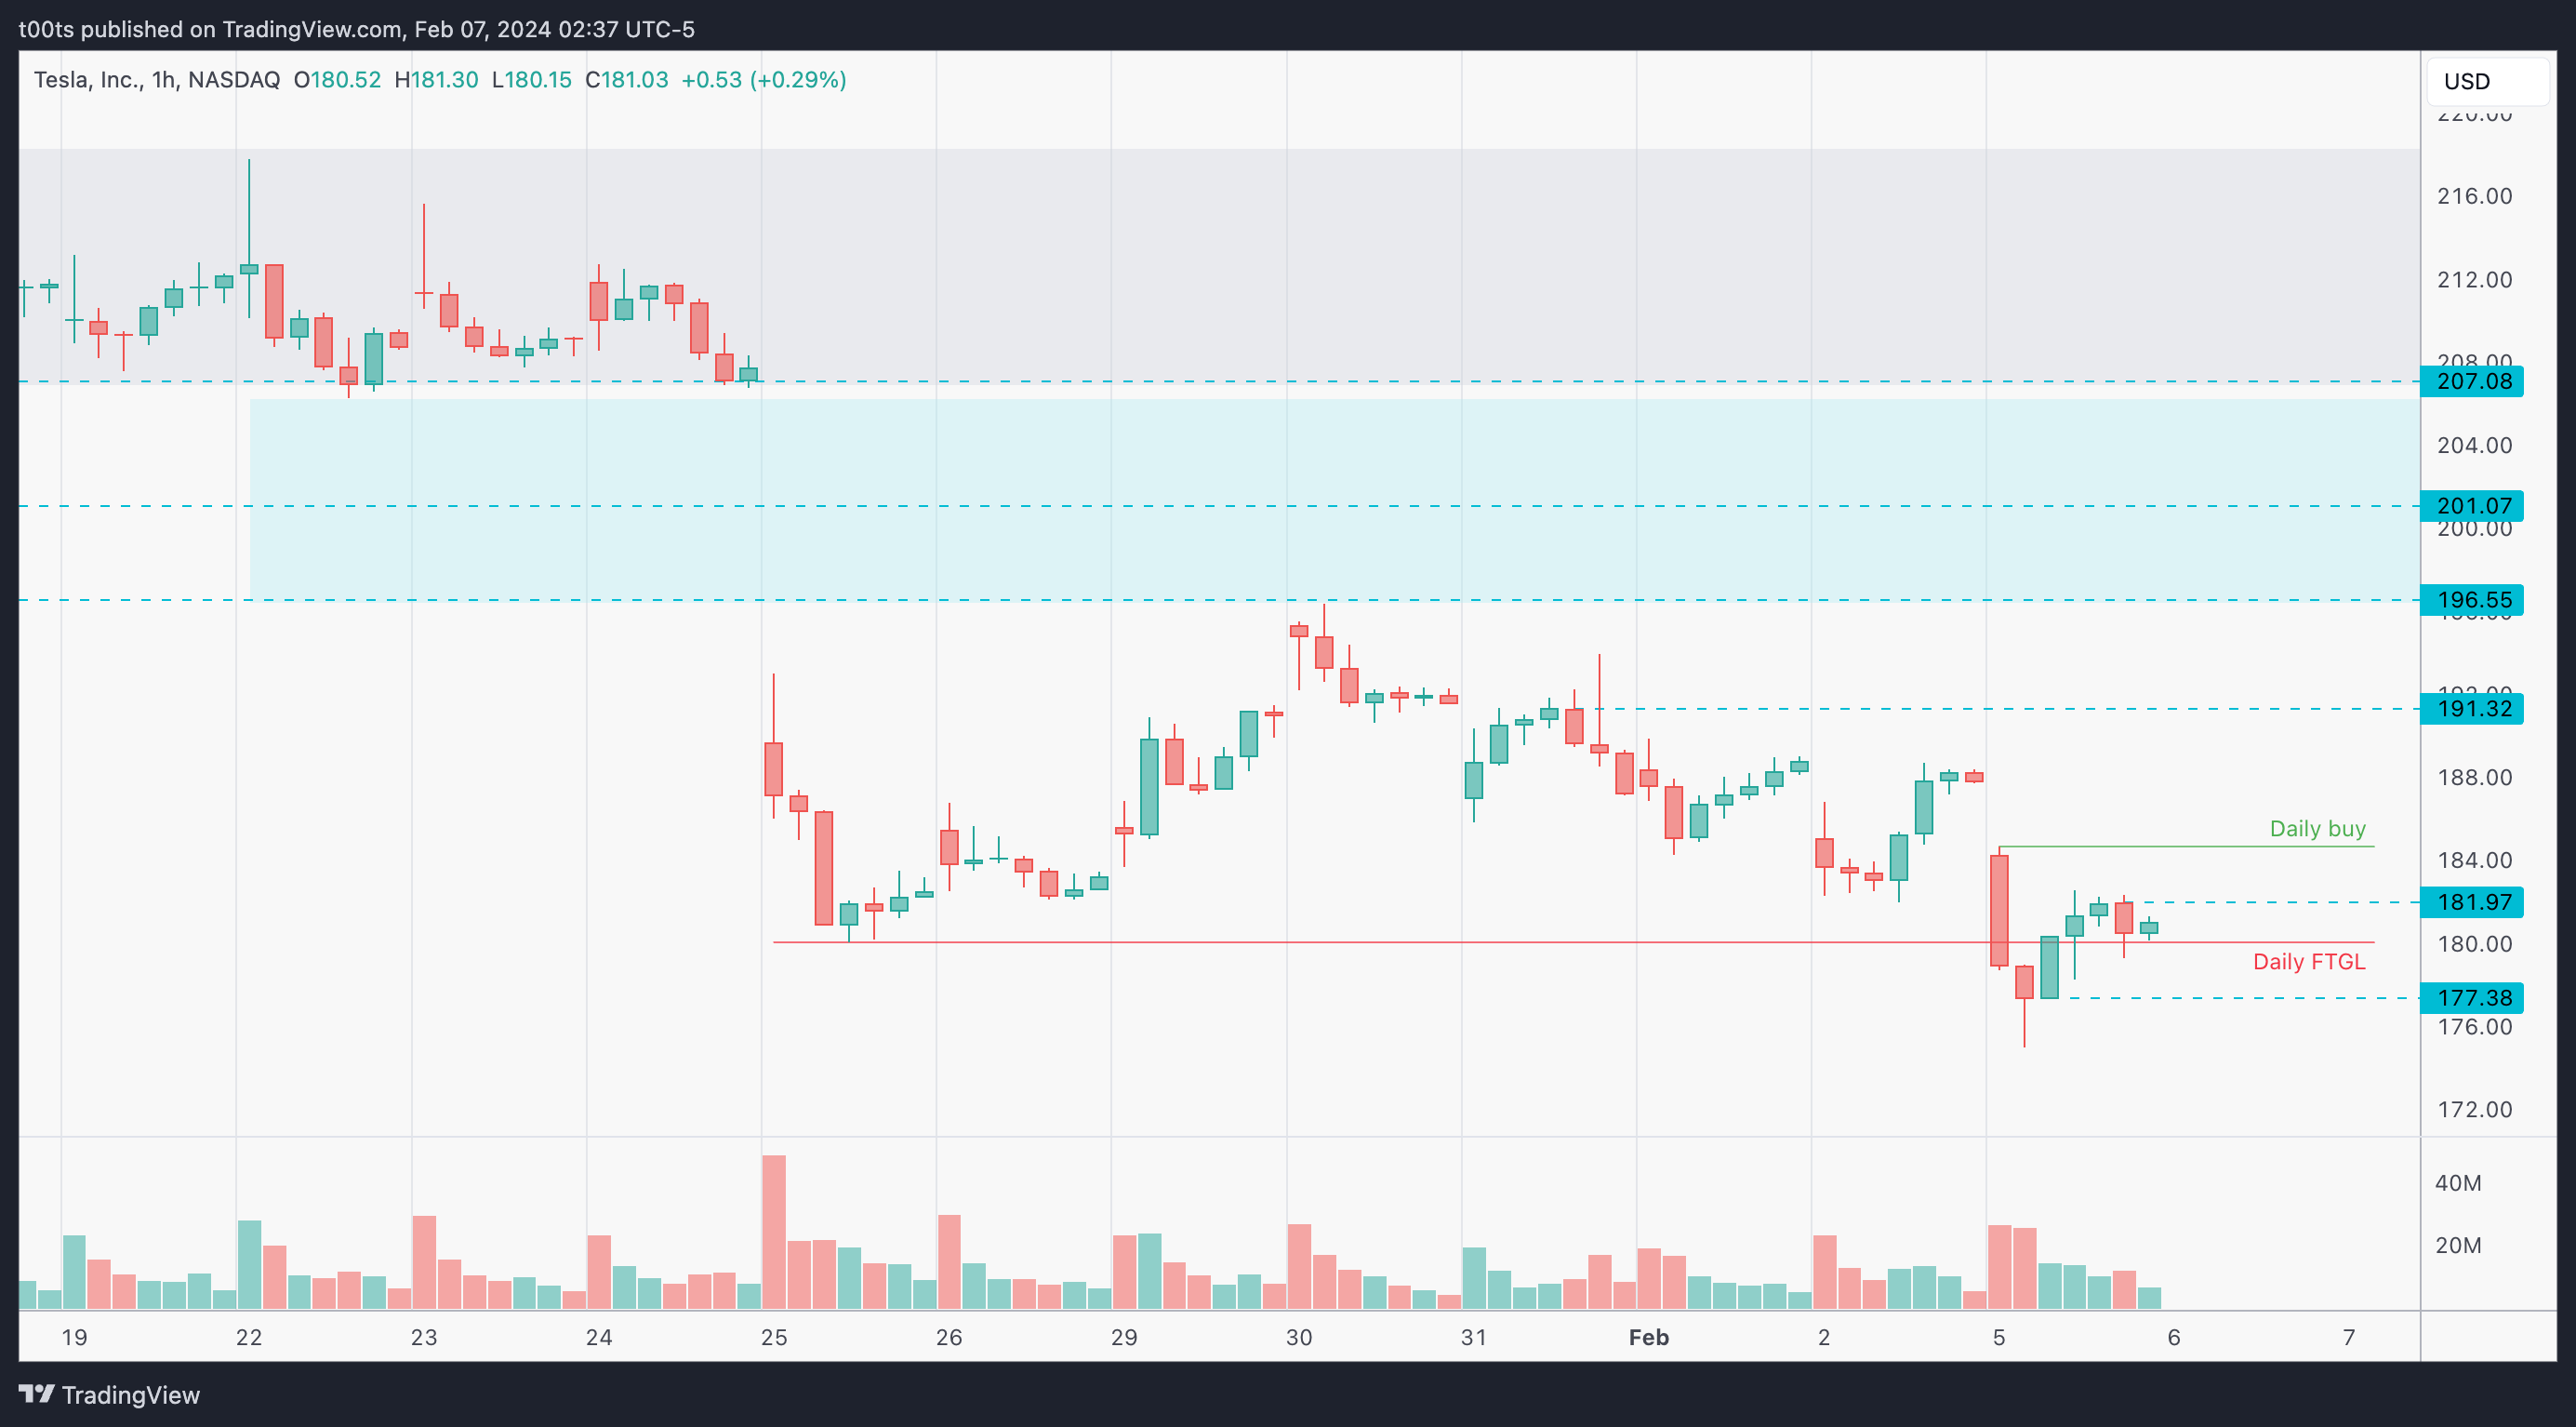
More zoom into the recent action. We're clearly in a downtrend, that's no surprise, but if price can hold the $177.38 and put in a higher low on the hourly, Tesla can set itself up for a move higher that leads us to that much awaited relief bounce.
While I'm not an advocate of longing a downtrend (or vice-versa), if our risk is in check and we have a solid thesis that supports our trade idea there’s nothing wrong in taking that trade.
Pre-market action
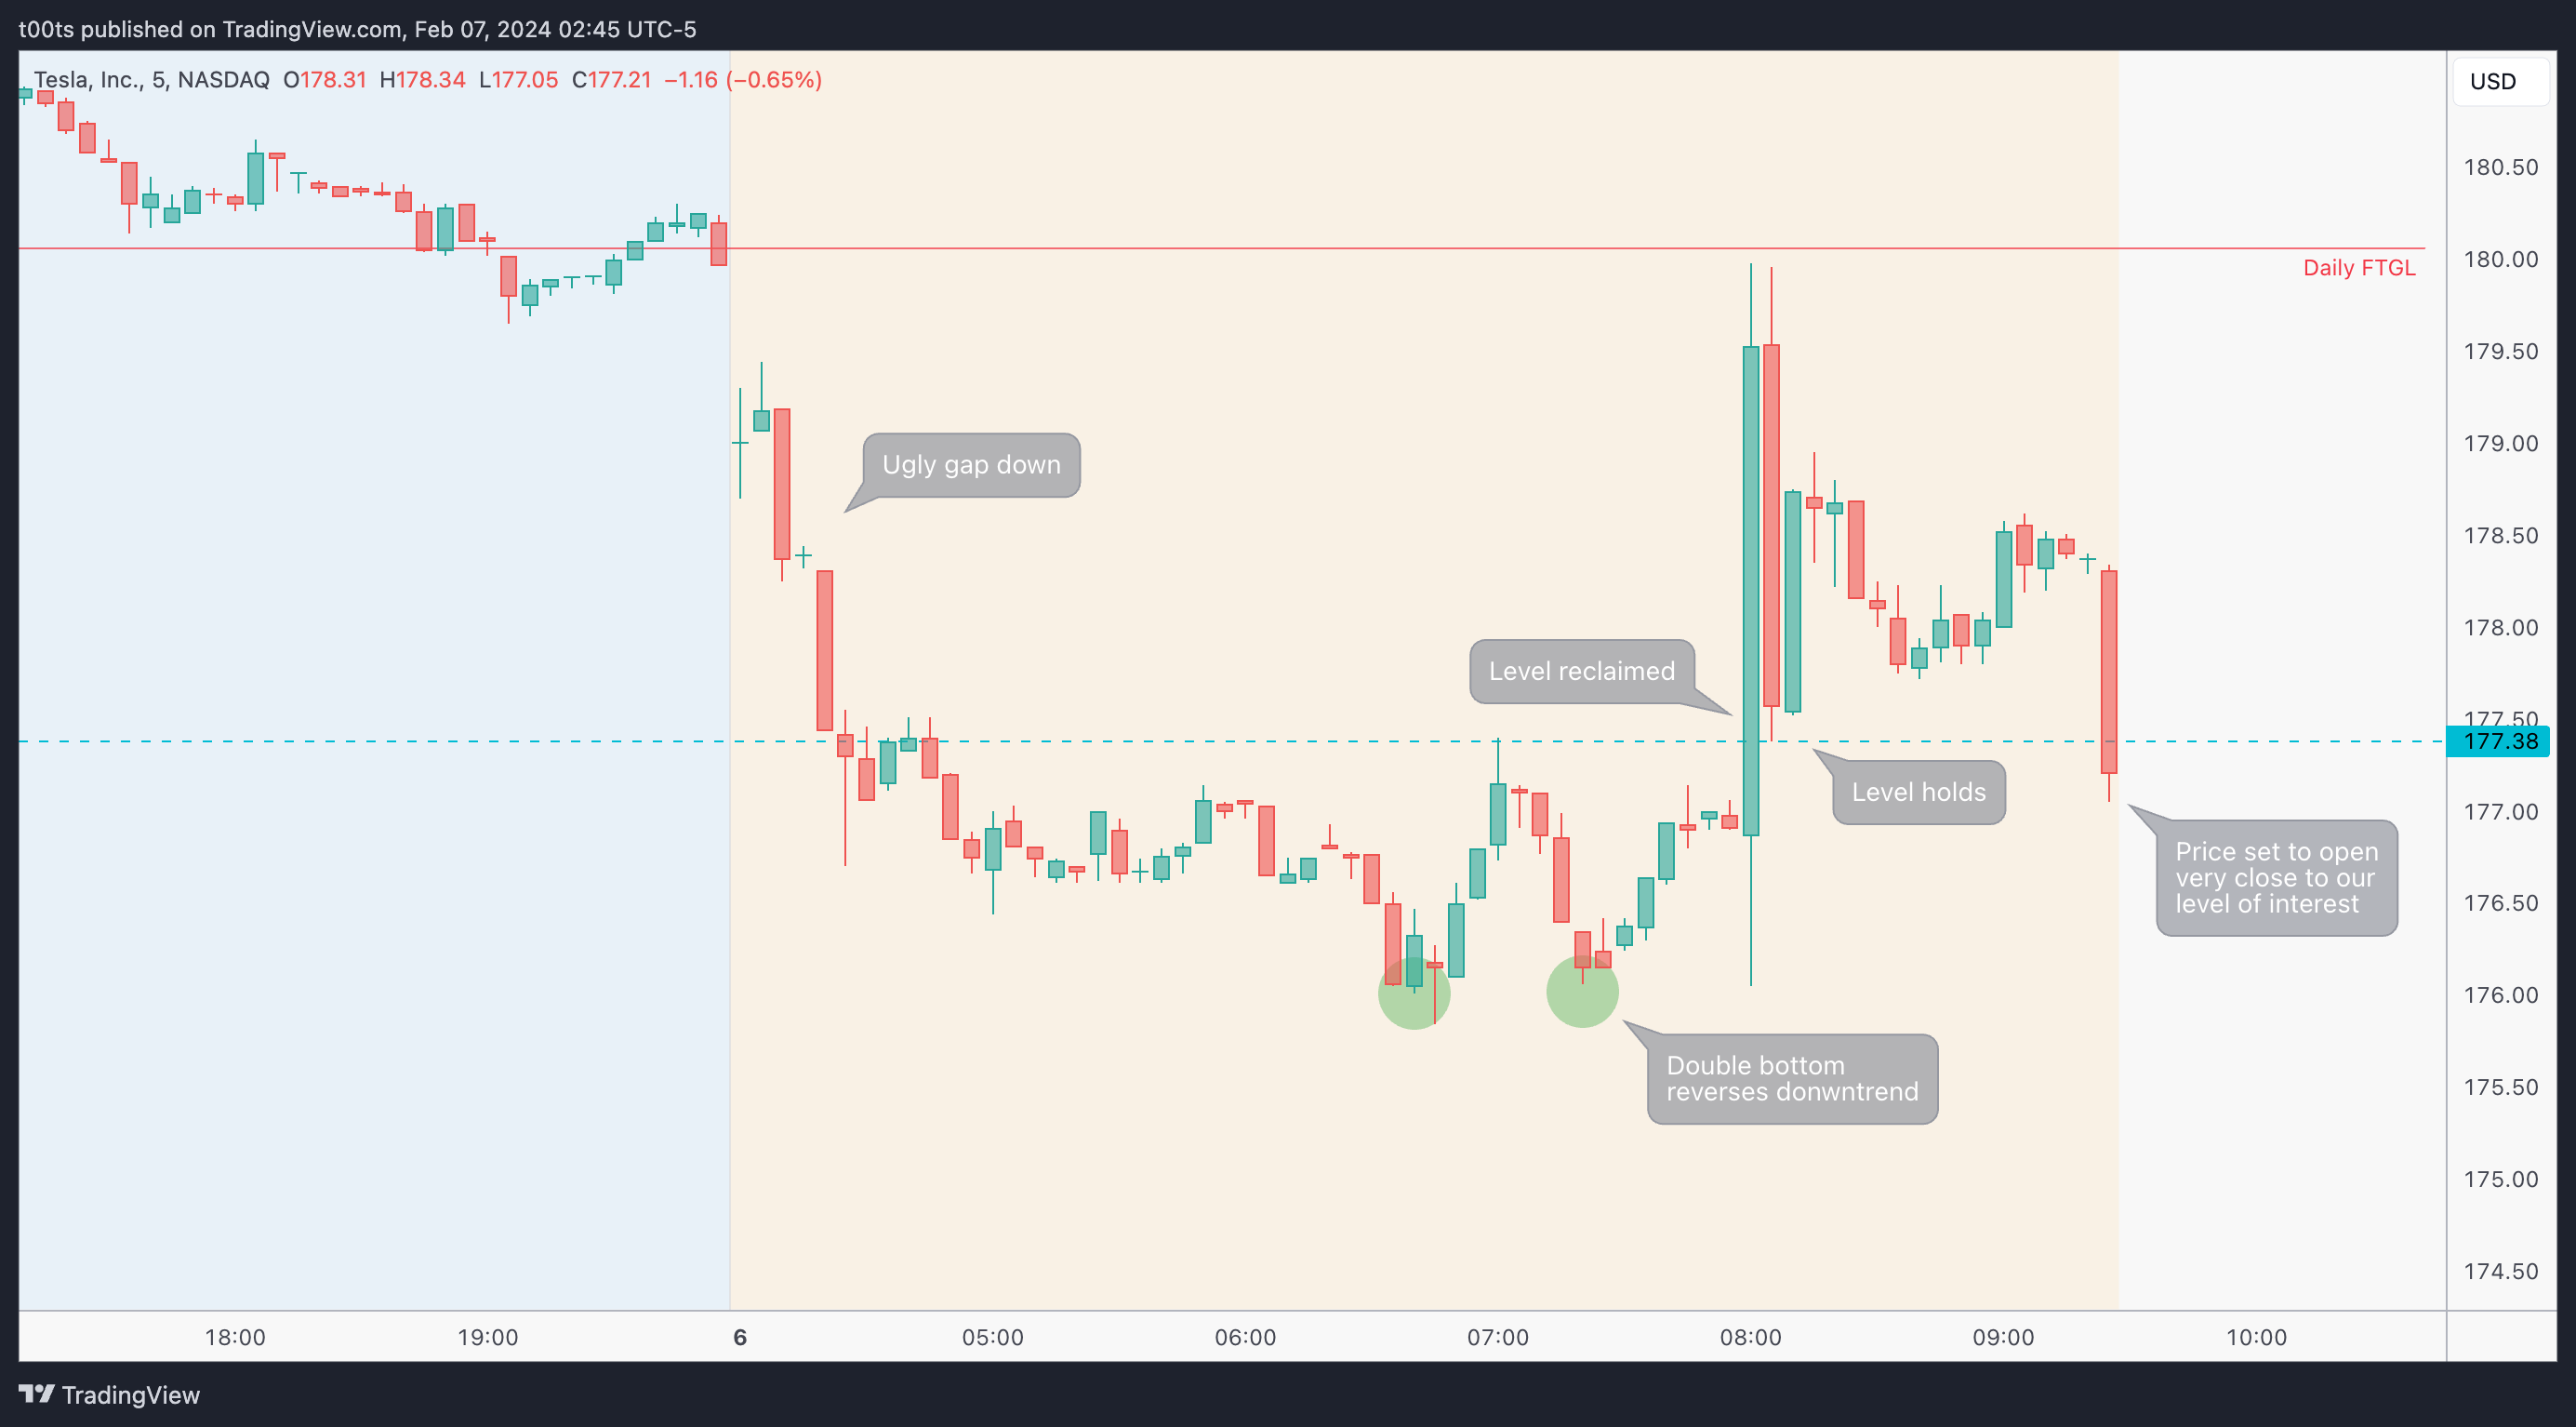
At first I was surprised with the absence of a mild gap up on this stock given the strong close we had seen. When it started melting early in the day I was somewhat disappointed. After all these clues, were we really going to keep selling off?
Eventually the $176 area holds (no level there) and price reclaims our $177.38 level on a market-wide volatile move. What's important is that as price drifts back down, the level holds.
For someone that didn't have their levels up, that last 5m candle before the bell might have been a downer. For me, that meant better risk-to-reward for our opening drive long trade idea.
The trade
I'll be the first to admit this has not been the first time I've tried to long TSLA during this drop. But this has been the first time I actually trade on existing variables and not on ego or hope. And guess what, it worked.
Using our CPT Framework:
Cue(s)
Stock is down 30% in a 6-week period, with barely any significant pullback
Potential weekly 3-bar play failure could lead to a much needed relief bounce
Unfilled daily gap above
Stock set to open right in our line in the sand for a potential bounce
Plan
Go long against the $137.38.
Trigger(s)
Price trading above the $137.38.
5m chart
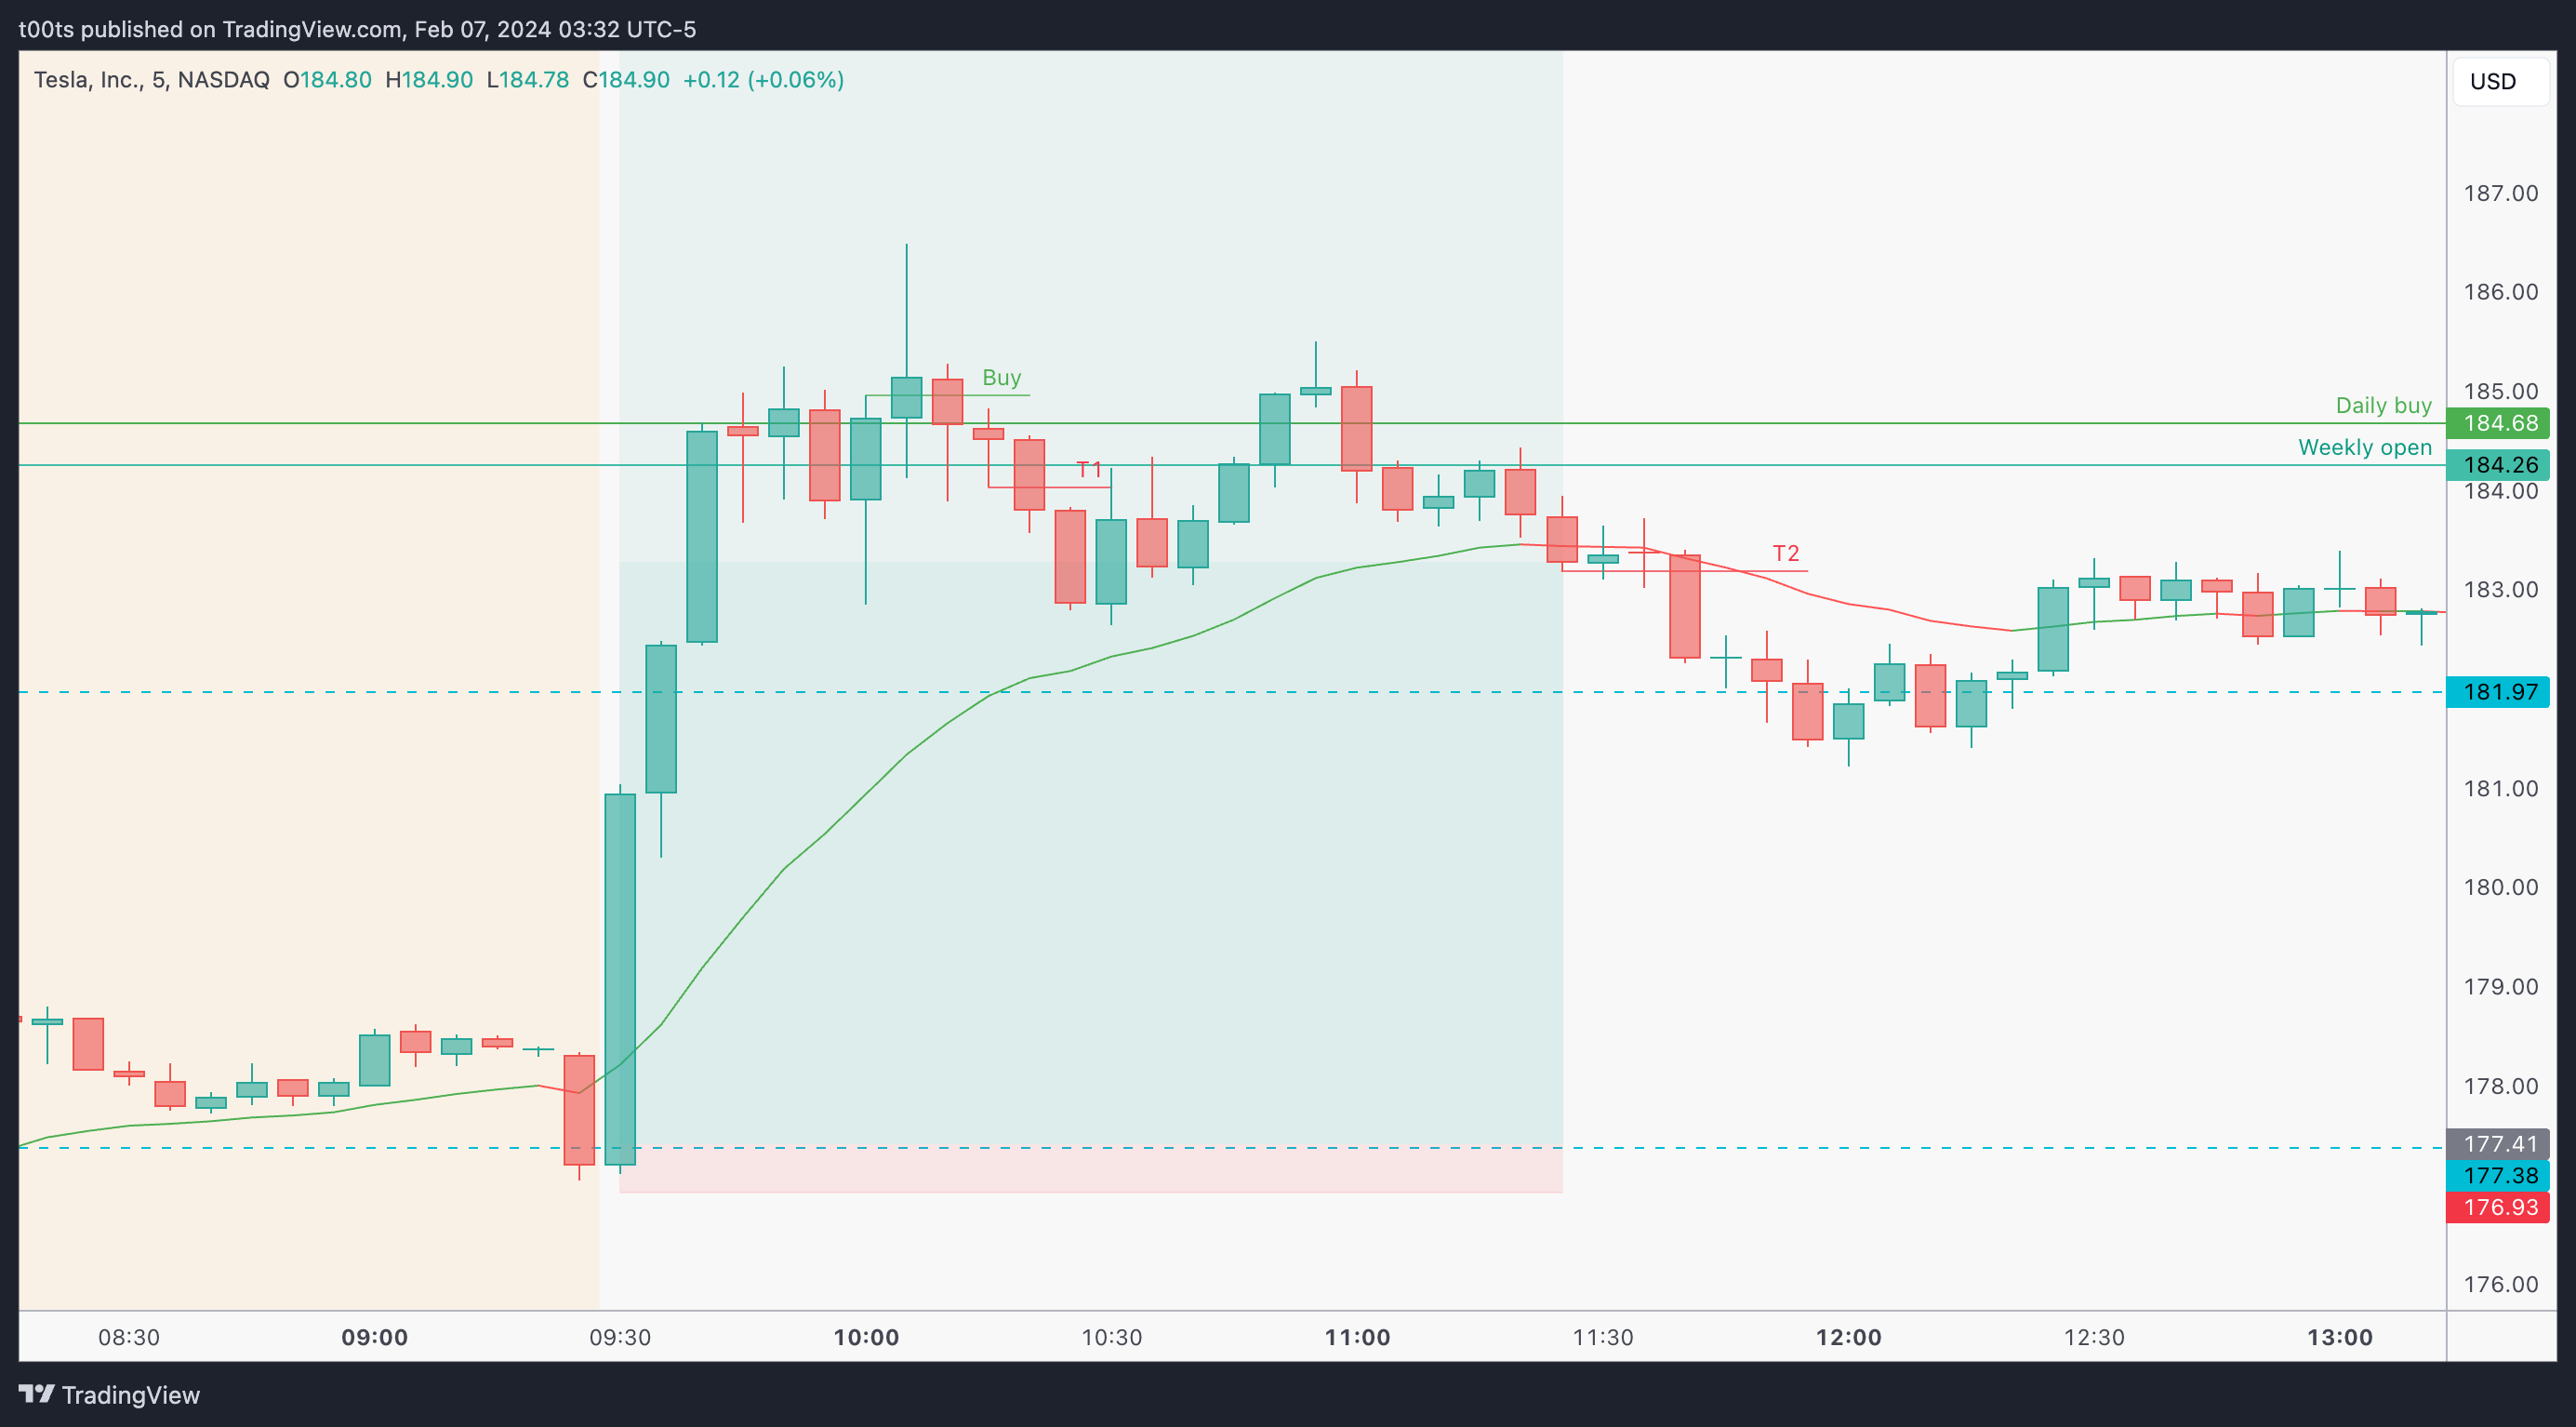
The trade triggers immediately.
I understand many will be hesitant on jumping in so close to the bell. As I've mentioned countless times in previous posts, I'm used to trading the open. The first profitable edge I ever discovered and repeatedly traded happened around the open.
It's not even worth commenting on the first part as it's just a straight up push. You're either in it, or you're not. To jump into something like that you need a thesis and a plan. We had both.
Price tries to continue and sets up for another leg up right at the daily buy level, but it gets no follow-through and eventually fails.
The struggle to hold the weekly open was really interesting to witness as it happened live.
Why do we care about the weekly open? Our whole thesis revolves around a failed weekly 3-bar play pattern. The weekly open marks the level above which the weekly bar is green. We want to see that bar turn green as soon as possible.
It's hard to give up on a position when your overall thesis is for a longer hold. I am still holding all my shares, but the weekly options are time-sensitive so you can't sit there hoping.
T1 felt like a good place to trim some. The second push had failed, and although buyers tried to hold the weekly open twice -setting a small inside bar for us to use as reference-, it eventually breaks to the downside, giving us an exit signal.
I rarely use any indicators but I did pull up my “Trend EMA” (just a 20 period EMA with colours, grab the code here) on this one to help me hold for a move higher. The moment the 5m chart closes below the EMA I have to get out. That’s just my ultimate rule to exit trending moves.
Closing notes
I must admit I was expecting a little more, but I'm happy with how things look for a continuation move higher if the overall market holds.
Lately I've been positioning myself with shares on these multi-day swing trades and I like it so far. It allows me to still trade intraday while holding a position that can last for several days or weeks. I do find that the moment I hold a position on anything I'm automatically biased for the intraday, so this is something that will need work.
Overall, very solid and much awaited move from a stock that's been having a rough start to 2024. Targets to the upside are $190 area, $196.50s, and eventually $200s.
I am posting one trade writeup every day throughout 2024. I focus on large caps using levels and price action. The subscription is absolutely free and will always be. I will strive to provide value by offering clues and ideas for you to enhance your edge. Let’s grow together!