
Disney (DIS) - Jan 2nd 2024
Catching the strongest stock on the first trading day of the year

Higher timeframe context
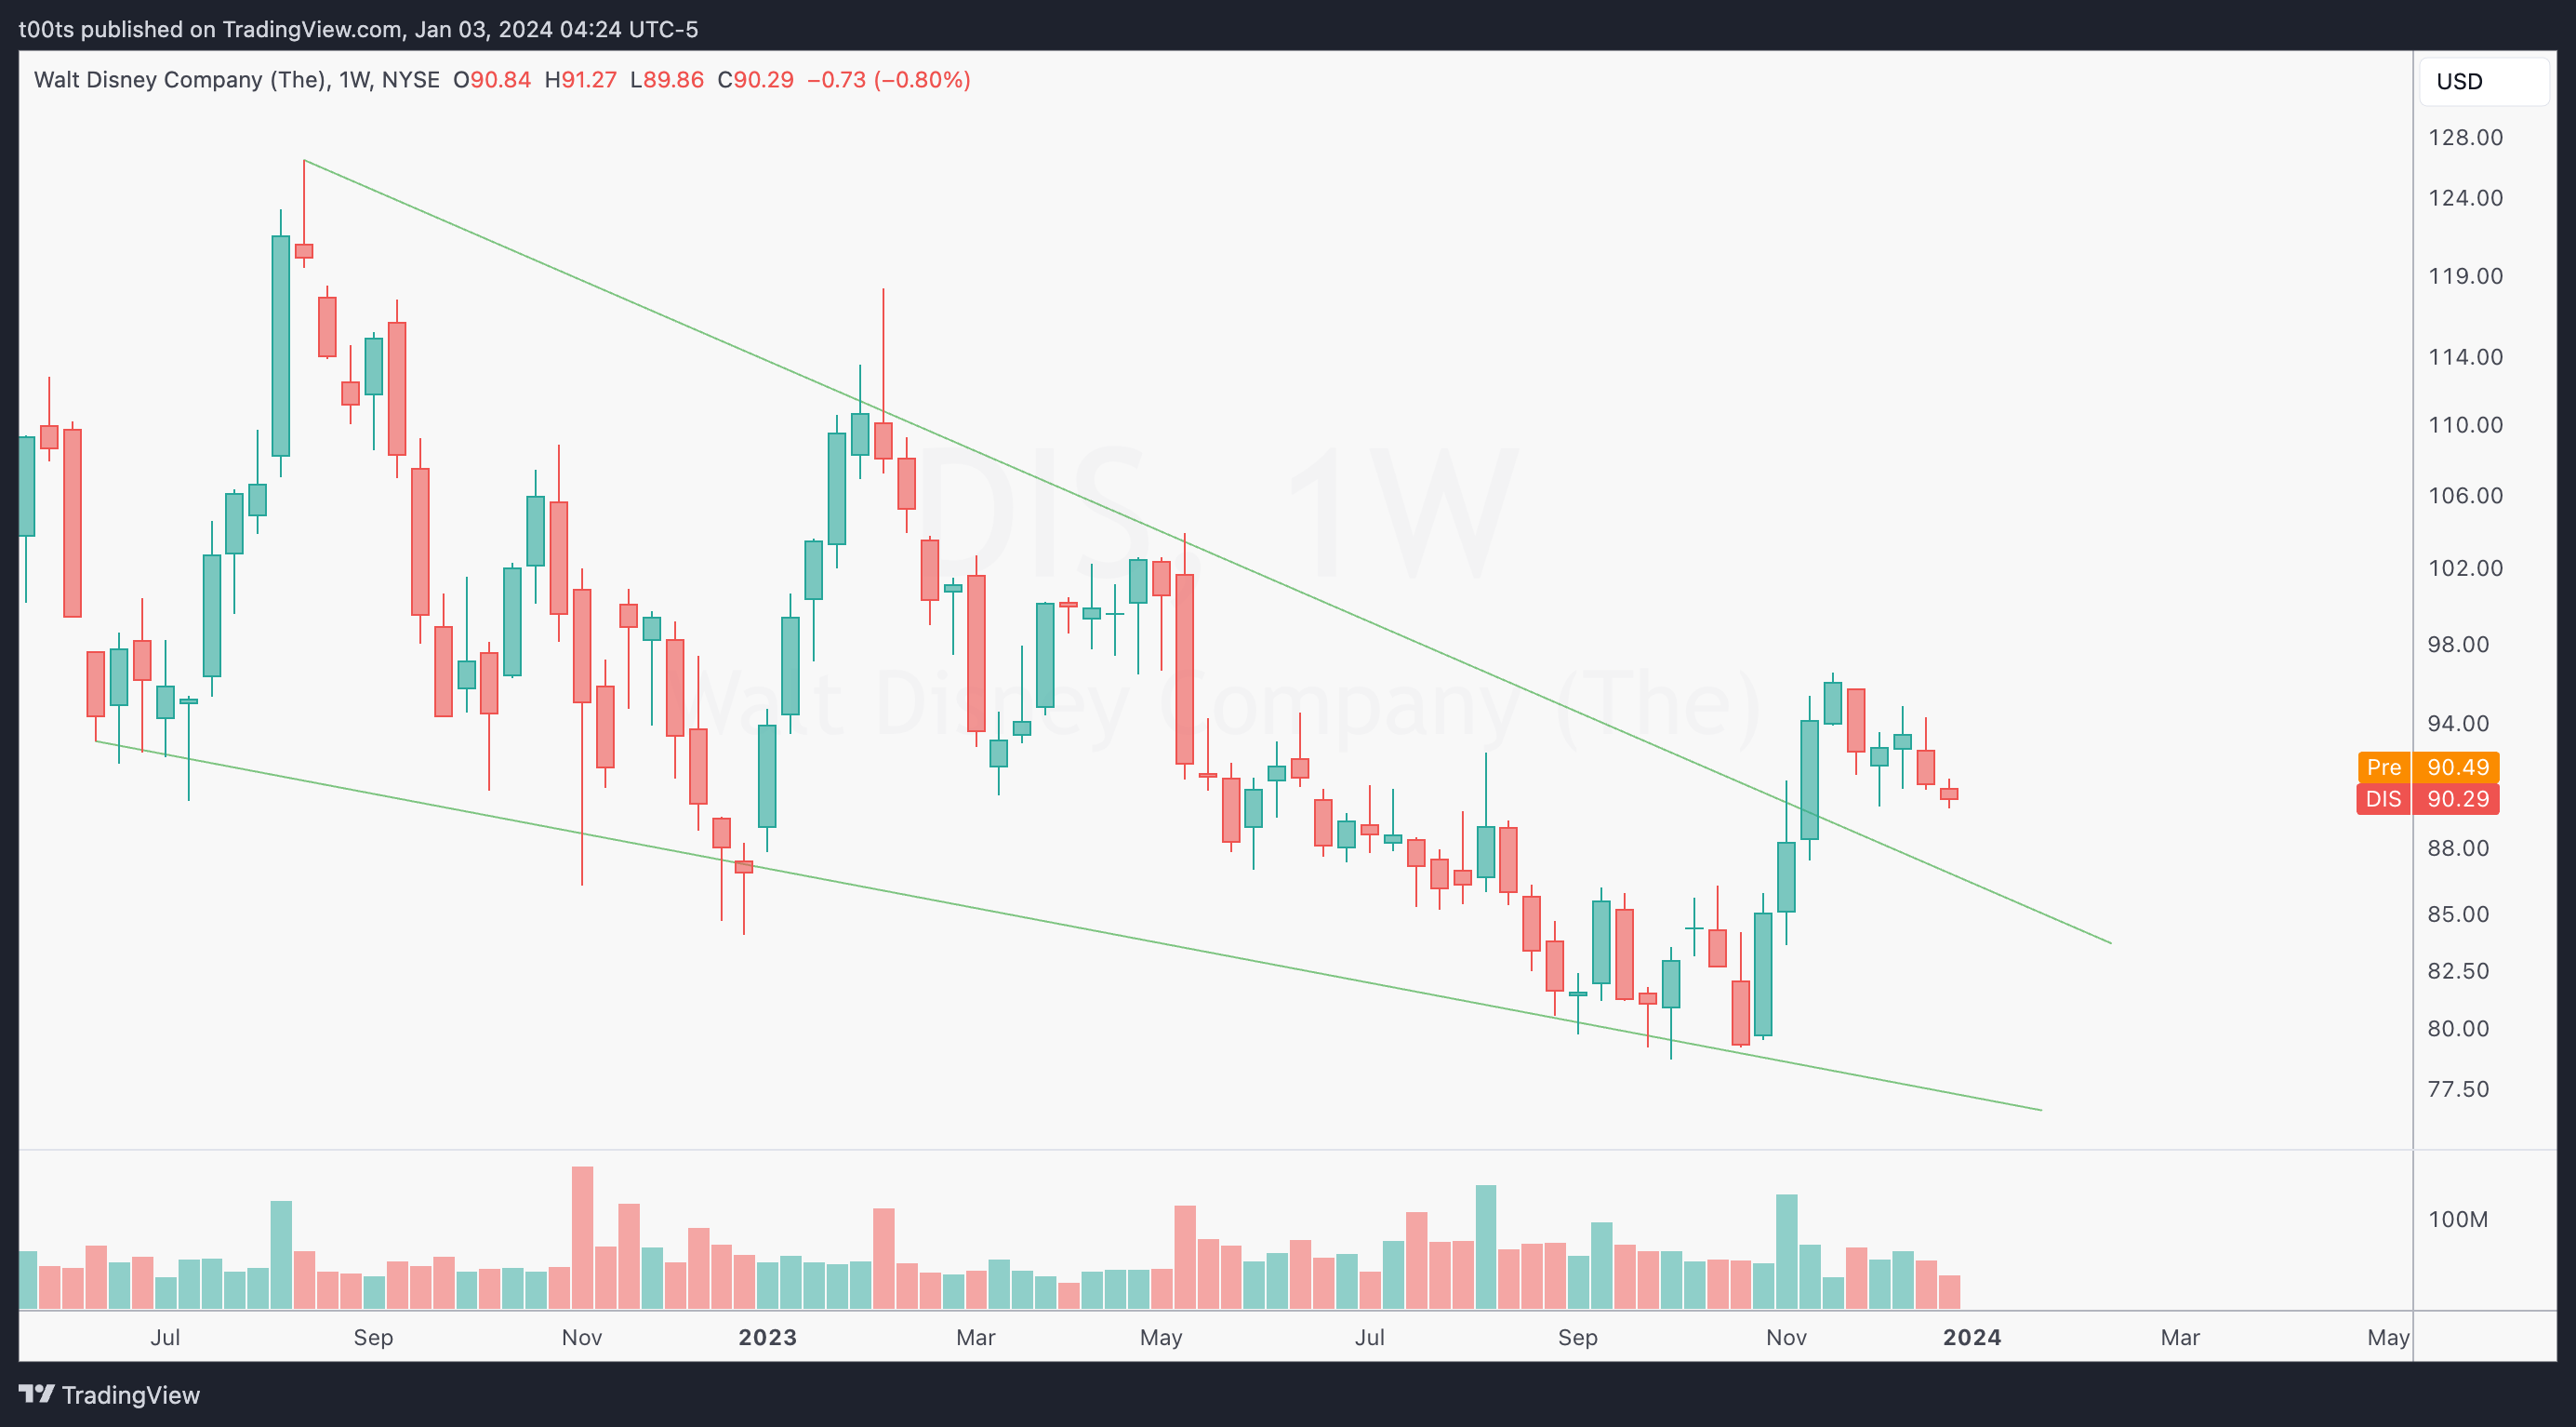
Disney’s weekly chart is beautiful. Regardless of where you draw your trend lines, the point is taken. Price has been forming a massive descending wedge for over a year, which we just recently broke out of. Consolidation is now underway and unless some external catalyst comes into play, the reasonable expectation is for another leg up to take place.
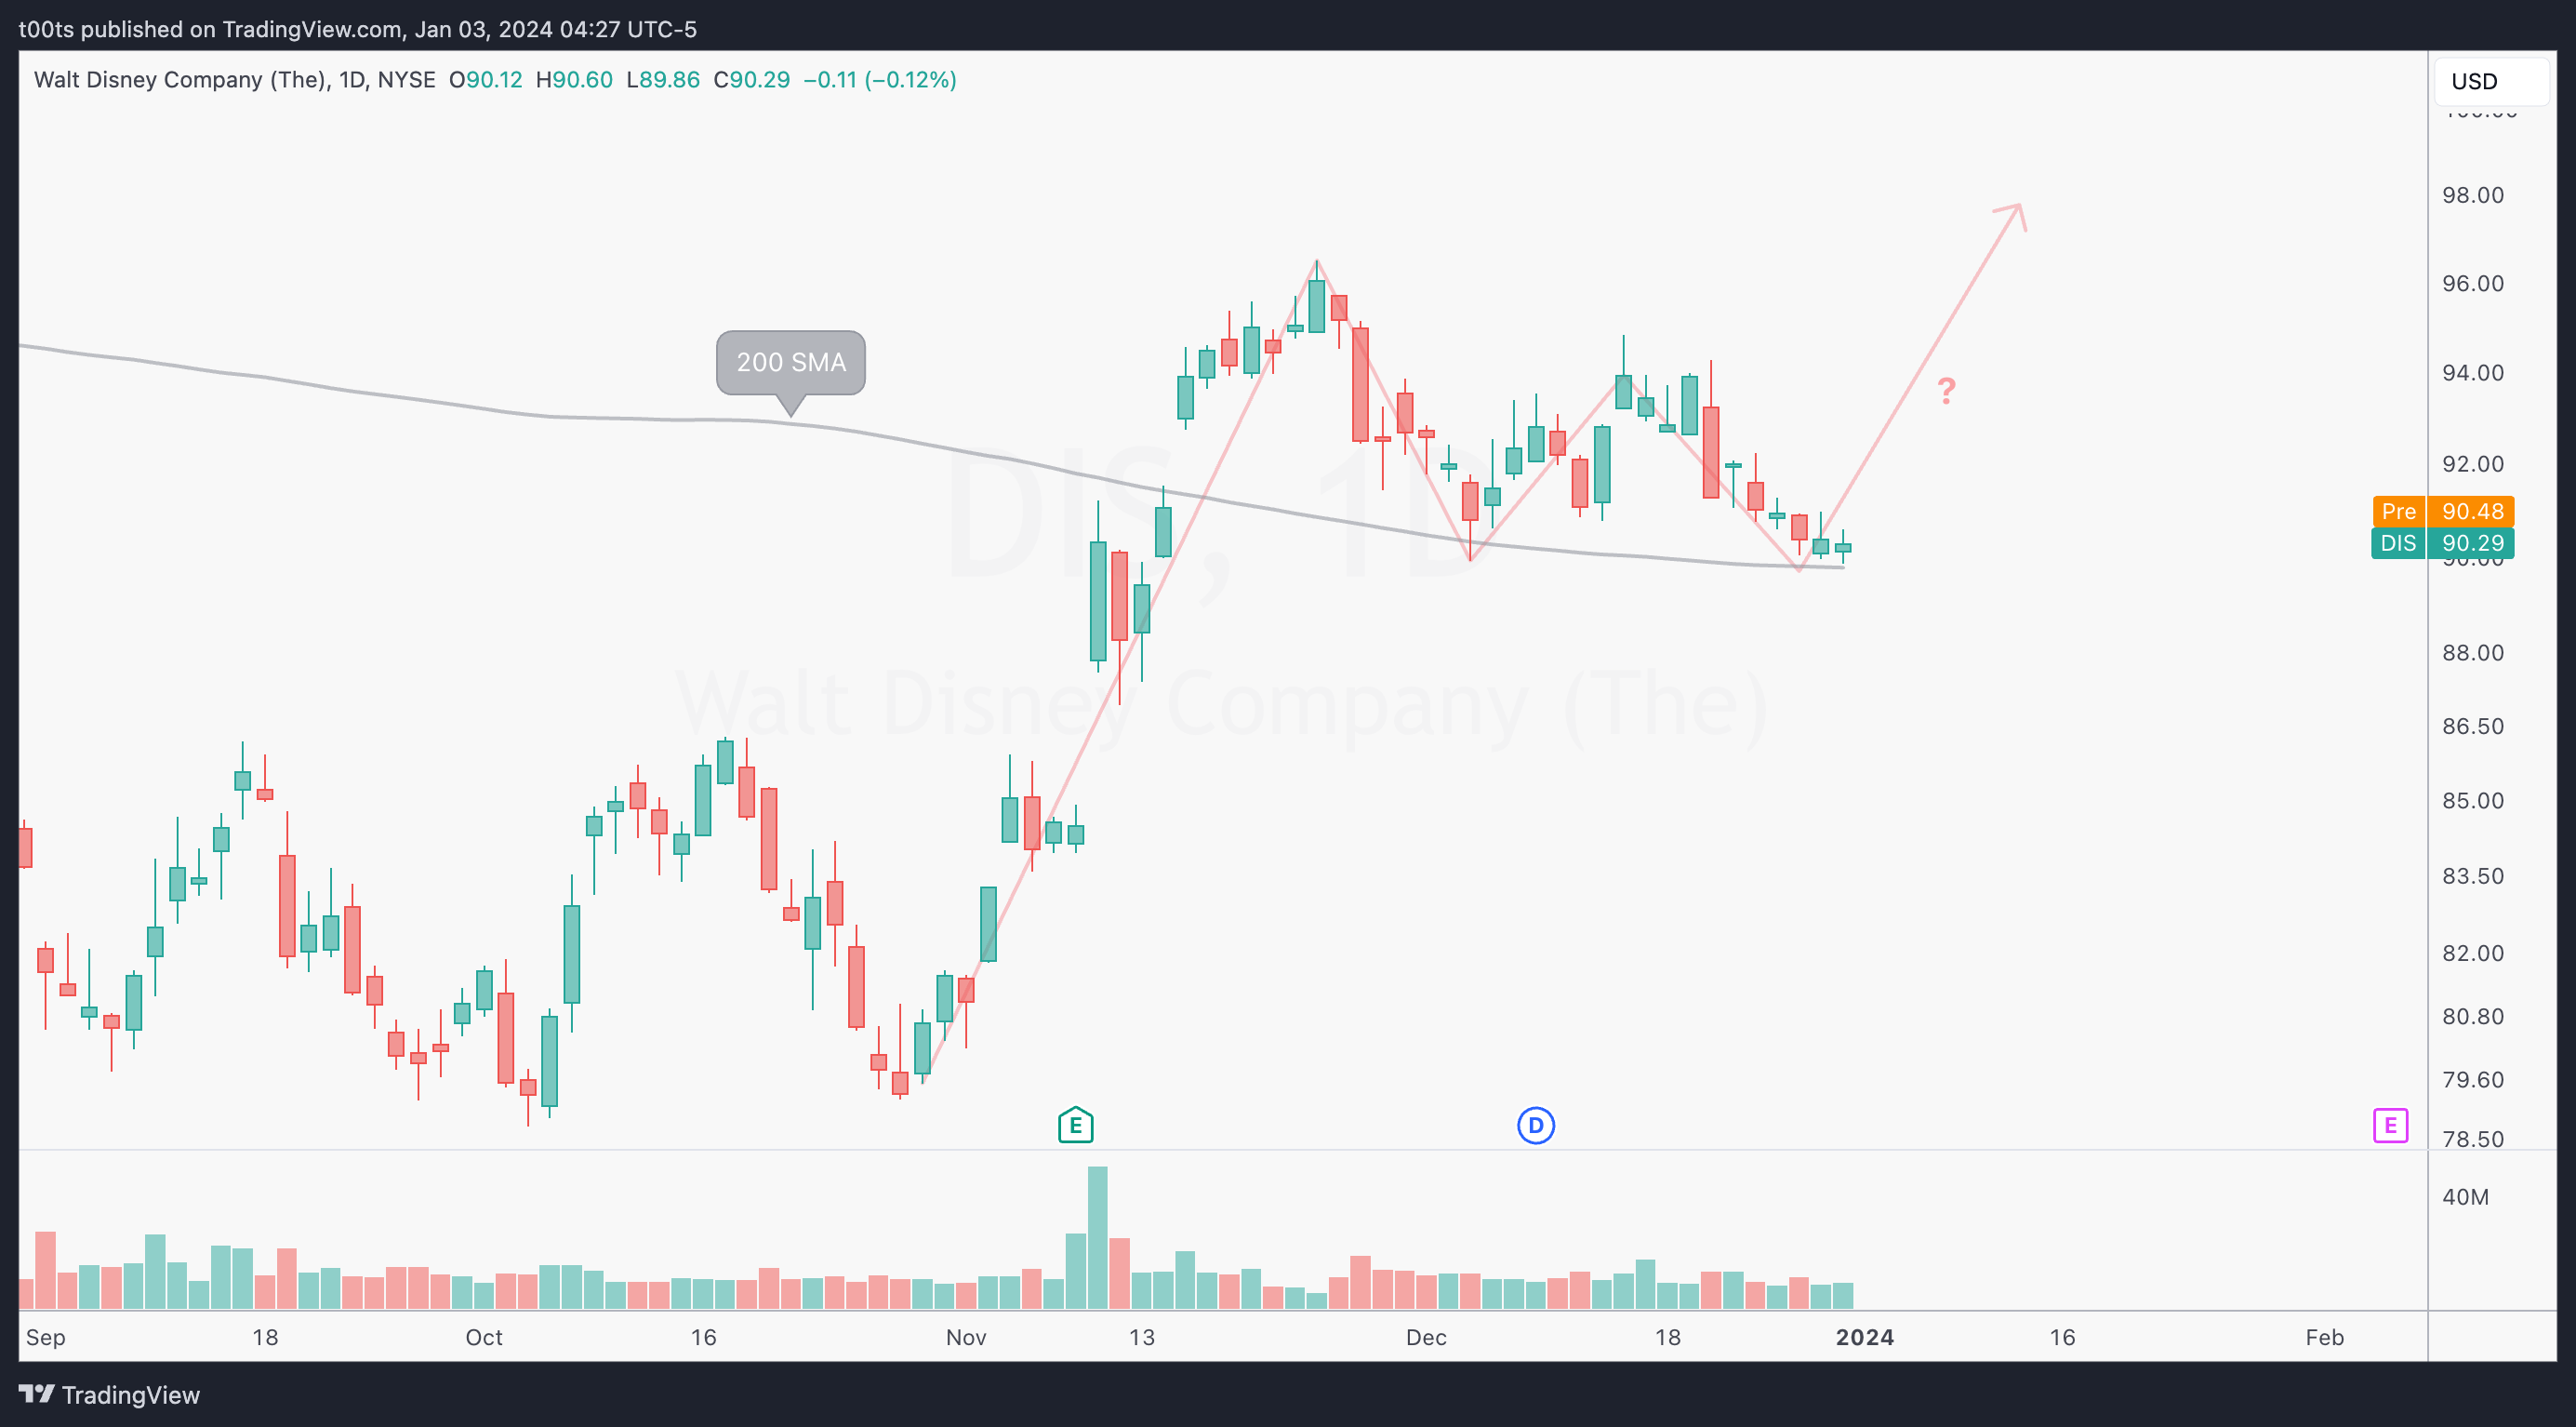
On the daily chart, we can see a classic two-legged pullback after a strong move up. Price is currently sitting right on top of the 200 simple moving average, which is well-known for acting as a strong support level (or resistance when price is below it).
Weekly chart
Daily chart
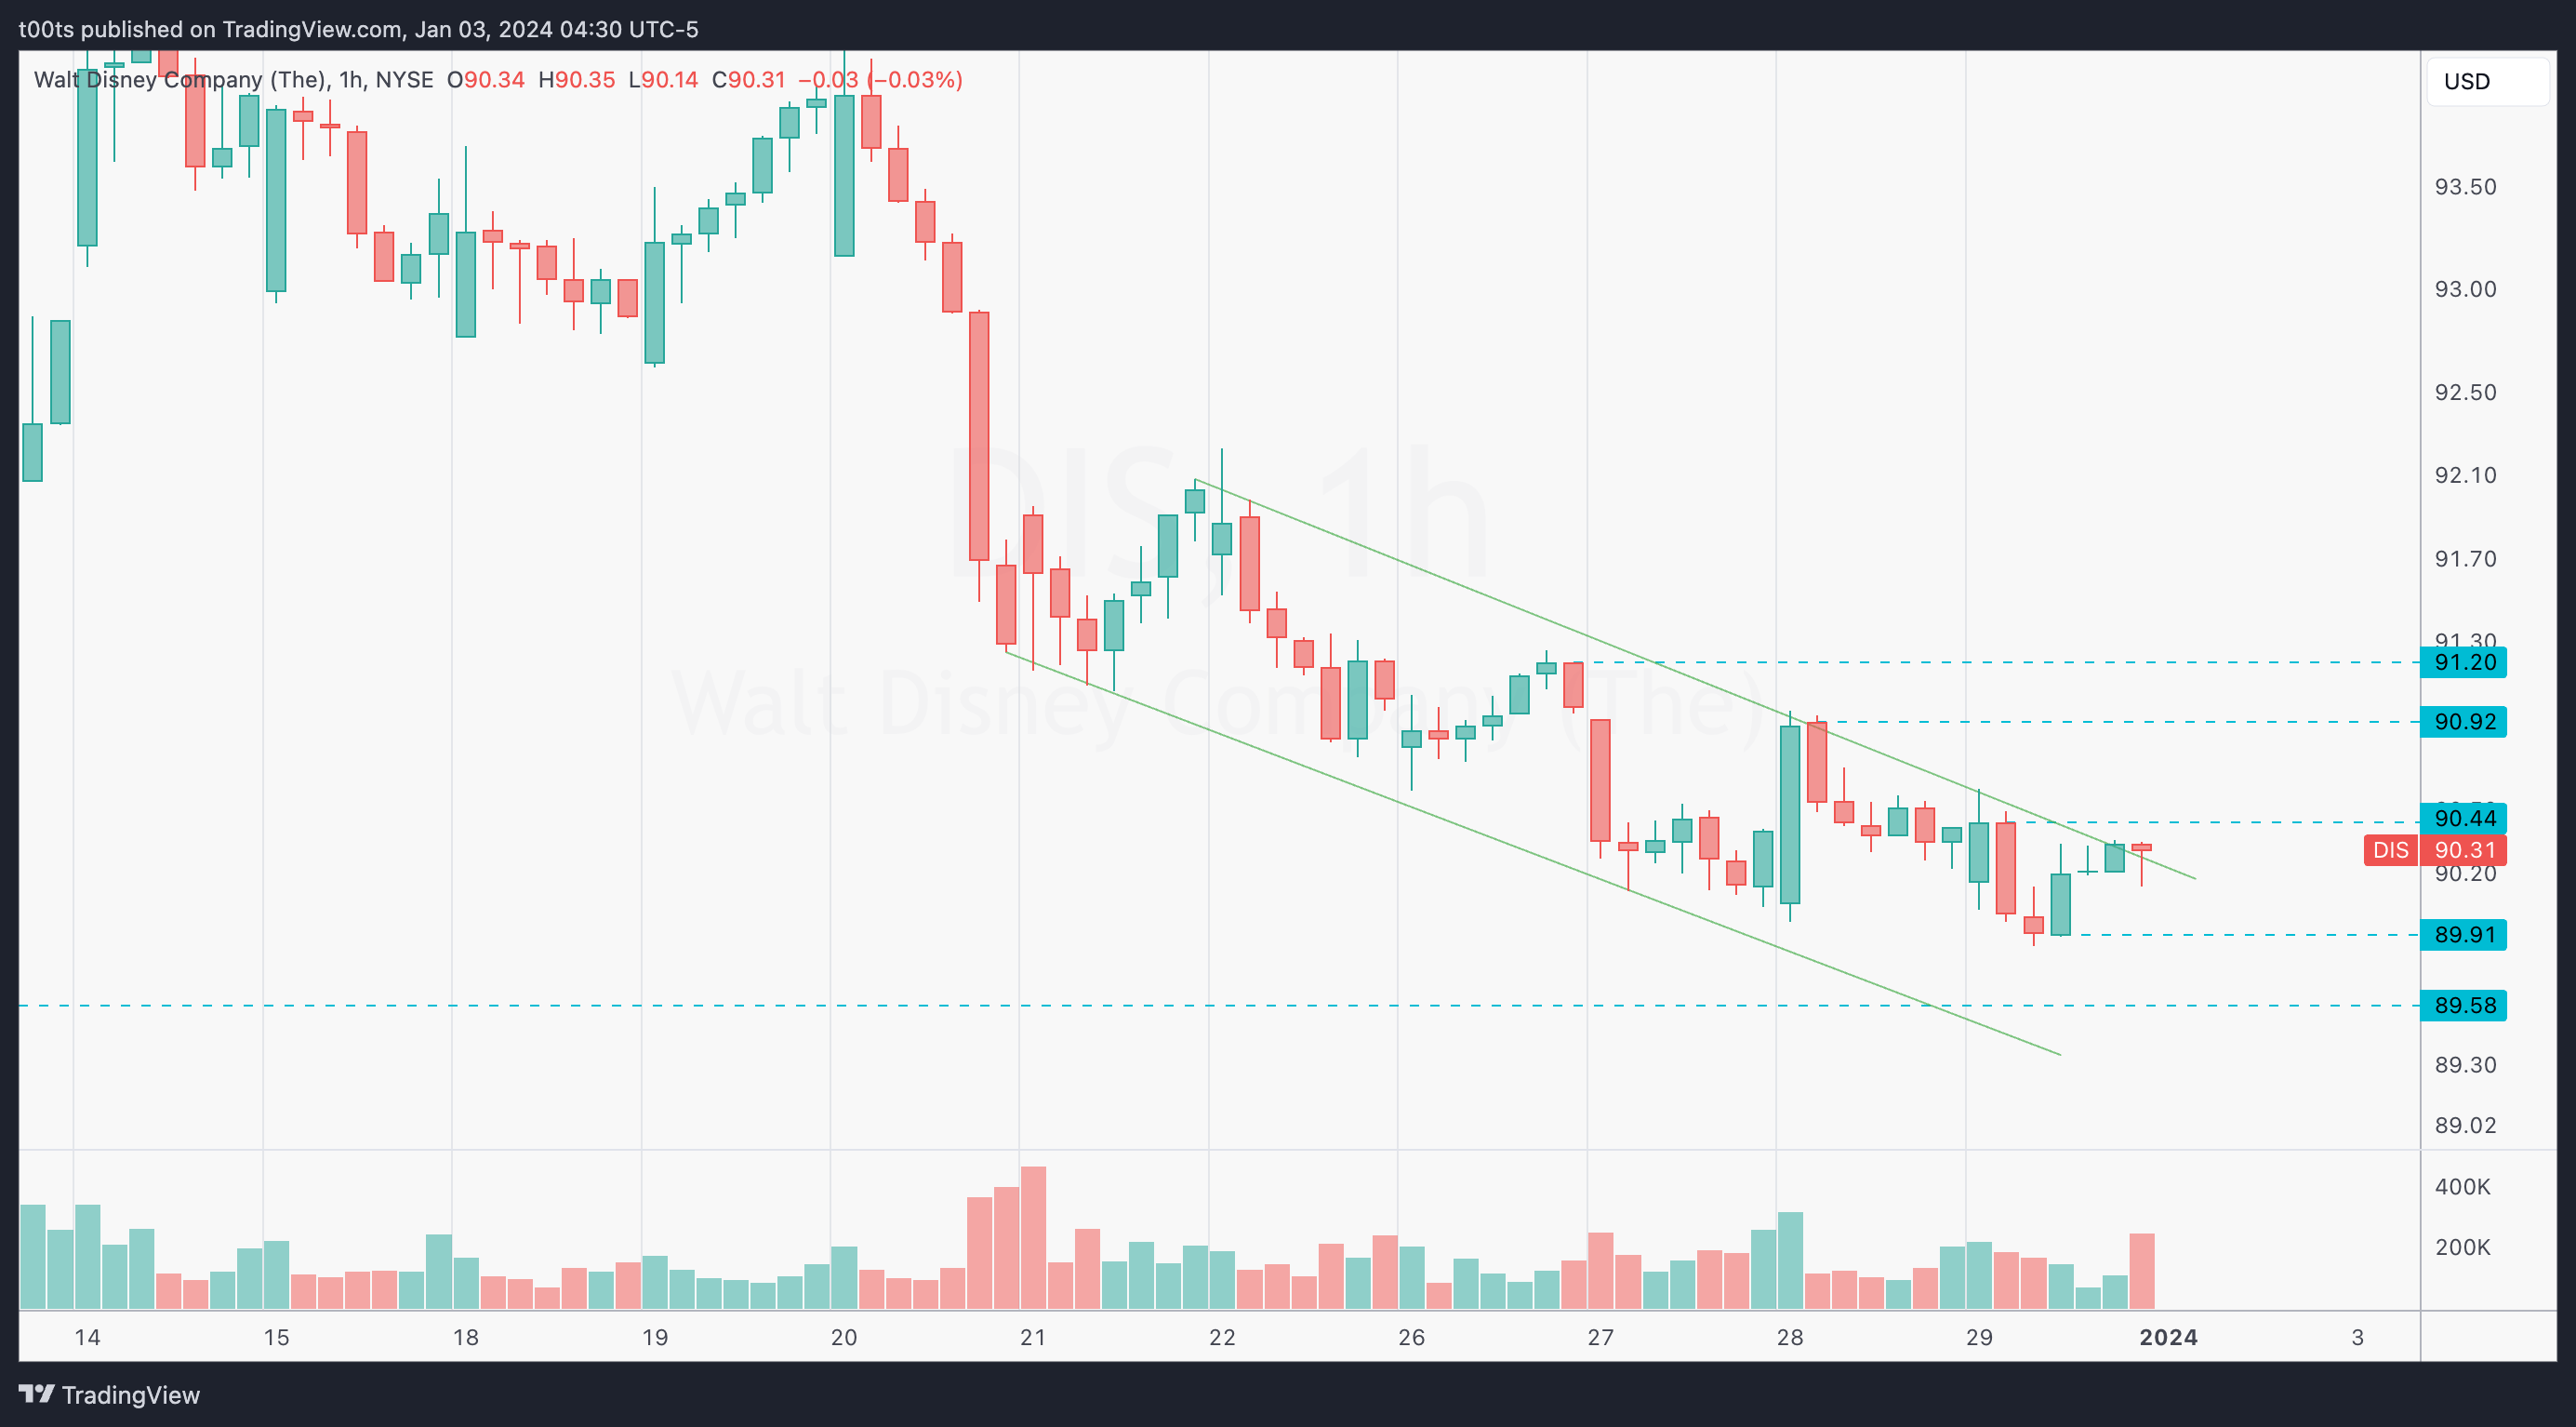
Hourly chart
The hourly chart shows a descending channel. Past few days have been a little bit rangy, but there's no question this is a downtrend. Personally, what catches my eye here is that on this last trading day sellers failed to create a new significant low. As soon as price breached the previous day low, buyers quickly bought into the closing bell, denoting a potential bottoming.
Pre-market action
Pre-market action was irrelevant. I didn't consider it to take the trade.
The trade
I actually announced this trade on 𝕏. I don't do it often, but this one I really liked. I first said I was looking at it, and immediately got involved and posted my entry.
Why DIS though? Let's explore the details. As usual, I'll use my CPT Framework:
Cue
Weekly bullish structure
Daily chart at potential lows of pullback's second leg
Daily chart sitting on top of 200 SMA
Intraday cue!
Before we go into Plan and Trigger, what was that Intraday cue?
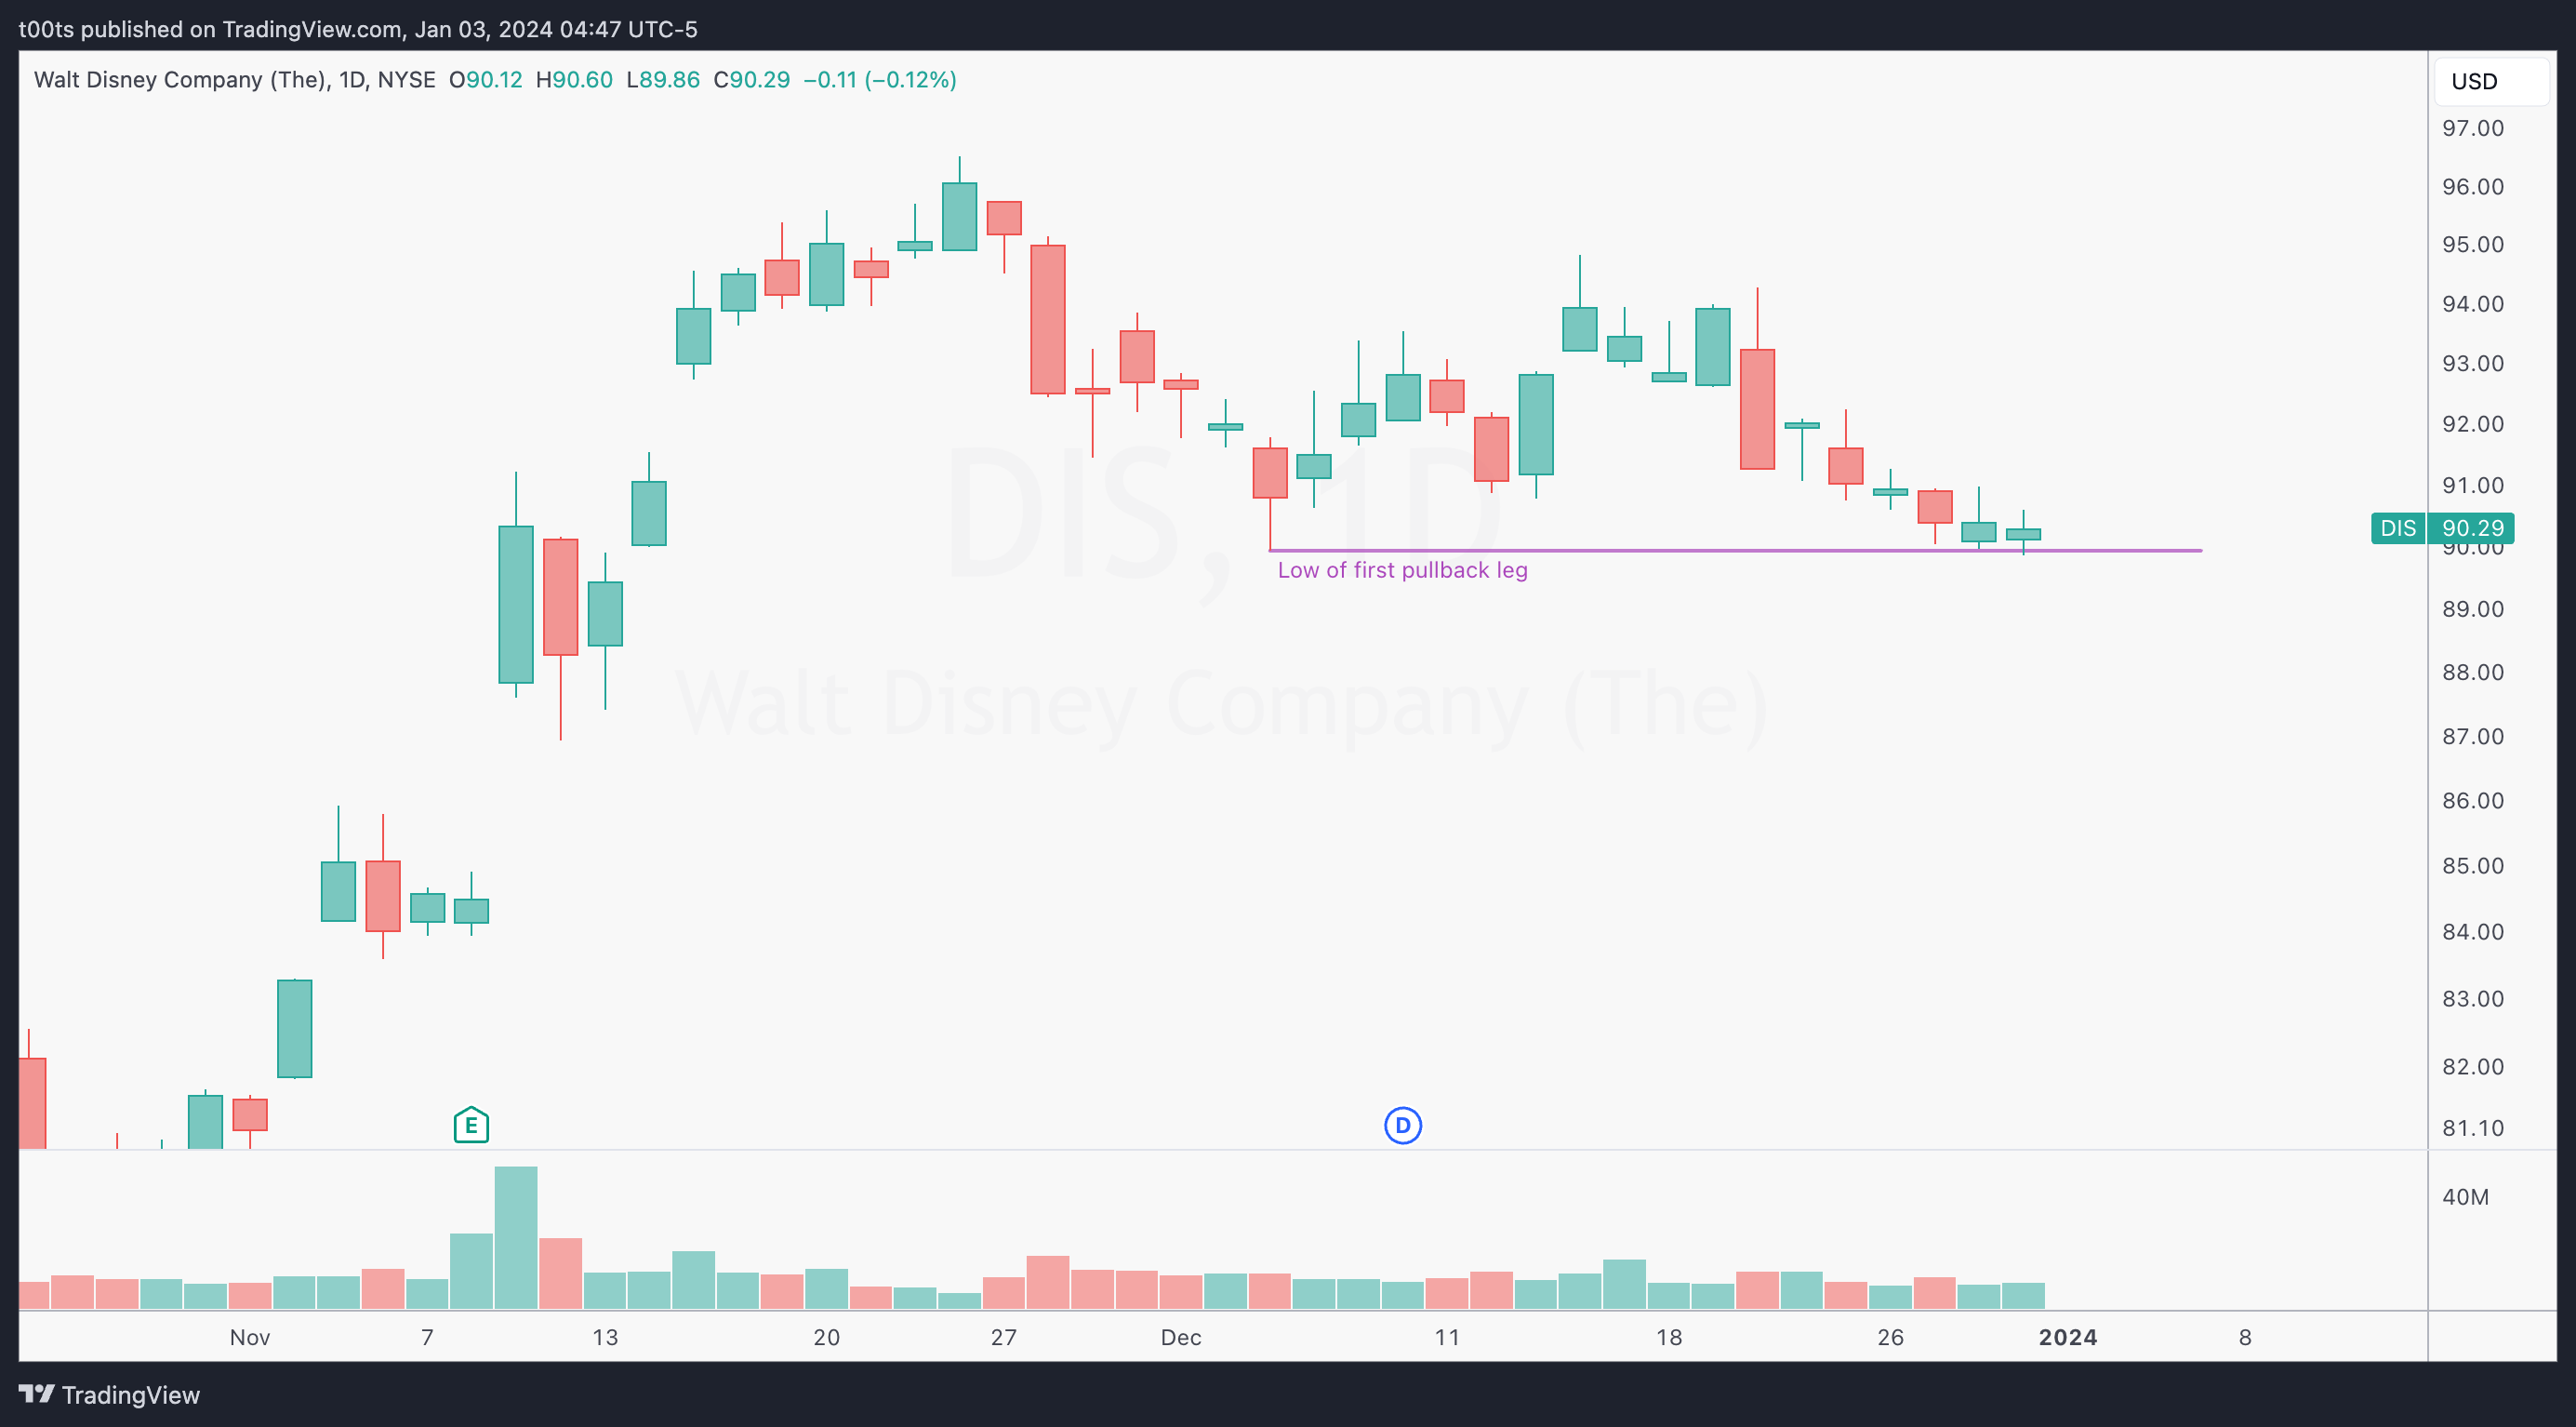
Let's pull up a clean daily chart for a second. I want to bring something to your attention:
Now let's look at an intraday 5m chart at the time I was looking at the trade:
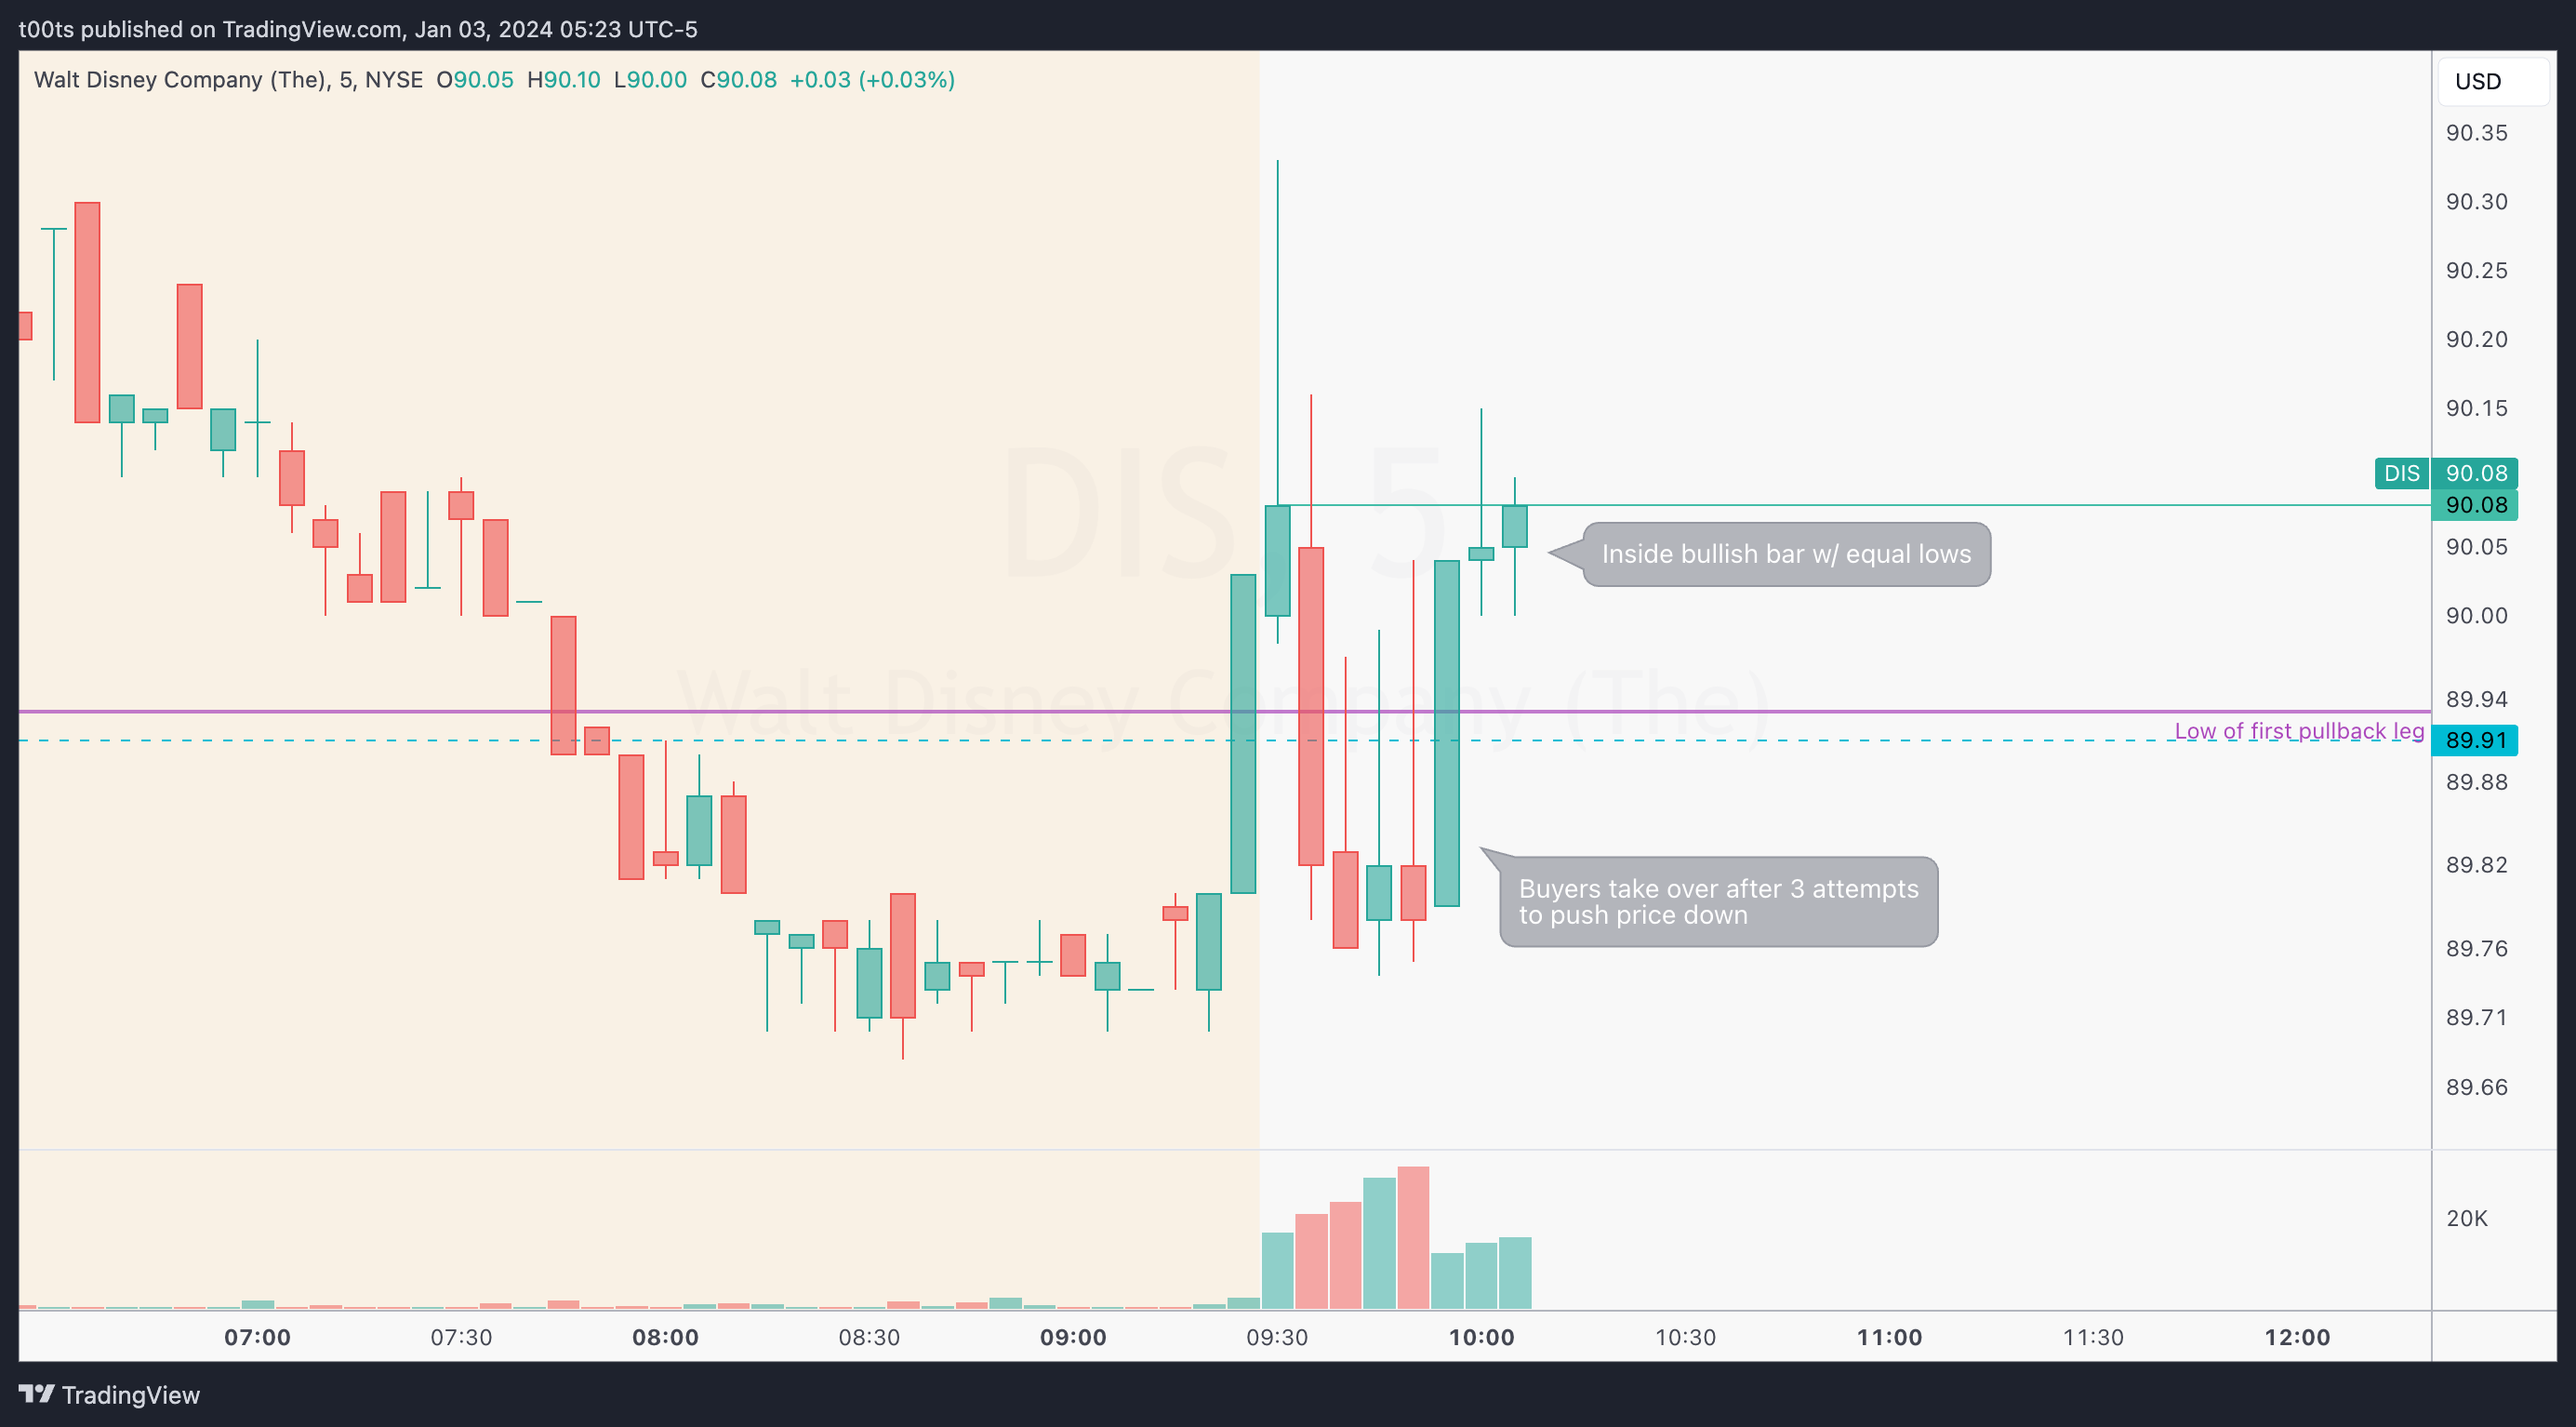
Look at how sellers tried to take price down, 3 times with huge volume, and just like that, buyers take over. Look at the confluence area between the $89.91 level and the low of the first daily pullback leg. The moment buyers took over, I had enough cues and it was time to make a plan. (Side note: Futures traders often call this a liquidity sweep. Fair enough.)
Plan
Simple: Look for price to get above the opening print and risk against the lows of the signal bar.
Trigger
Price breaking the highs of the bullish inside bar, which becomes the signal bar.
5m chart (First target)
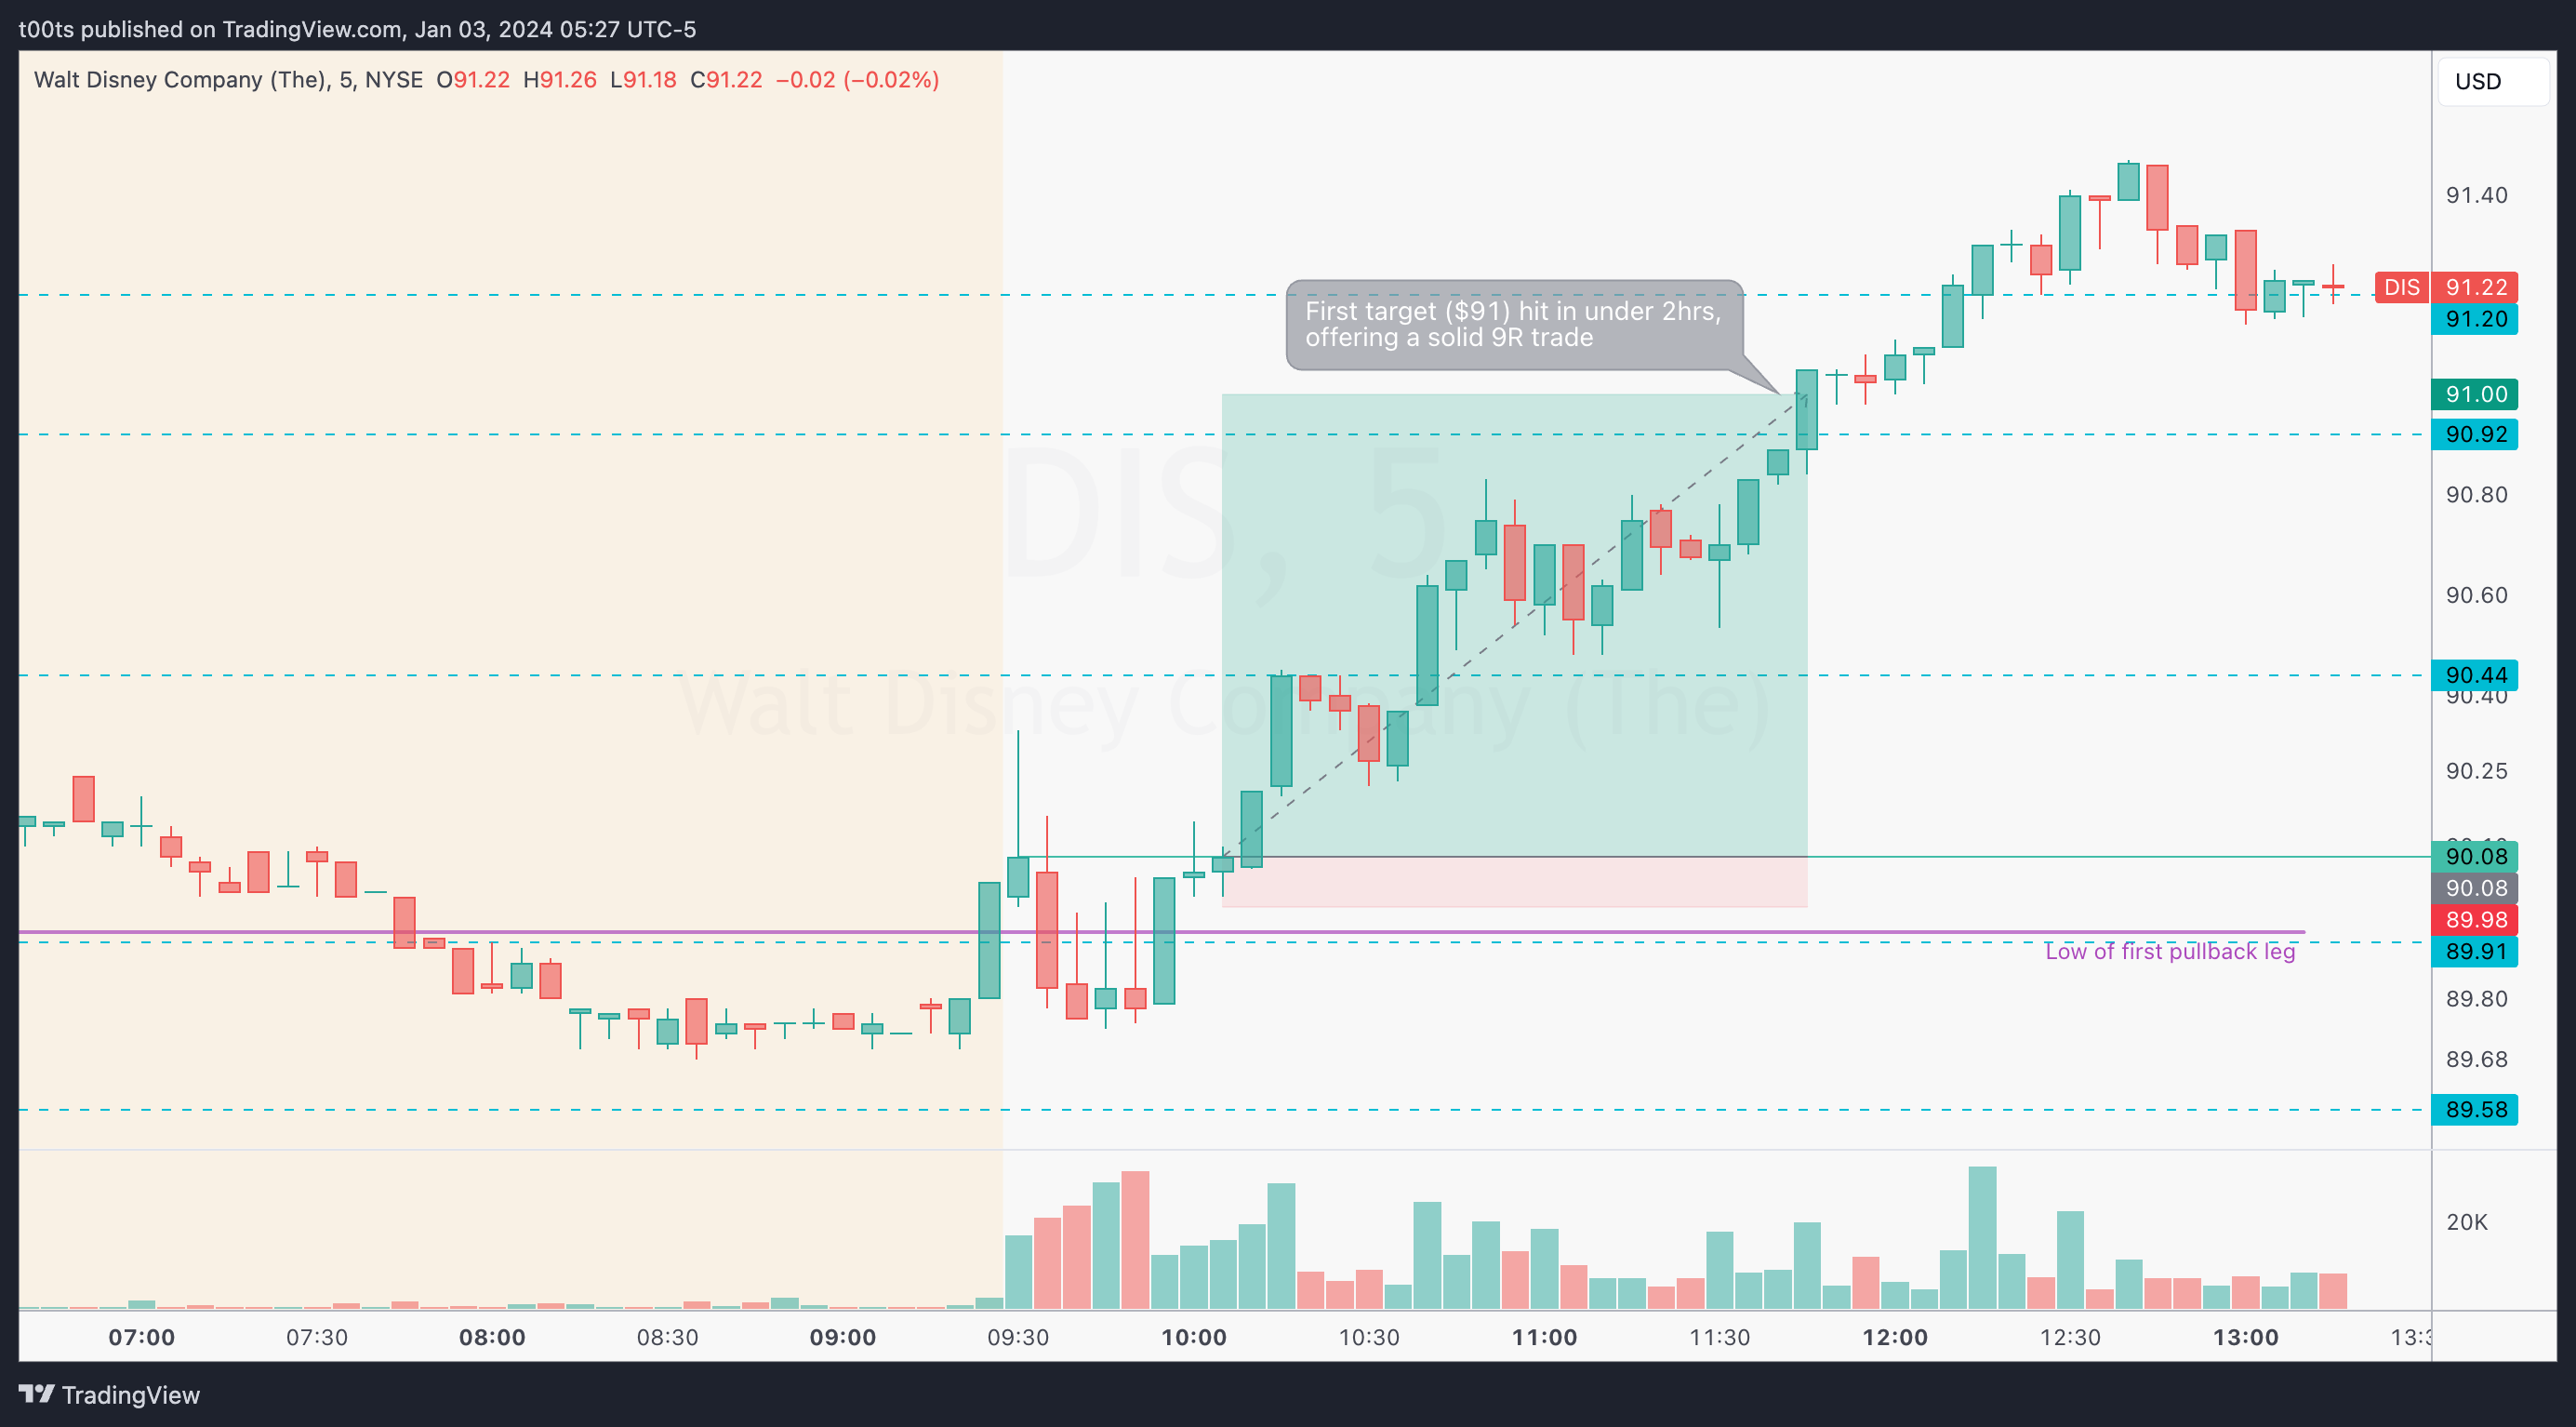
All major names are deep in the red, adding further losses into the already notable gap down we saw in the overall market. Despite that, Disney trends up cleanly after our entry, hitting our first target within 1h40m and offering a 9R trade right off the bat.
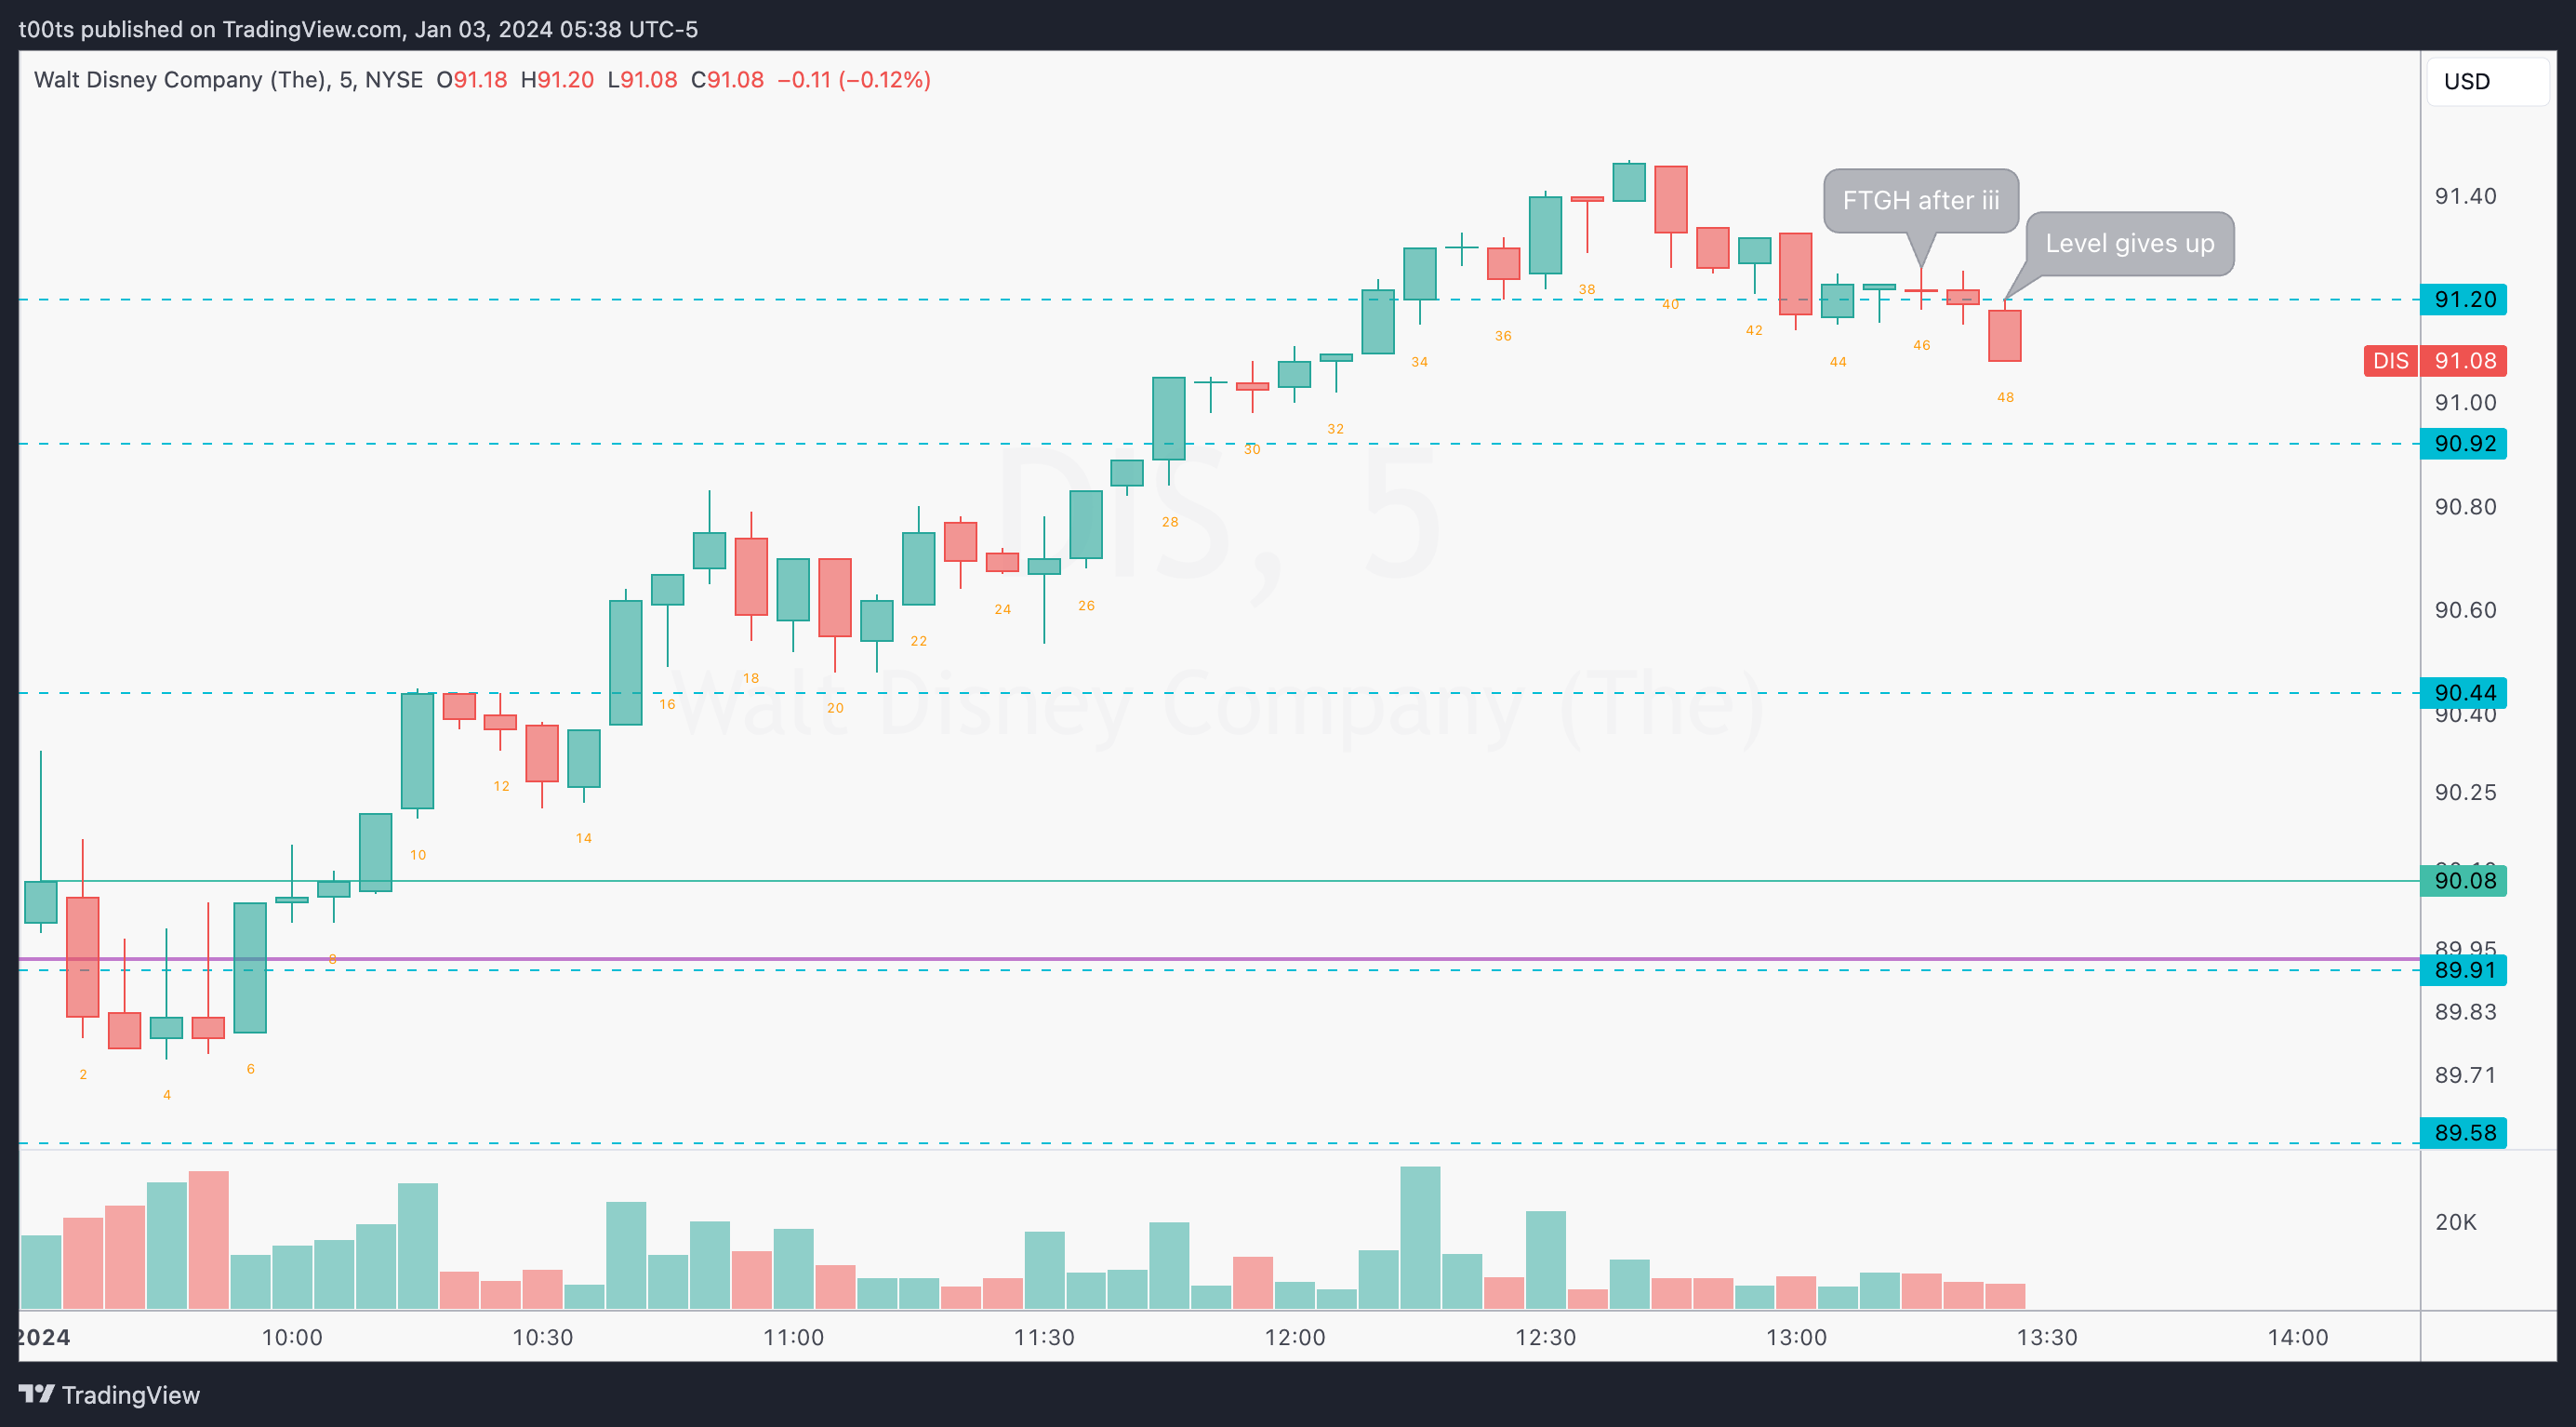
Riding the rest of the position
“Let your winners run”. Such a classic. How could we approach this here?
The first red flag that the trend might end is when price fails the $91.20 level as shown in the chart below. After a bullish reversal triple inside bar pattern, bar 46 fails to move higher, and weakness follows, leading us to eventually fail the level. You might want to get out there.
For further confirmation, you can use an EMA (Exponential Moving Average). I'm using a 20 EMA in this chart, and not surprisingly both signals align. So we now have two confirmations to exit our runners.
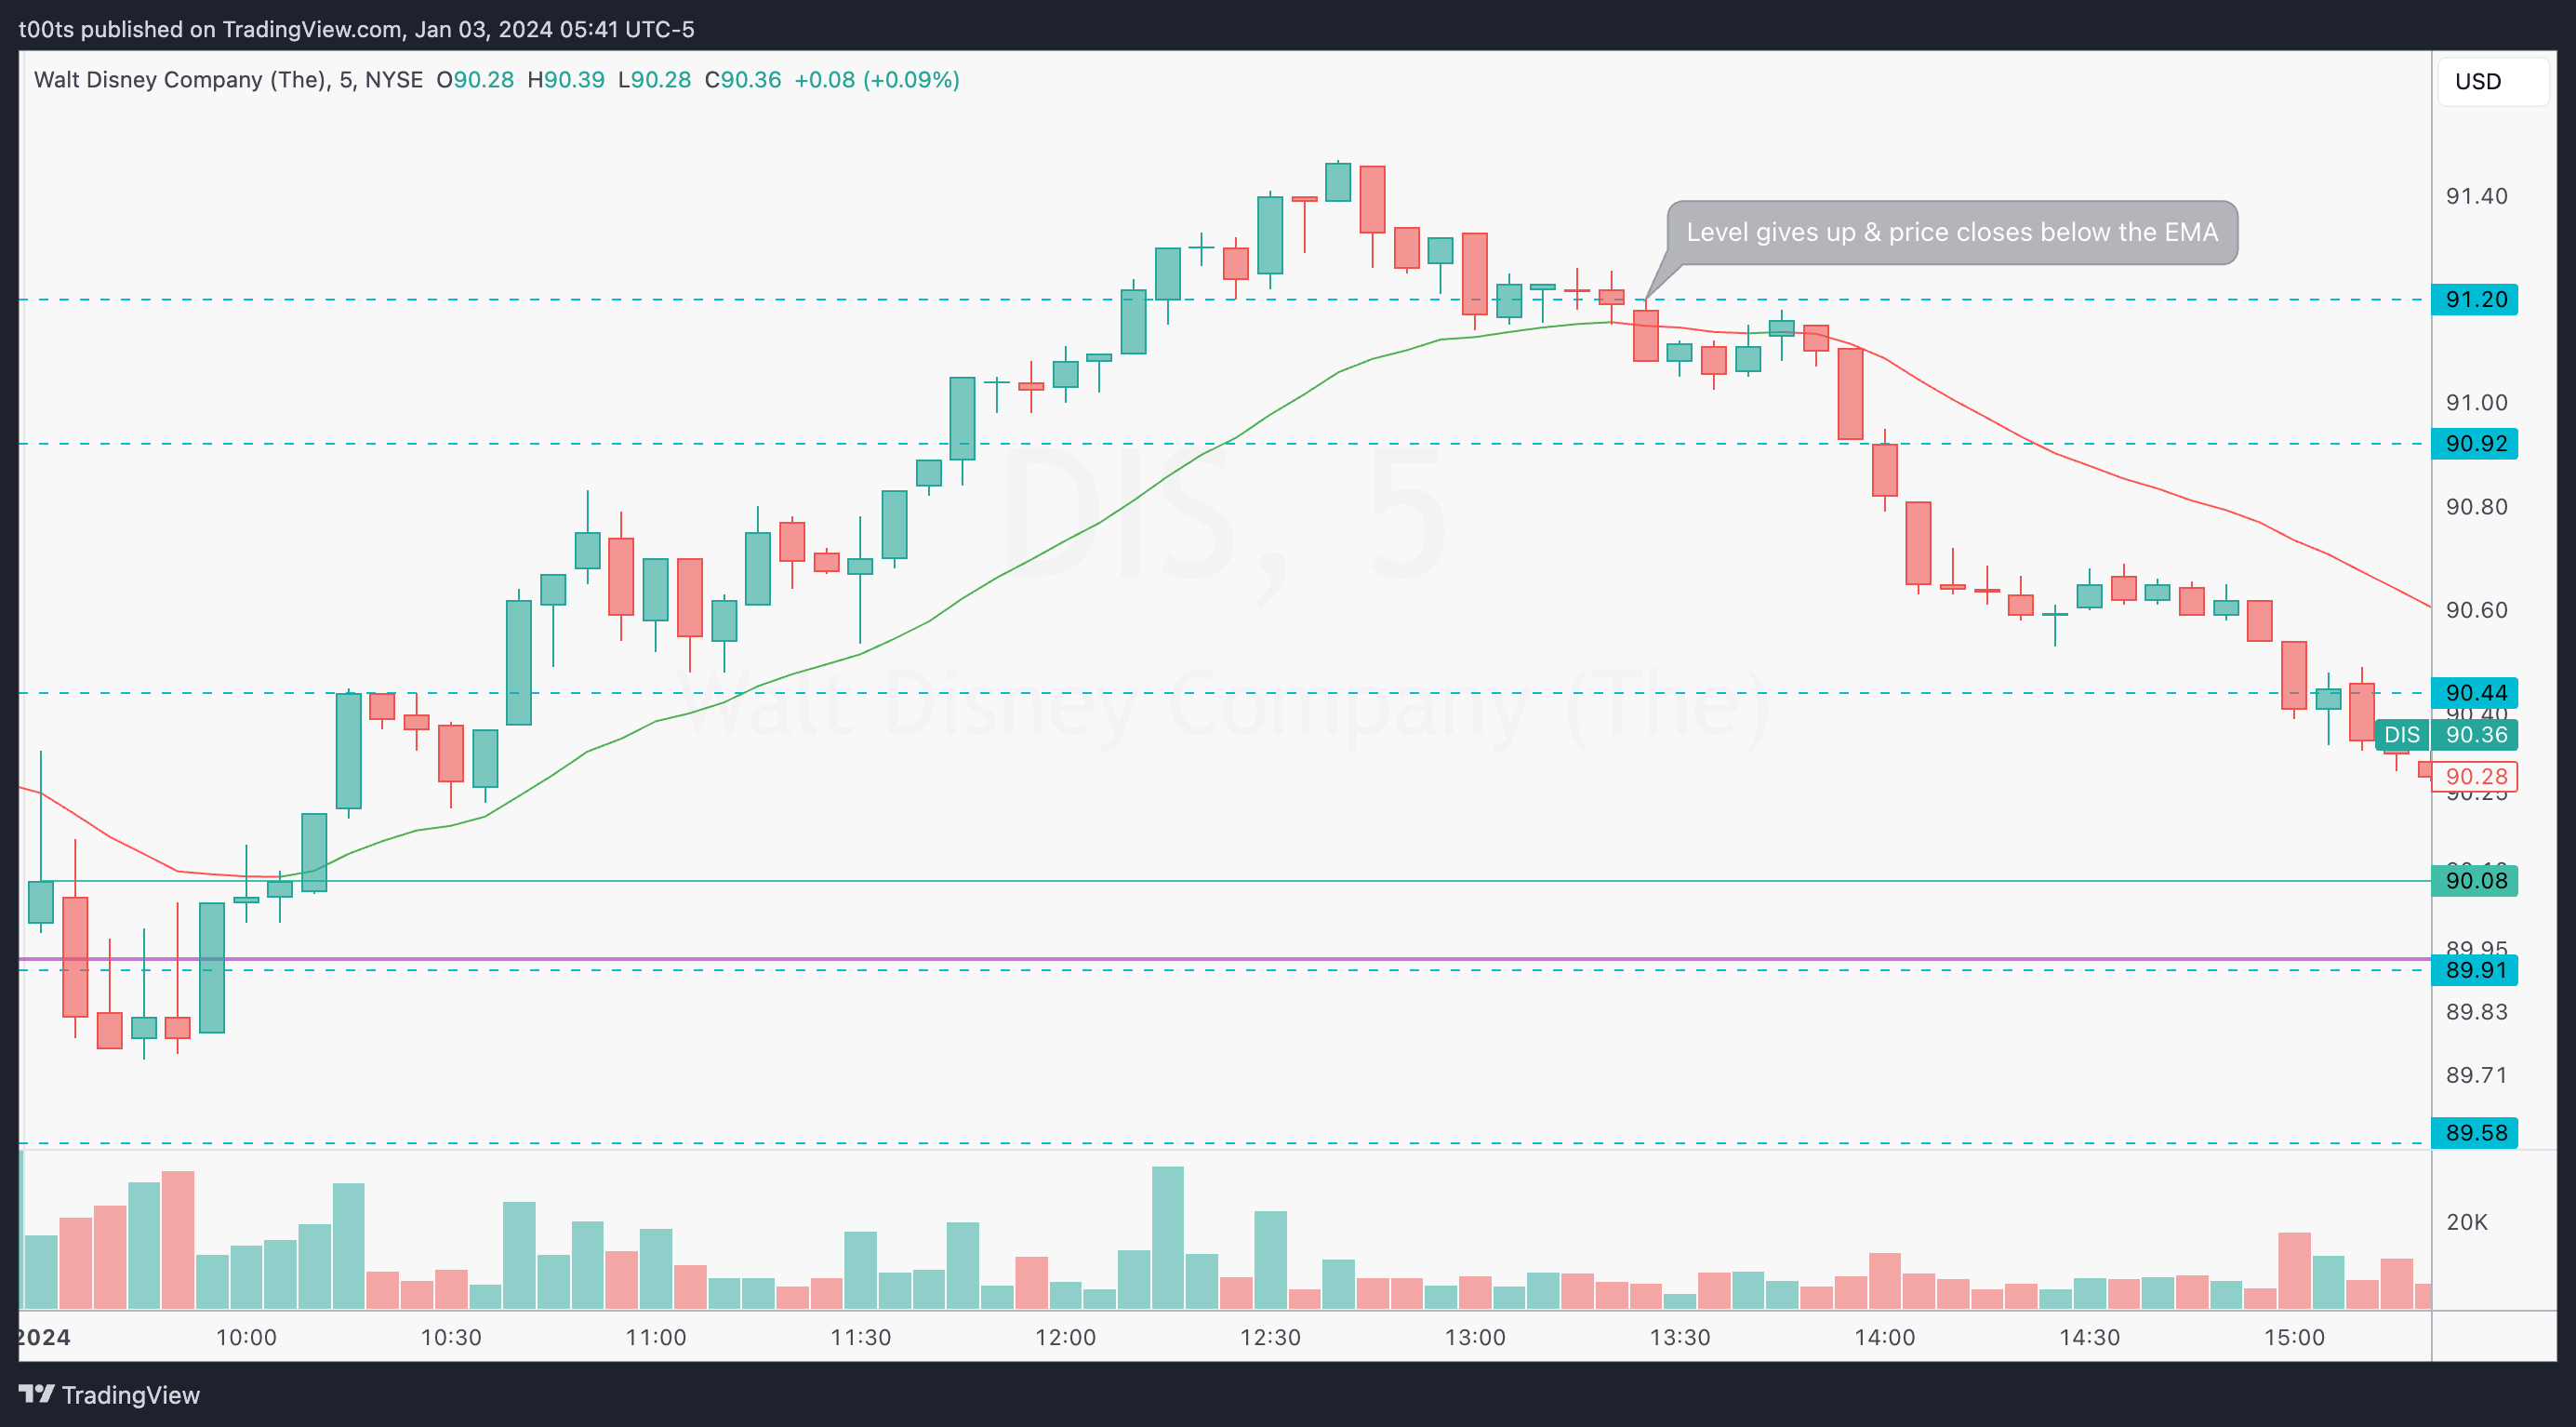
I chose to color it green when price is above it and red when price is below for it to be even clearer. One could also use this as an entry filter. Here's the PineScript code in case you're interested:
//@version=5
indicator("Trend EMA", overlay = true)
len = input(20, "Length")
ema = ta.ema(close, len)
plot(ema, "EMA20", close > ema ? color.green : color.red, 1, plot.style_line)
Closing notes
This was a fun trade to start the year.
Full disclosure: I am swinging my position, so I'm keen on watching what happens the coming days. The market did start the year on a bit of a downturn, so the conditions aren't very favorable. But I chose to stick with it because my overall thesis came from the Weekly and Daily charts. The intraday cue just offered an entry. We'll see if DIS can pick up into the week or the market drags it down with it.
I am posting one trade writeup every day throughout 2024. I focus on large caps using levels and price action. The subscription is absolutely free and will always be. I will strive to provide value by offering clues and ideas for you to enhance your edge. Let’s grow together!
Thanks!