
Disney (DIS) - Jan 13th 2024
Identifying and trading relative strength after a hot CPI print

Higher timeframe context
It's been a while since we last went over Disney.
They recently had their Q4 earnings release and judging by the markets reaction, it seems that investors liked announced. Disney reported a beat on EPS and their revenue fell in-line with estimates.
They’ve lost some subscribers in their core streaming product Disney+ due to price hikes, however, they're now making more money from those who stayed and any new customers that join. So that’s a win.
They're also doing well on a bunch of cost-cutting measures they announced last year, which they plan on continuing moving forward. We know how much investors love cost cutting. Remember META's recent earnings?
Let’s jump into the trade.
Weekly chart
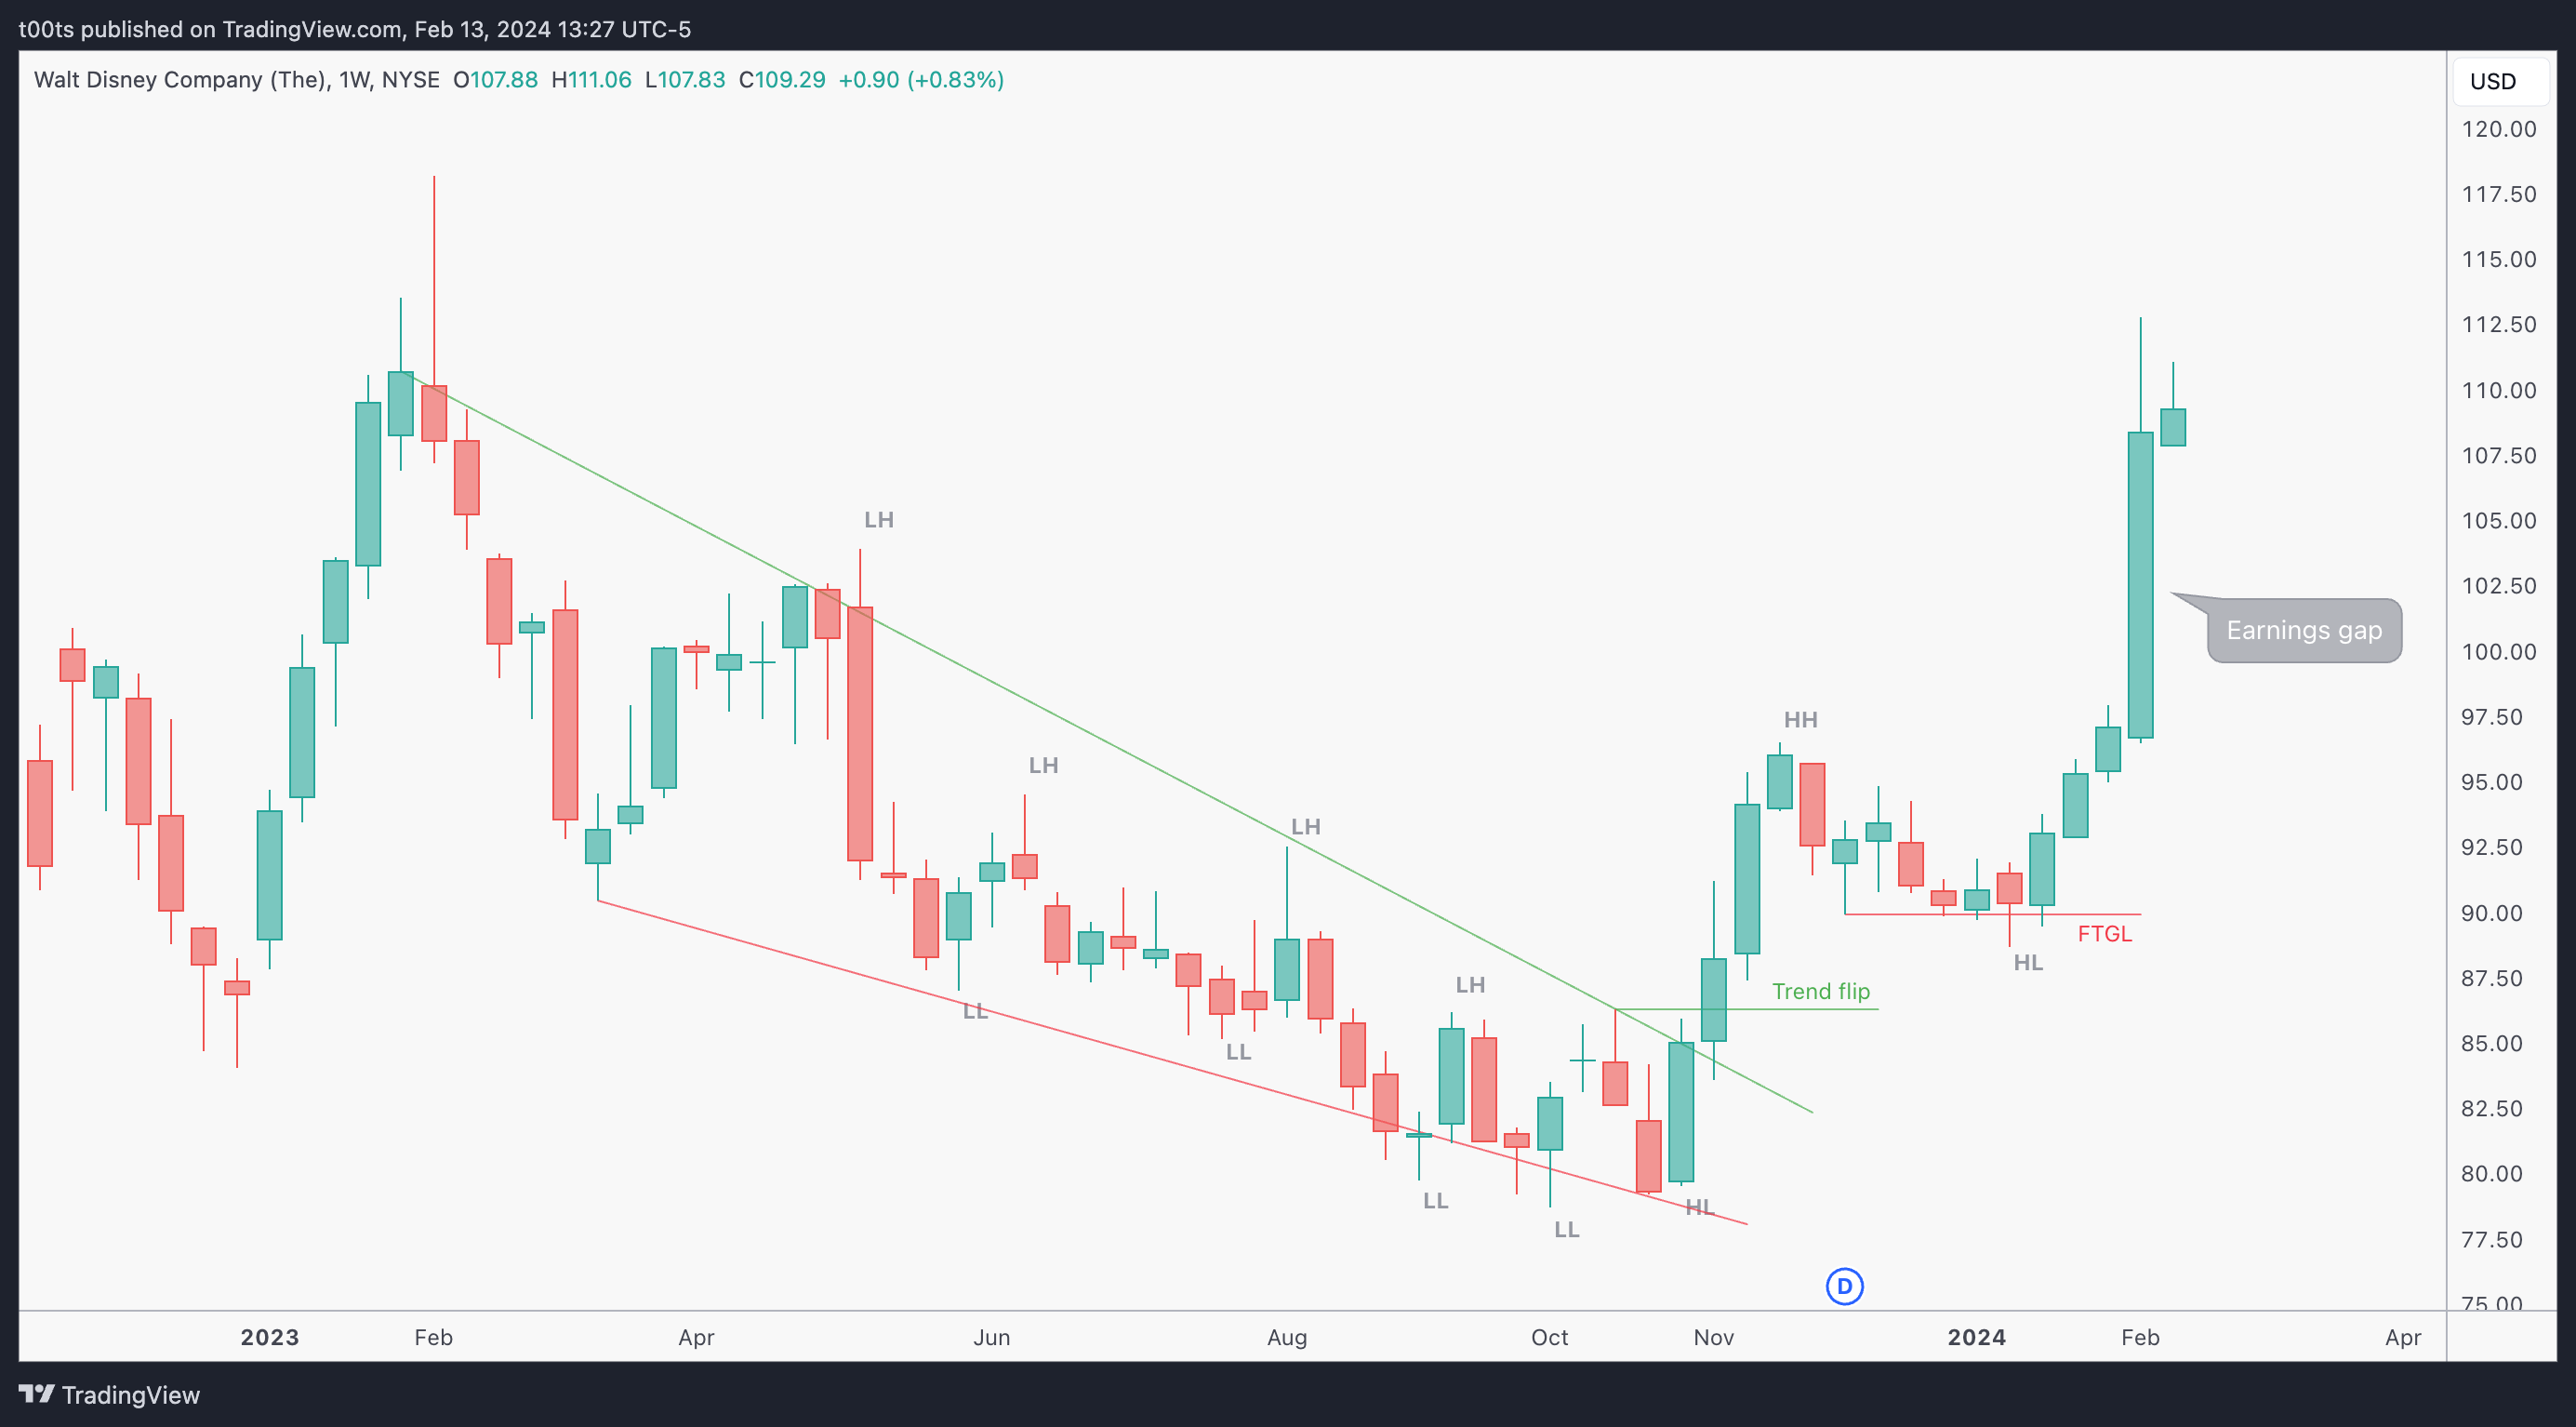
This weekly chart is as bullish as it gets. This leg we're currently in is arguably overextended but we should all agree there's no point in even thinking of shorts.
Price broke the long multi-month descending wedge, flagged nicely for 7 weeks, even giving us a few failures to the downside, and resumed the uptrend. The previous week monster candle is due to an earnings gap we'll be able to appreciate on the daily chart.
Daily chart
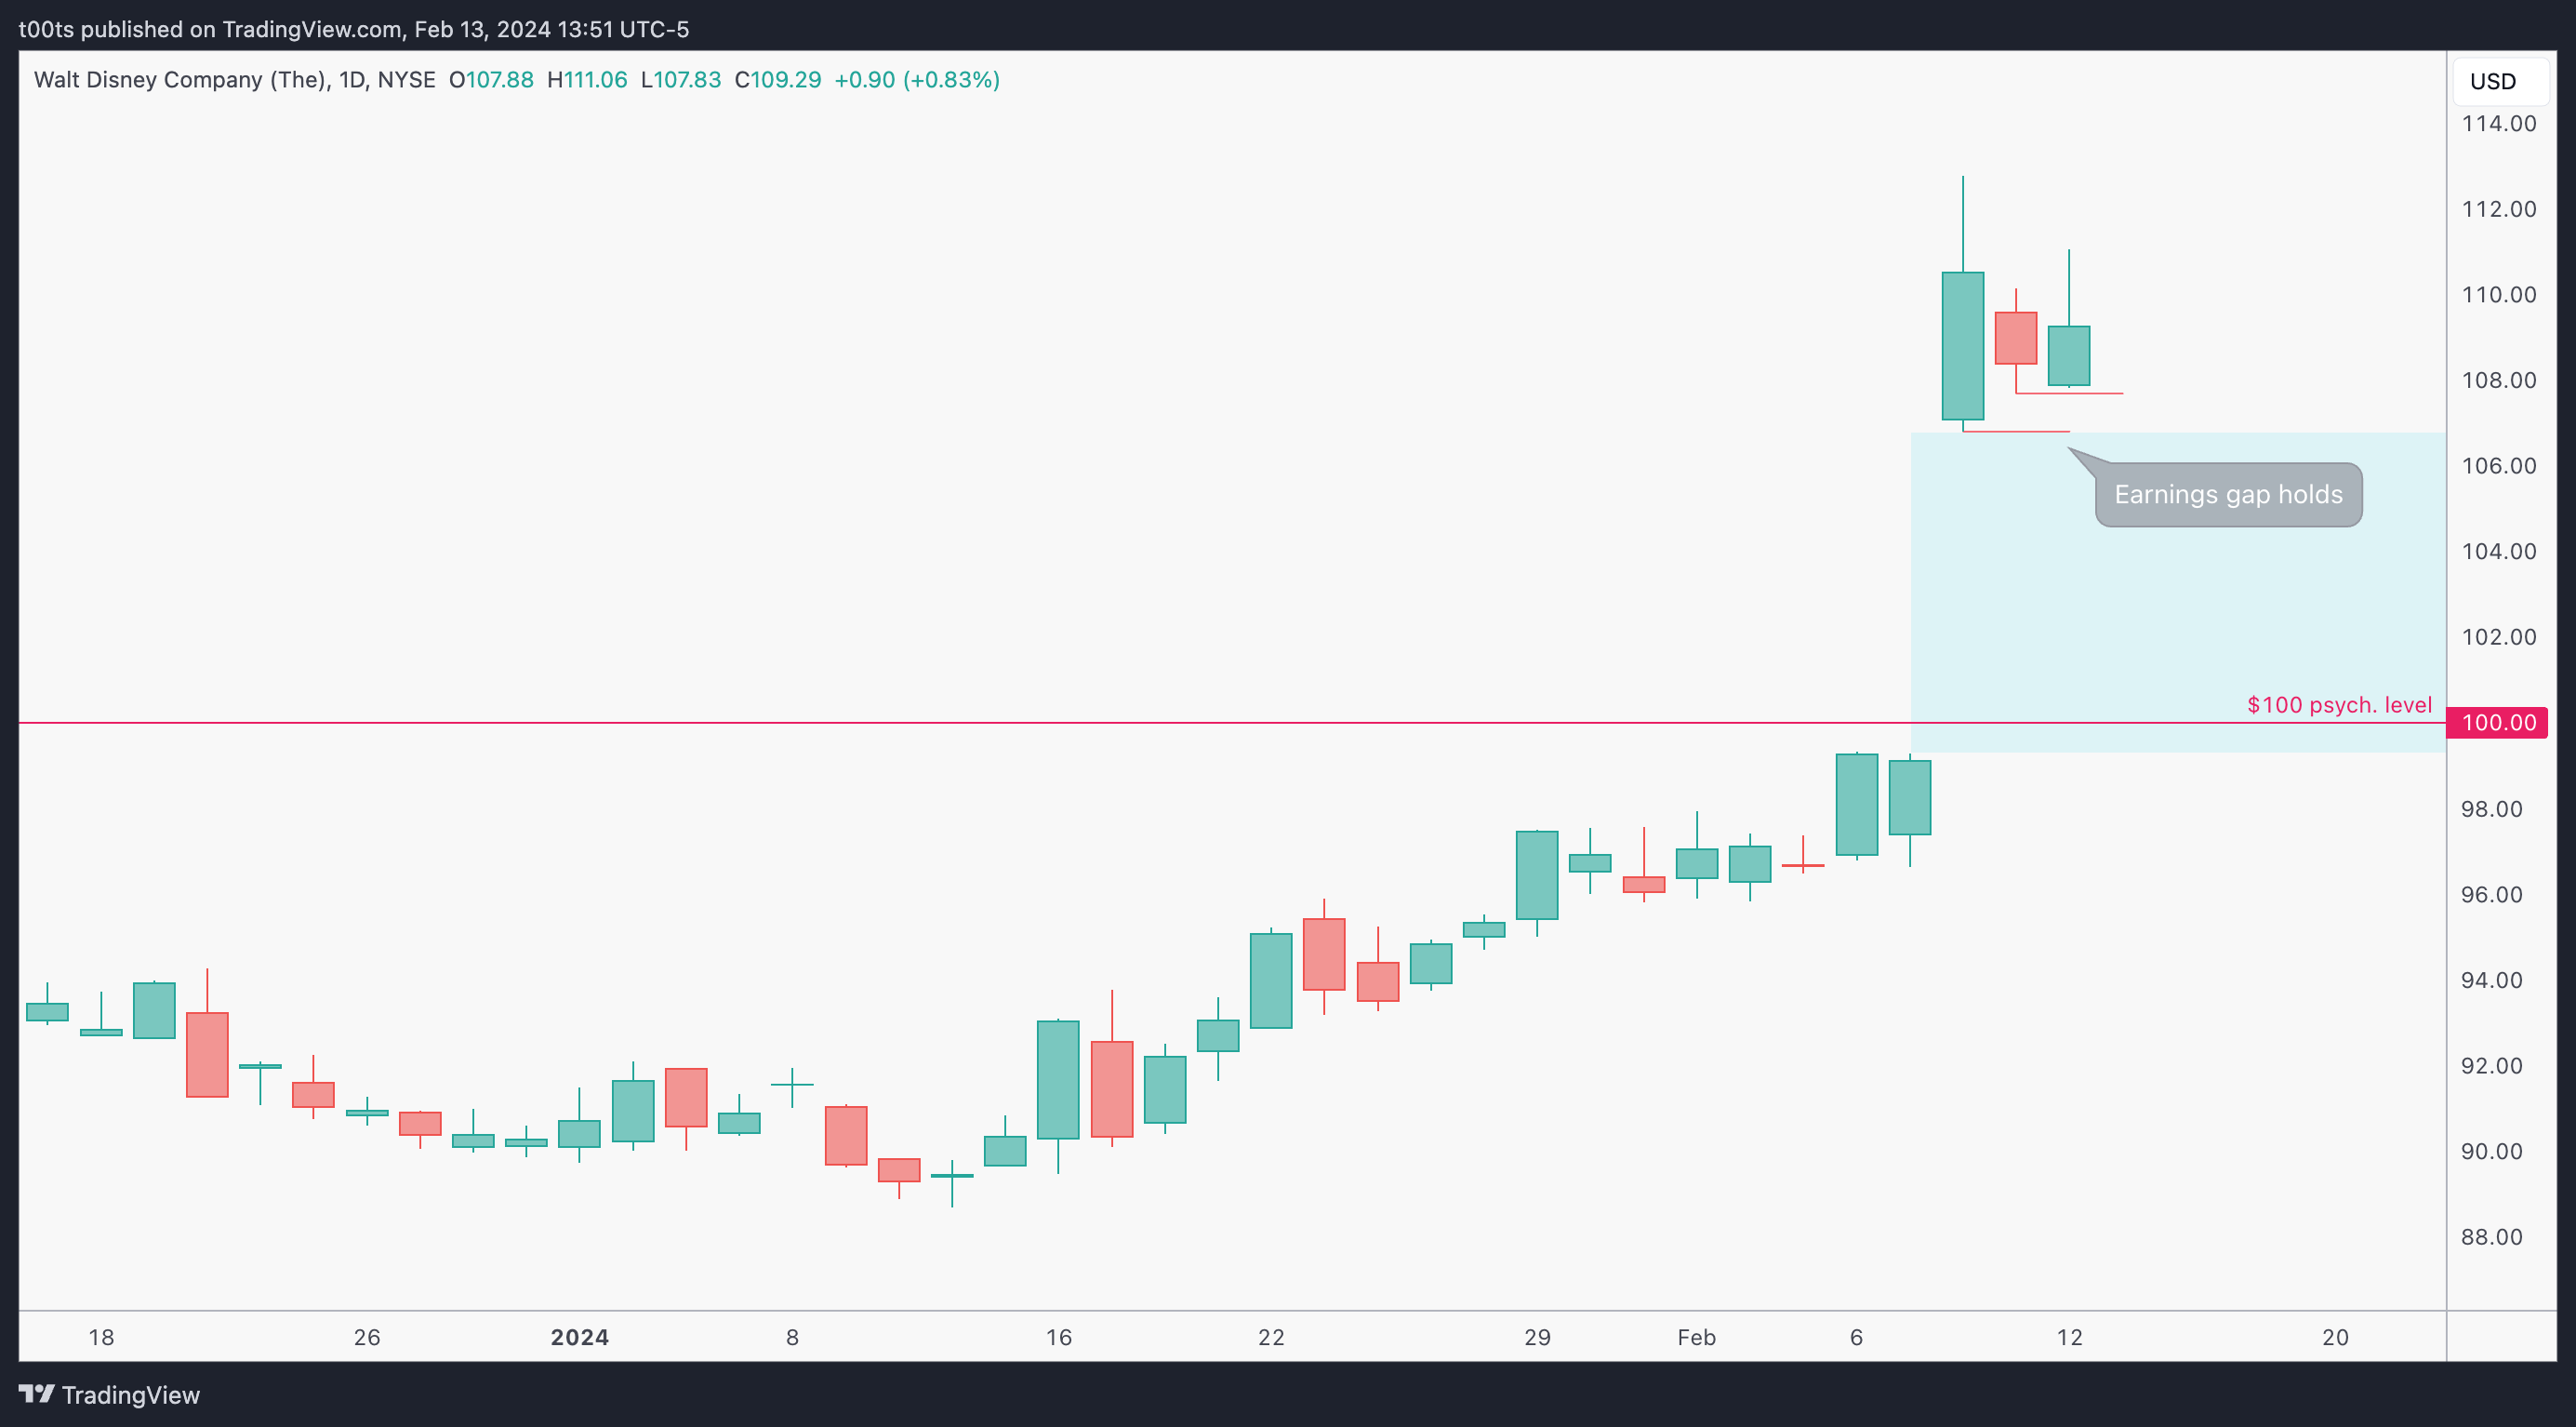
What's interesting to see on this daily chart is how well the earnings gap is holding so far. The two days that followed the gap day haven't traded below the previous day's lows, denoting how buyers are accumulating at these levels and may not be expecting that much of a pullback.
Hourly chart
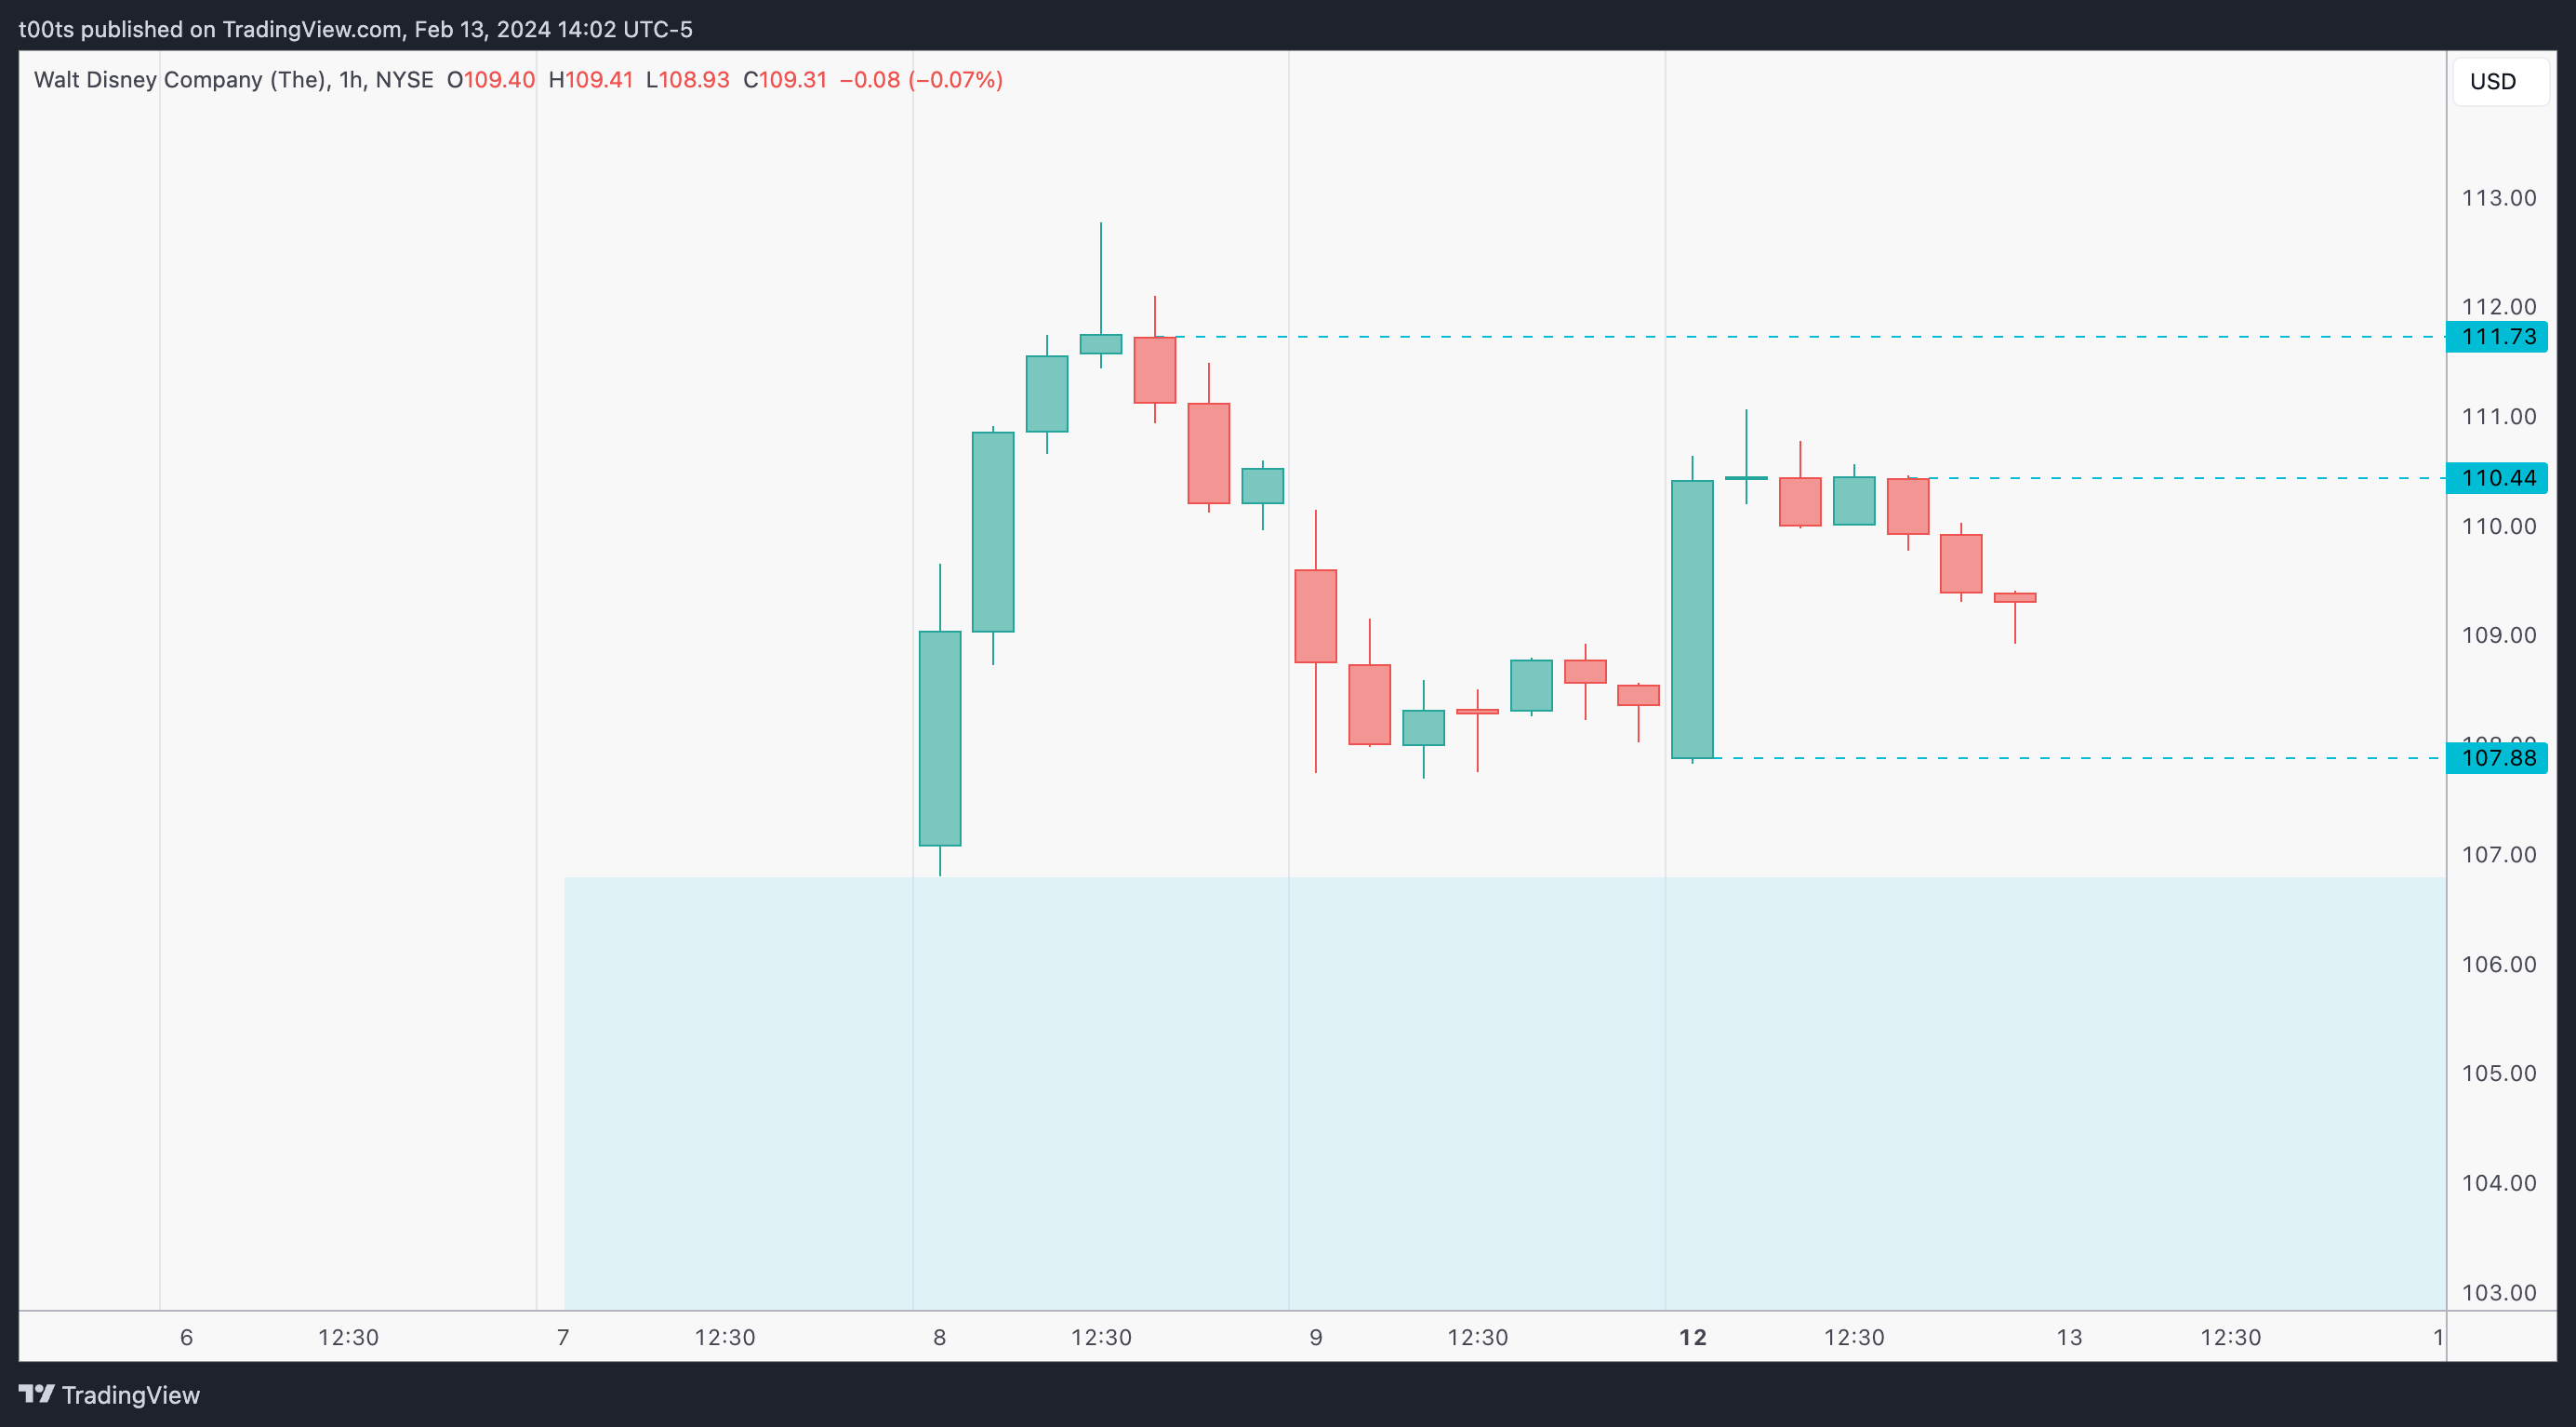
Very similar hourly chart to yesterday's post. Price is in a range, but we now have a few levels of interest we can use to trade off of.
Once again, this chart is isolated from the previous action because the picture has completely changed after the earnings gap, so anything previous to that is irrelevant at the moment.
Pre-market action
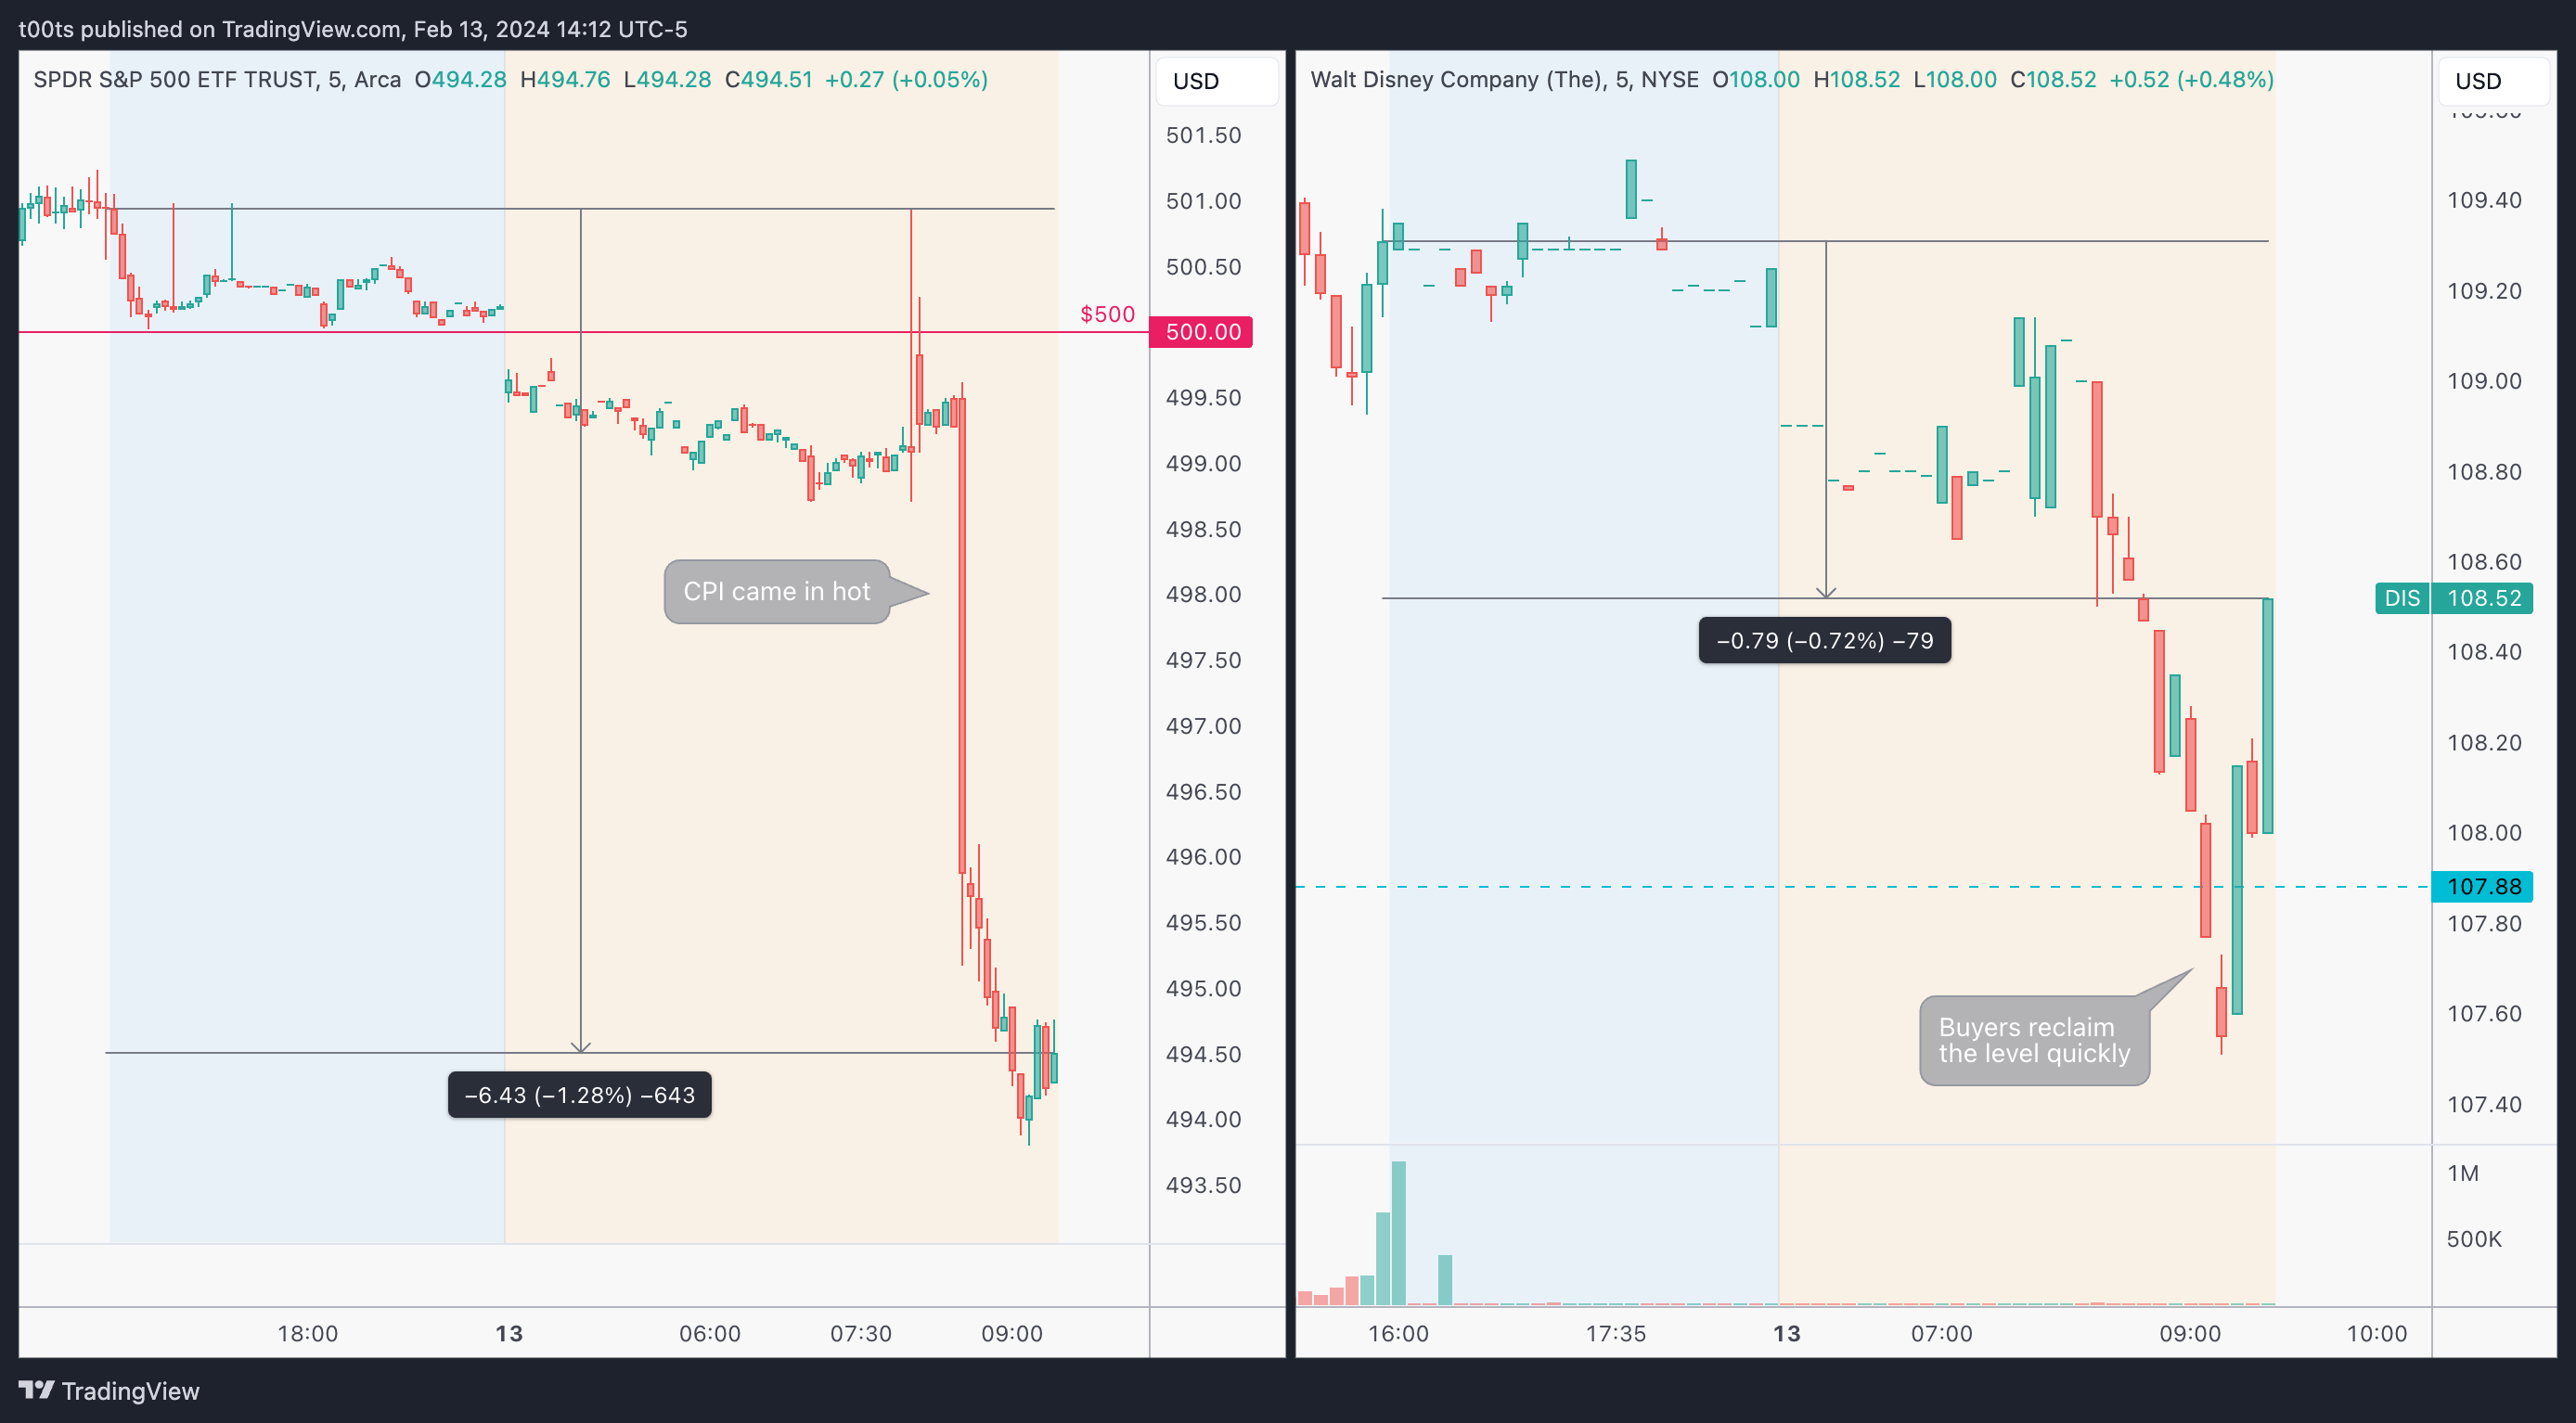
Here's where things start getting interesting. It's CPI day and the report came in hot. Inflation came out higher than expected and the market sold off as you can see in the SPY chart (left). However, while the SPY and many other high beta stocks are set to open considerably lower, Disney (right) stands out on how well it held the drop.
The trade
I wasn't planning to trade given the huge move in the pre-market. In fact, during the first few minutes after the bell everything was very dry as traders lacked conviction to either side. Eventually I found an entry and took it with small size and a whole lot of patience.
Using our CPT Framework:
Cue(s)
Weekly chart is as strong as it gets after flipping to an uptrend
Stock has been holding the earnings gap for the past few days
Stock is set to open with surprising relative strength vs. the overall market
Intraday cue: Bullish 2m reversal bar on the lower bound of a range
Plan
Again, I wasn't planning to trade, so there was no plan pre-market. And that's totally fine. Not all trades happen at or near the open. Sometimes you need more clues. Today was definitely one of those days. After the CPI dump you usually don't want to rush things.
The cues outlined above gave us direction in terms of where to look for a trade. And eventually, we got our signal and could make a plan.
The signal was that last item in the list of cues: a bullish reversal bar on a lower bound of a trading range. So the plan was to buy the break of that bar, risking its lows and targeting the $110.44 above. I went with small size on this one, which hindsight was key because it allowed me to hold for the whole move.
Trigger
Price breaking the highs of the bullish reversal bar
2m chart (entry details)
As a quick reminder, we're watching Disney because it's the stock that has shown the most relative strength vs. the SPY after the CPI drop.
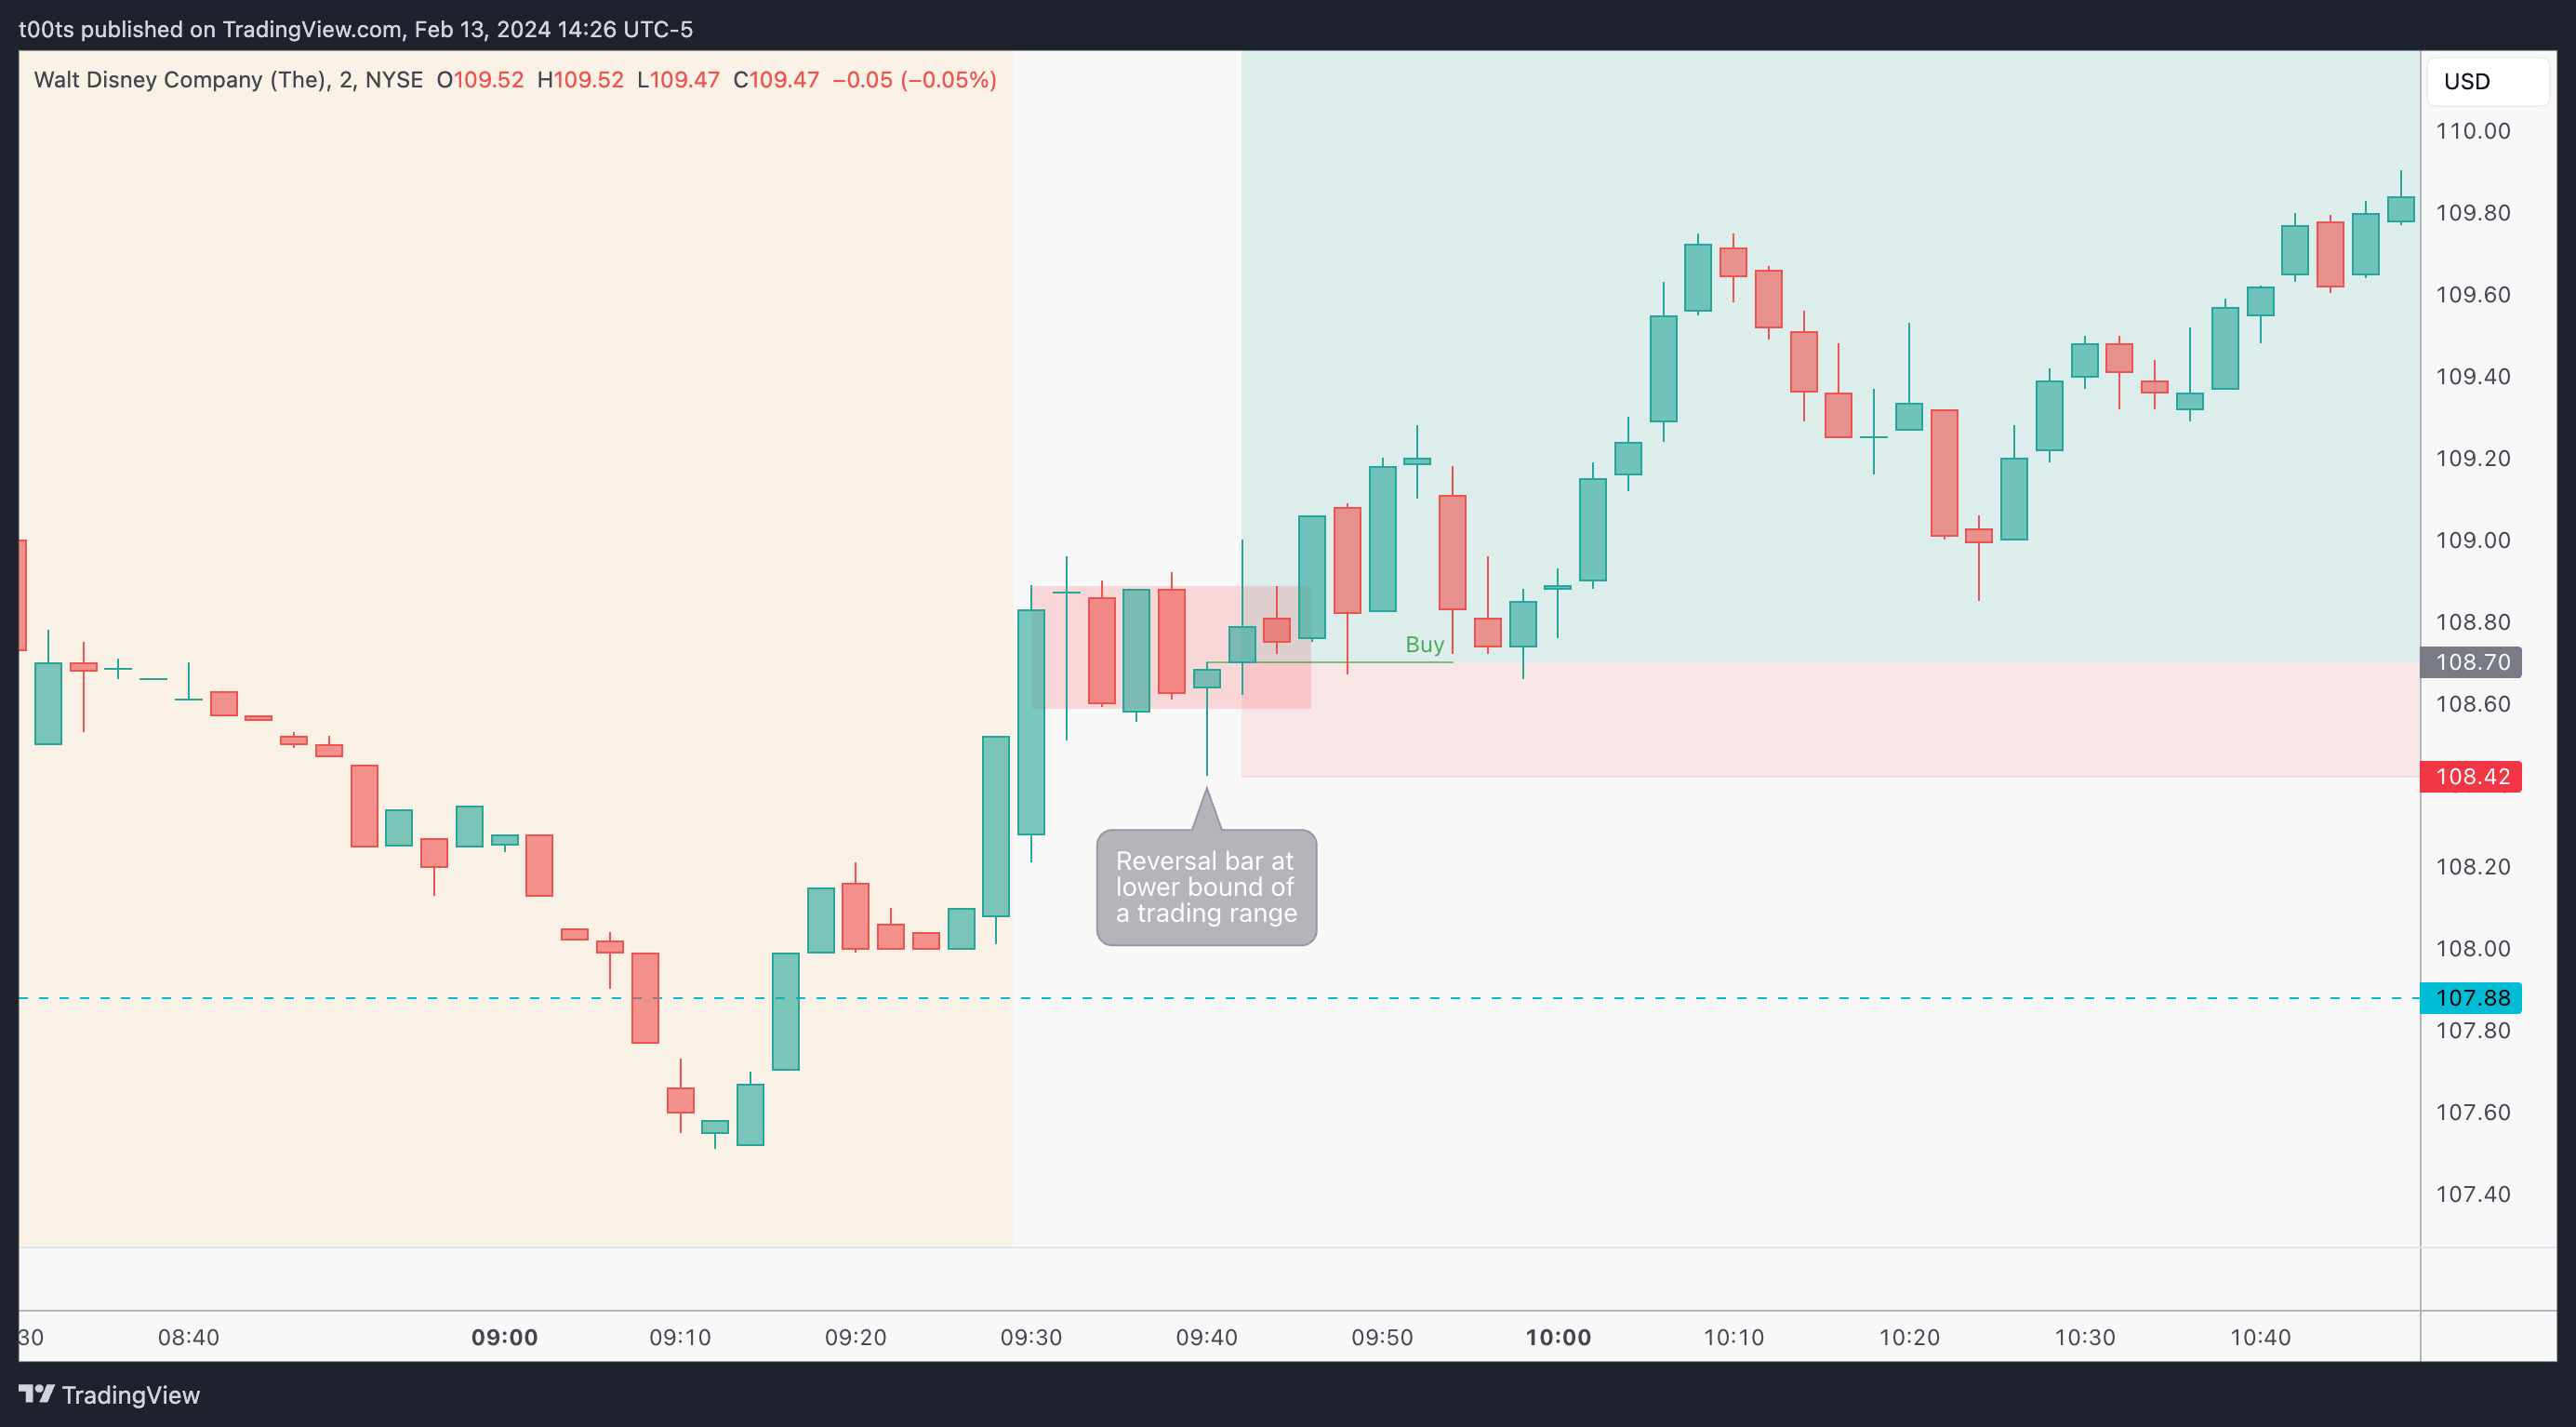
Price pushes straight off the open. Doesn't even come down to test the level, denoting strength from bulls. Soon enough, it starts creating this 40c range. At this point, I'm looking to get involved in the lower bound of the range.
Side note: Never ever buy at the top of the range, or sell at the bottom.
Price breaks the range to the downside but quite conveniently buyers bid back up and print a 2m bullish reversal bar at the lower bound of the range. And as we just went over, this was the final cue to create a plan and look for an entry on the break of it’s highs.
Price breaks above the bullish reversal bar on the next 2m candle, triggering our entry.
5m chart
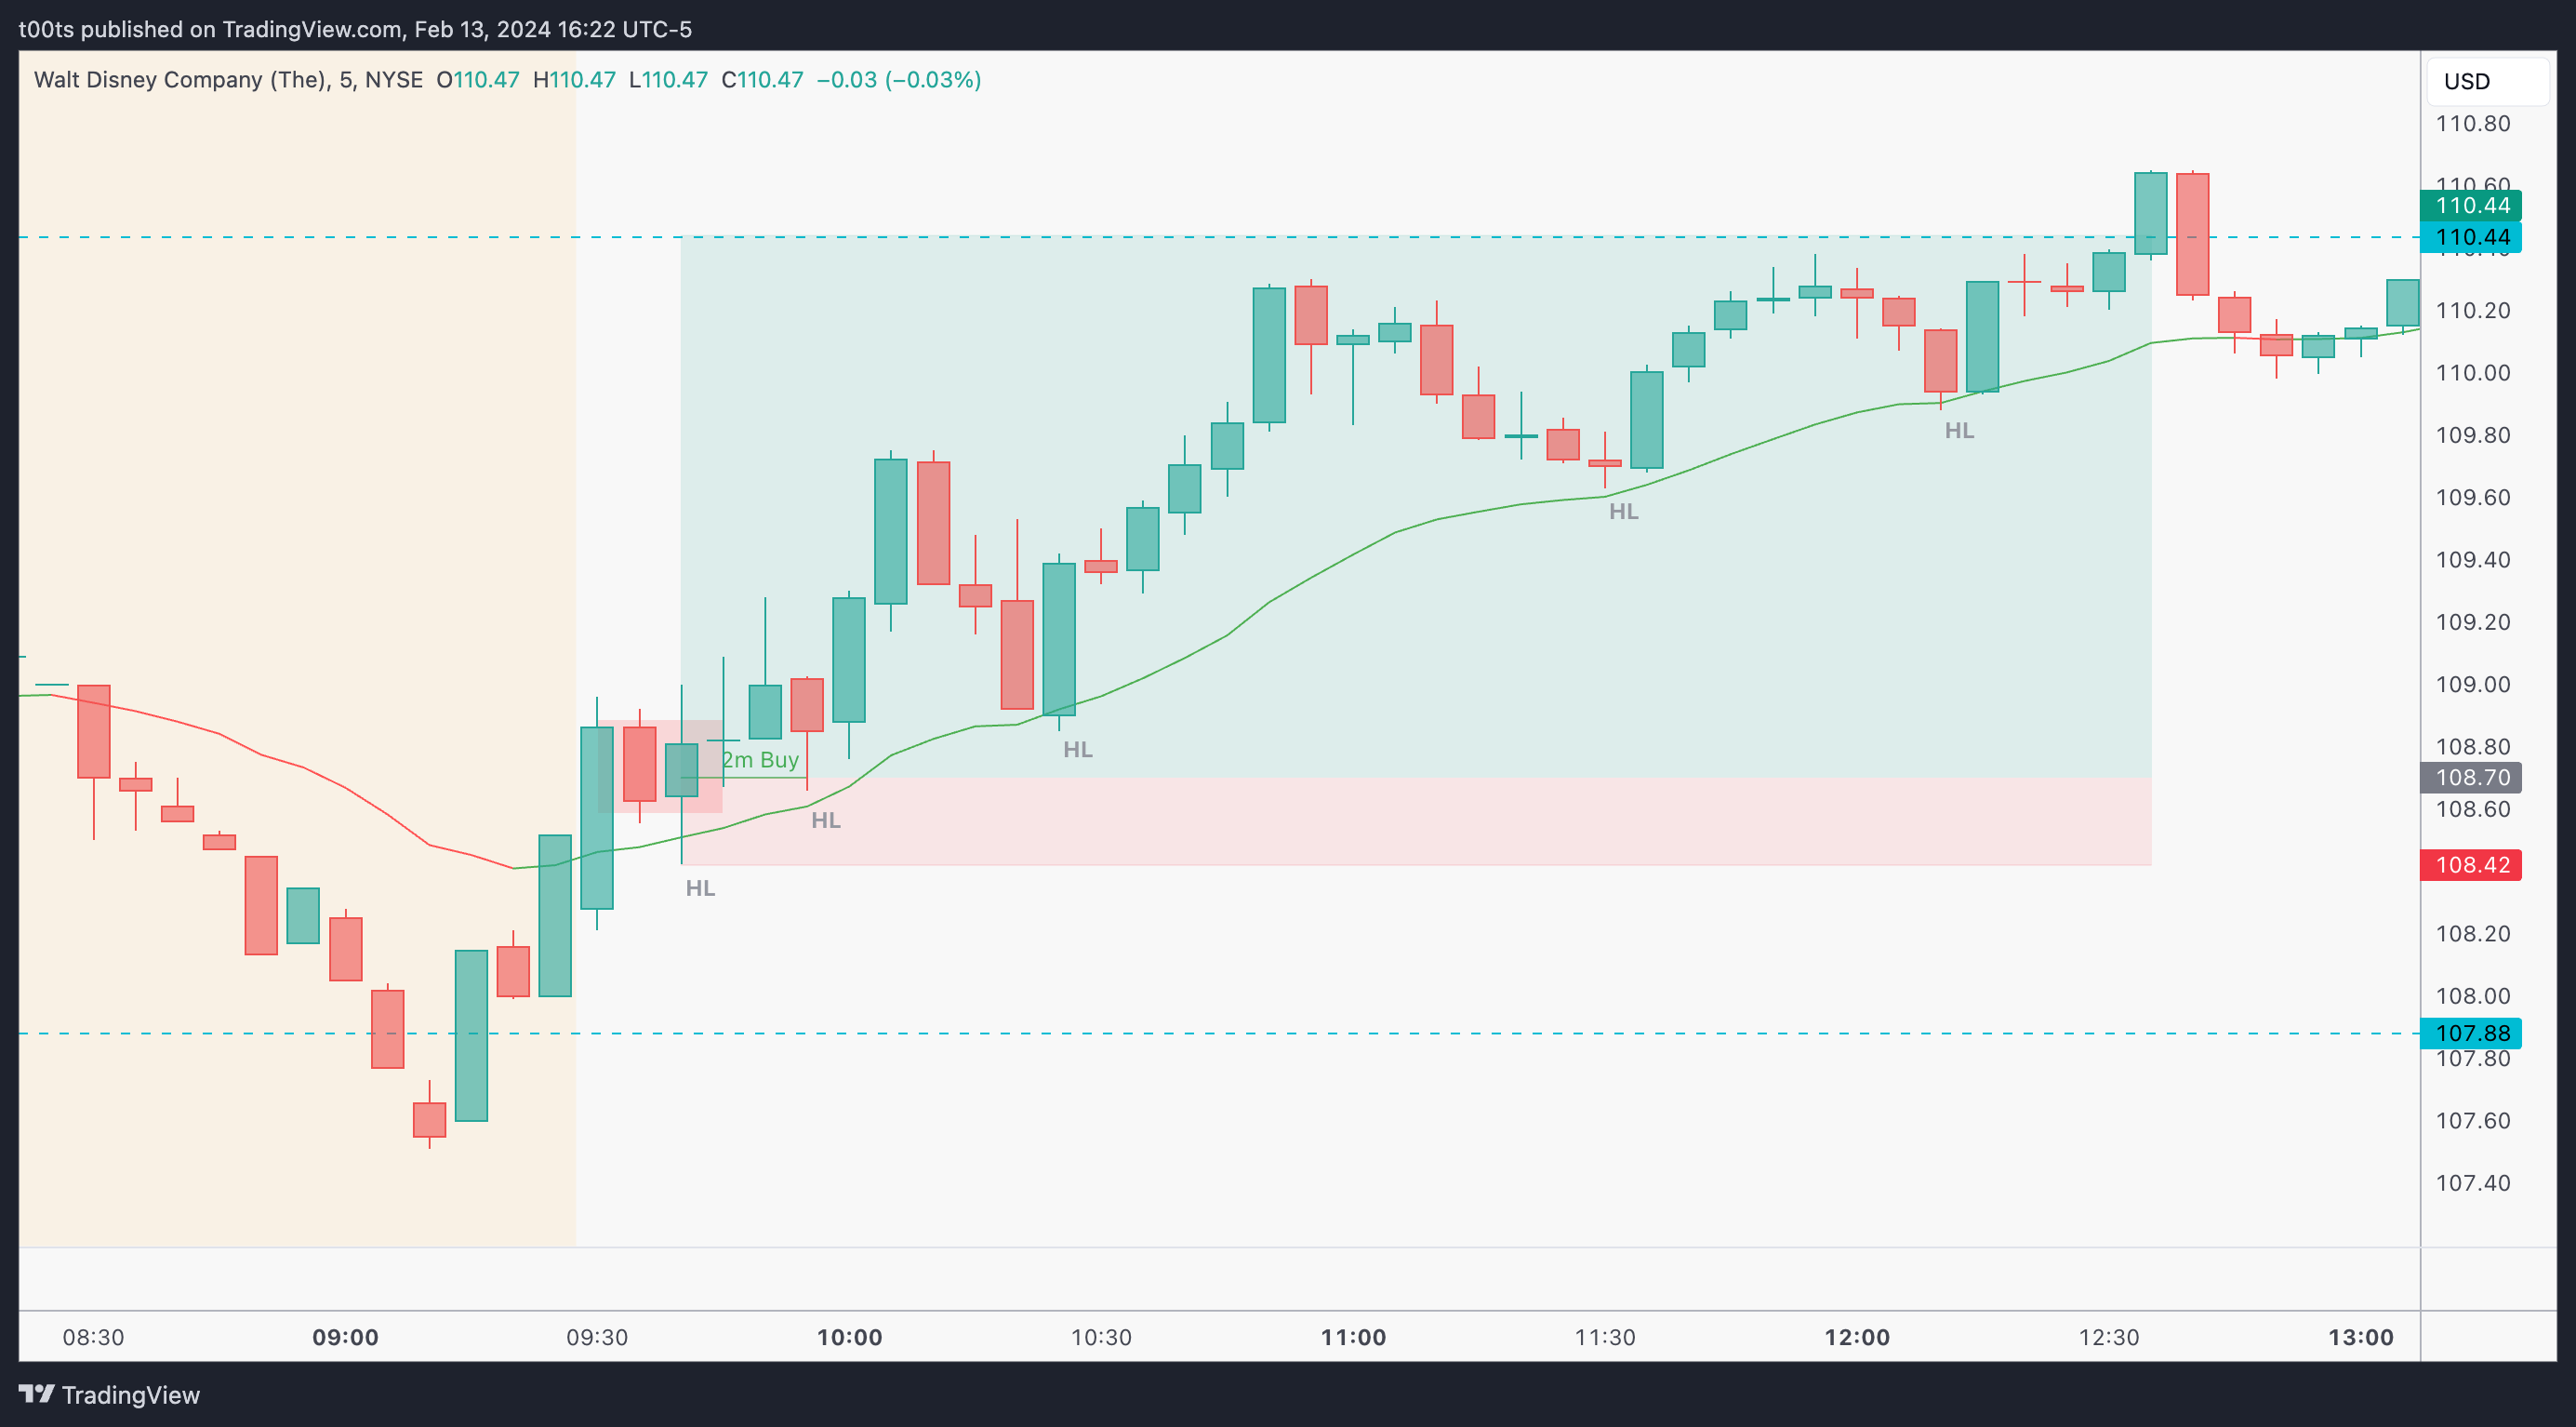
There were some up's and down's as price traded towards our target. As mentioned, given the characteristics of the day, I chose to position myself with small size, and that turned out to be a great idea because quite honestly I doubt I would've been able to hold through these swings. Nevertheless, we can see how, despite the pullbacks, price trended all the way to our target, putting in consistent higher lows at our Trend EMA, which I was using both as a trend gauge and as stop level (which never triggered).
Closing notes
On a day like today, you either trade the indices or have to find something that gives you enough reasons to be worth the risk. In a market completely led by AI and the semiconductor industry, I'm not sure if Disney was worth the risk, but it did offer enough reasons to give it a go. And I'm glad I did.
Not every day has to be a PnL day. A lot of my days are used to build confidence. This was one of them. As I always say, your confidence equity is way more important than your dollar equity. I destroyed my confidence back in 2022 and building it back is the hardest thing I've ever had to do. Whatever yo do, protect your confidence.
I am posting one trade writeup every day throughout 2024. I focus on large caps using levels and price action. The subscription is absolutely free and will always be. I will strive to provide value by offering clues and ideas for you to enhance your edge. Let’s grow together!