
Arm Holdings (ARM) - Feb 12th 2024
ARM demands the spotlight after its strong earnings push

Higher timeframe context
ARM recently experienced an extraordinary push after its last earnings release, and has quickly doubled its value. This has brought attention to this name from many investors who were maybe unaware of this company, or simply chose to focus on more common chip names like AMD, NVDA and other usual suspects.
The avid reader knows I've been talking about ARM for weeks. I believe it’s a great investment opportunity. In this post I talked about what they do and why they're an extremely relevant player in this sector.
Today we traded an extraordinary move that’s worth reviewing. Let’s dive into it!
Weekly chart
This weekly chart is a bit bizarre right now because of the huge earnings gap from last week. Leaving it here for completeness, but it doesn't really help us much.

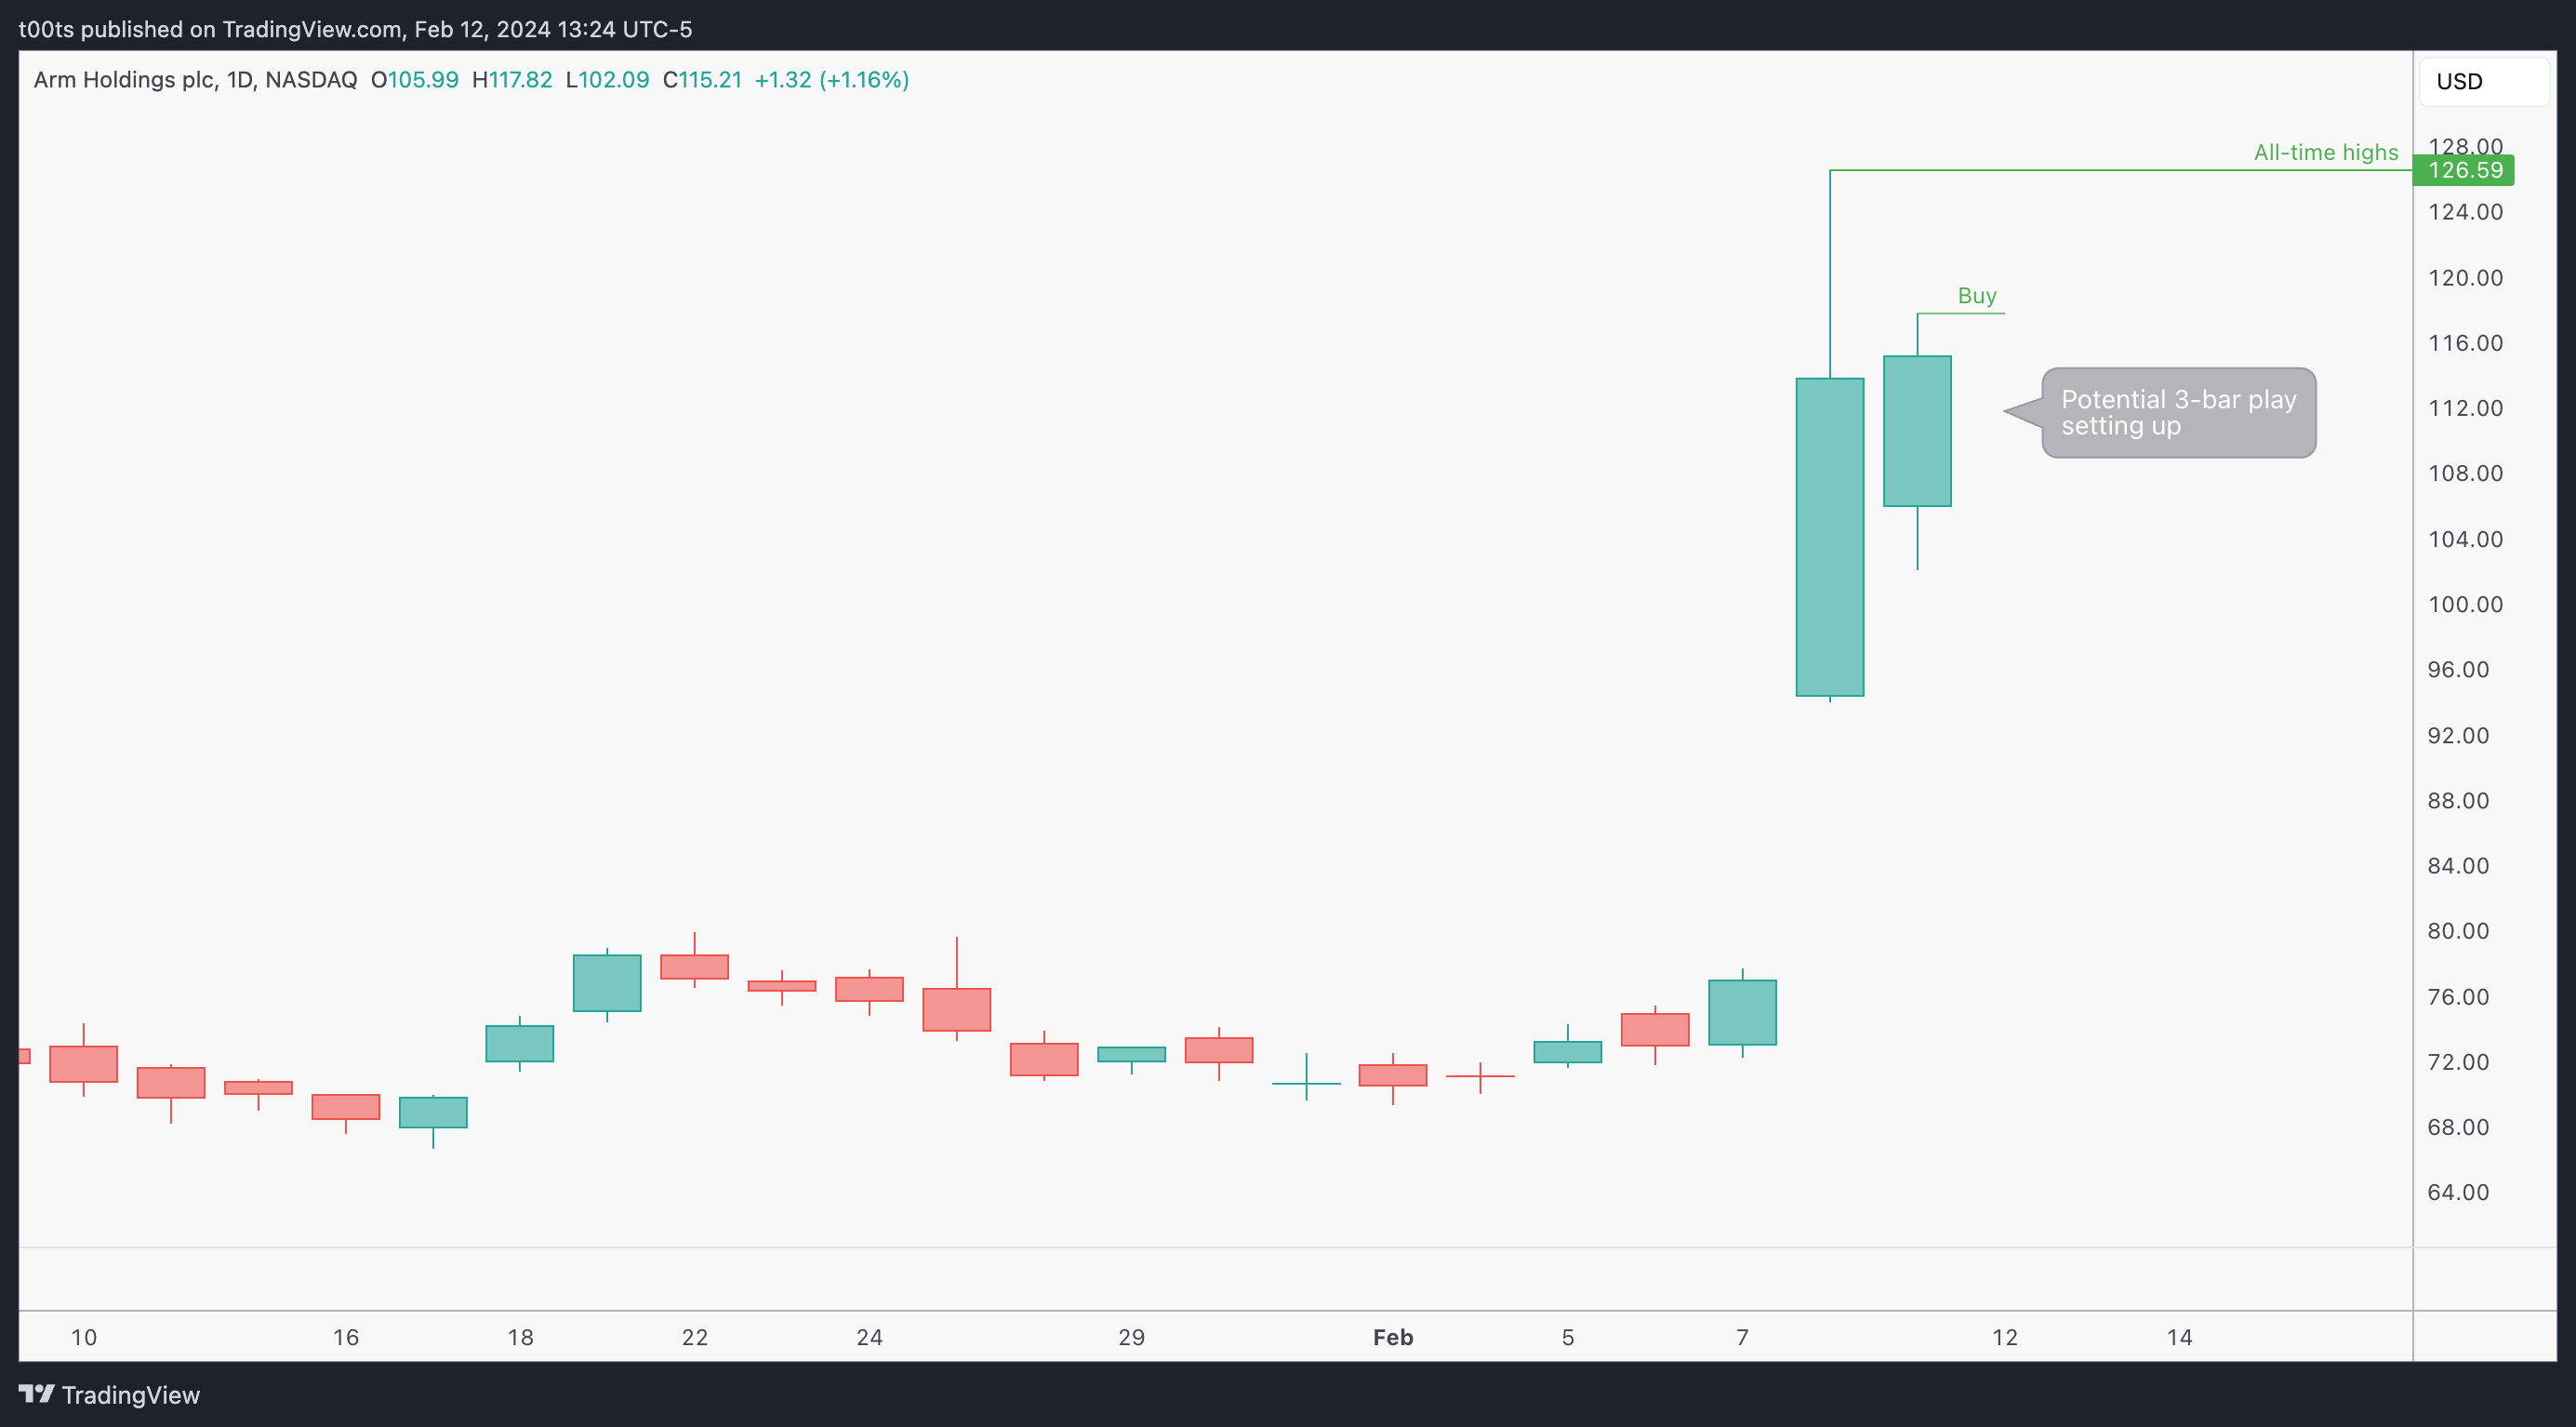
Daily chart
Here's the first thing that brought this name to my attention: The potential 3-bar play that's setting up on the daily chart with that bullish inside bar after the earnings pop.
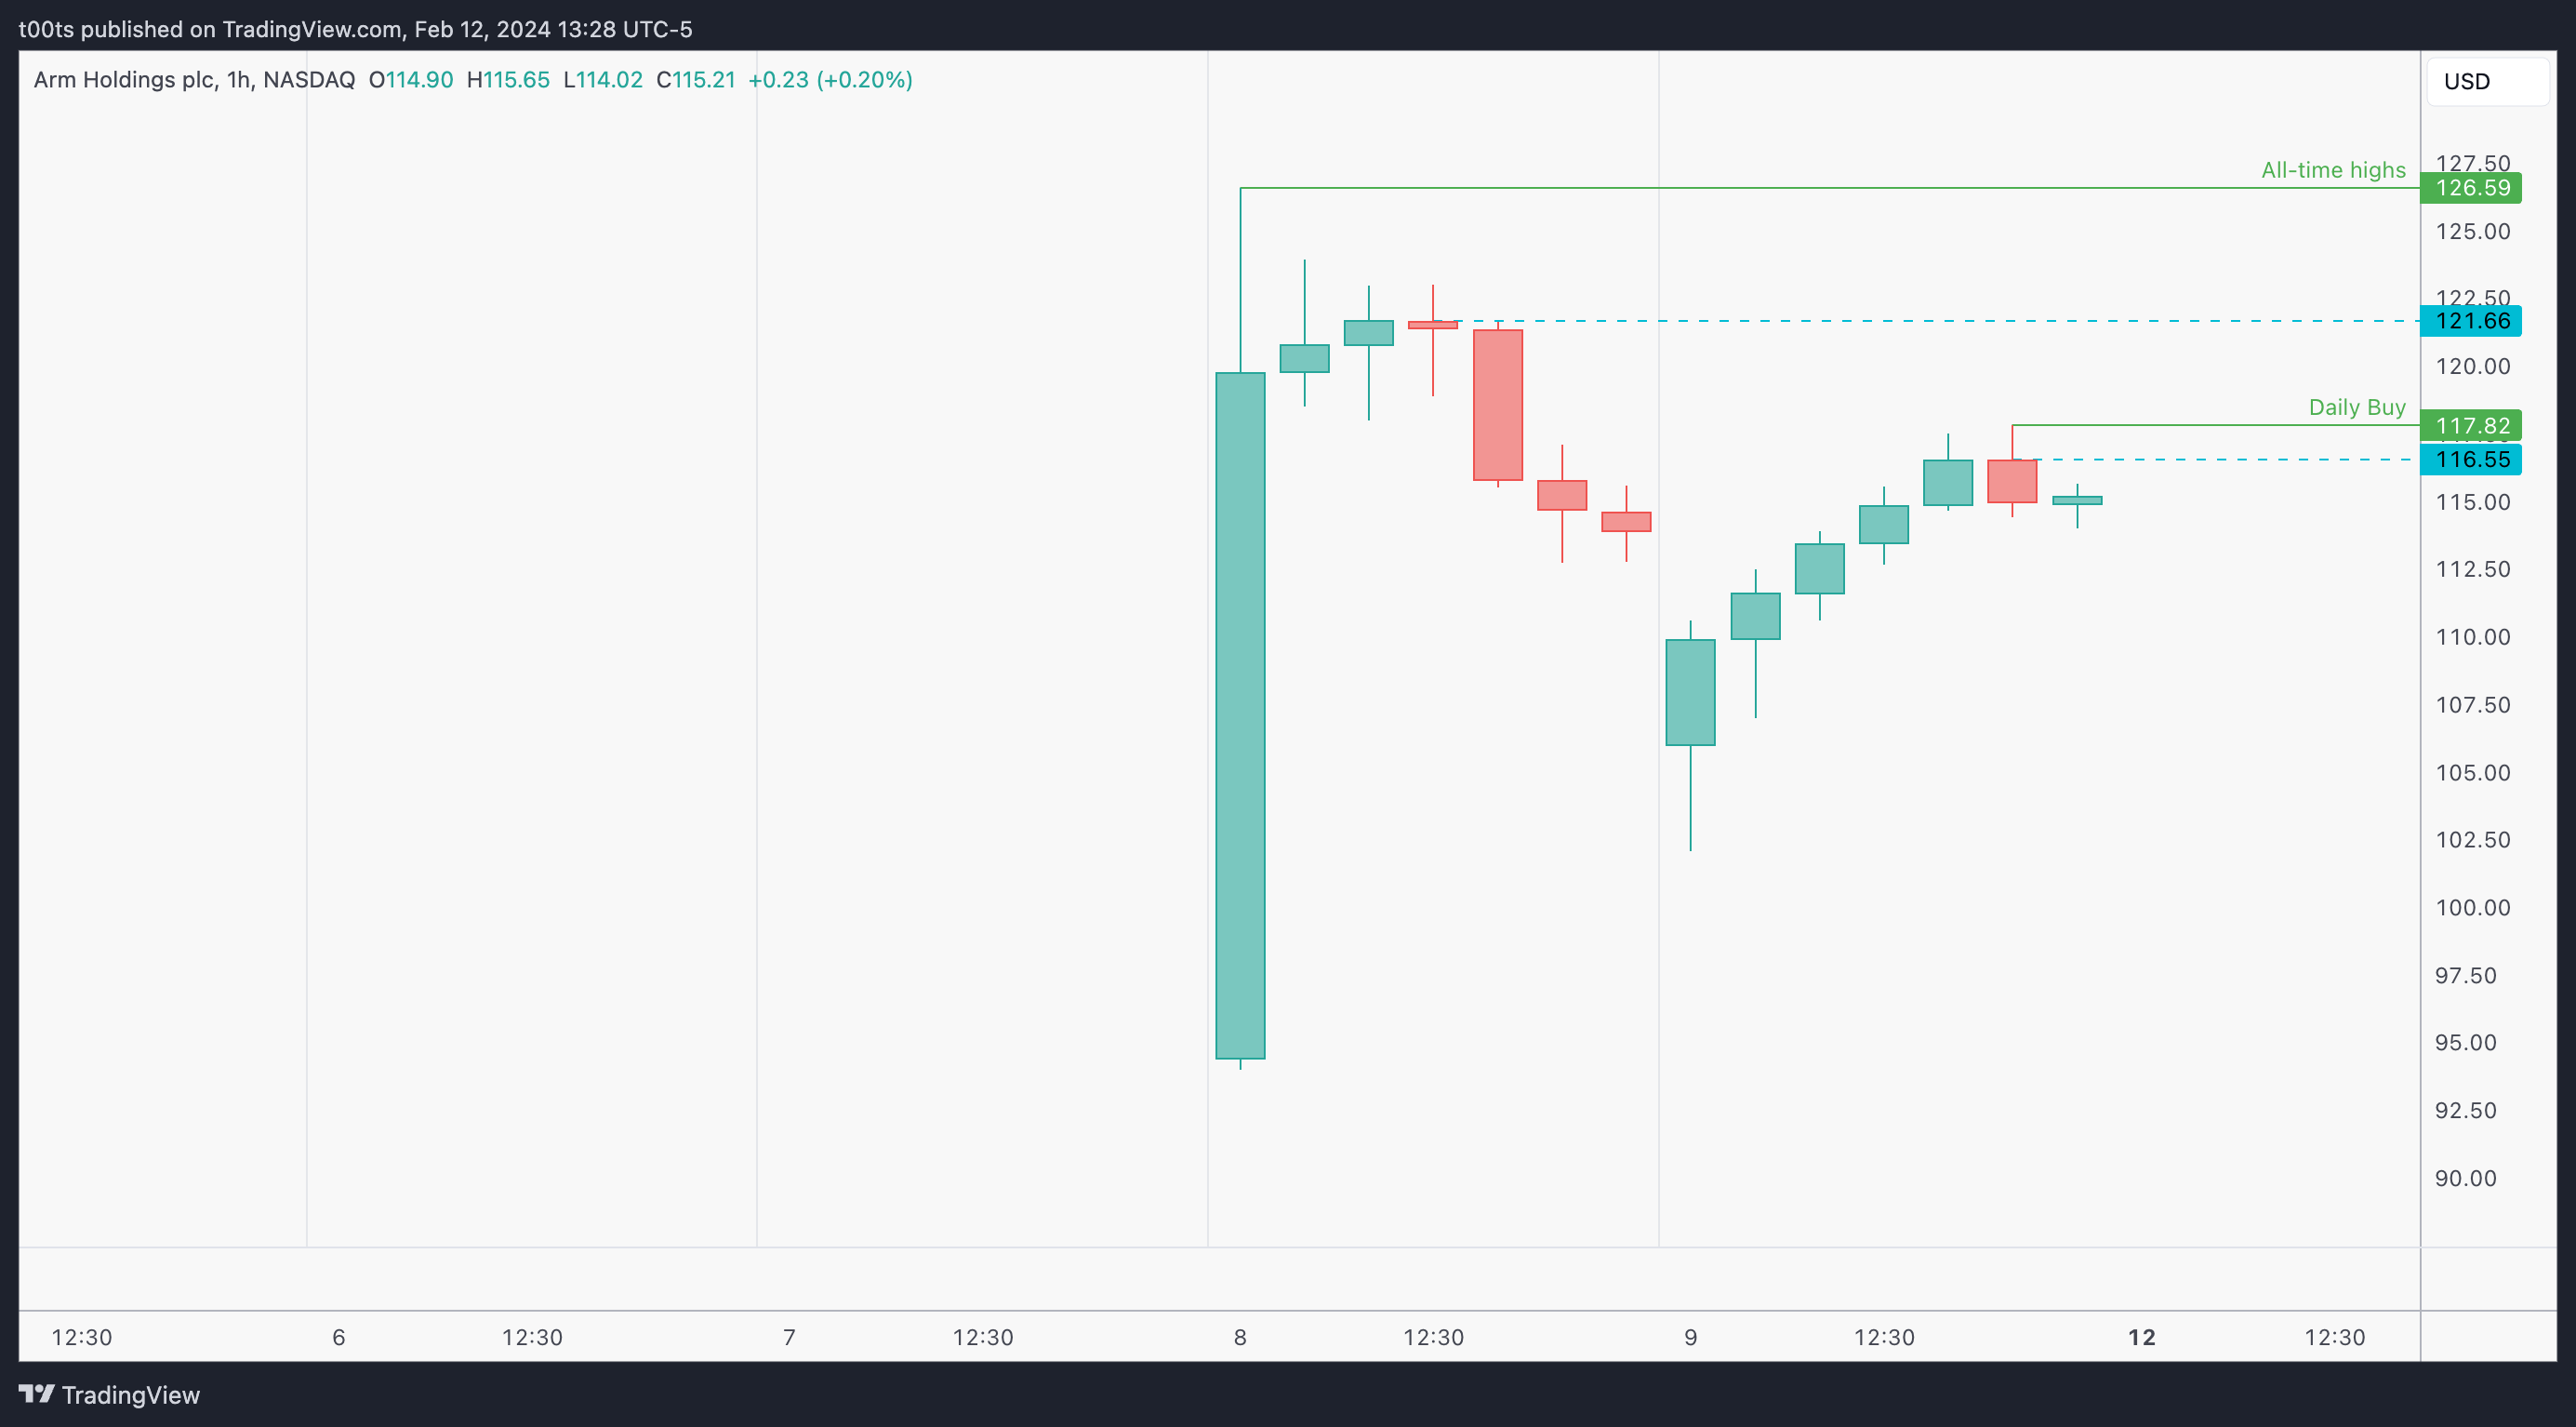
Hourly chart
Simple chart with 4 levels of interest. Two hourly levels at $121.66 and $116.55, our daily buy trigger at $117.82, and the all-time high mark at $126.59.
This hourly chart is isolated from the previous action because the picture has completely changed after the earnings gap. Anything before that is now irrelevant.
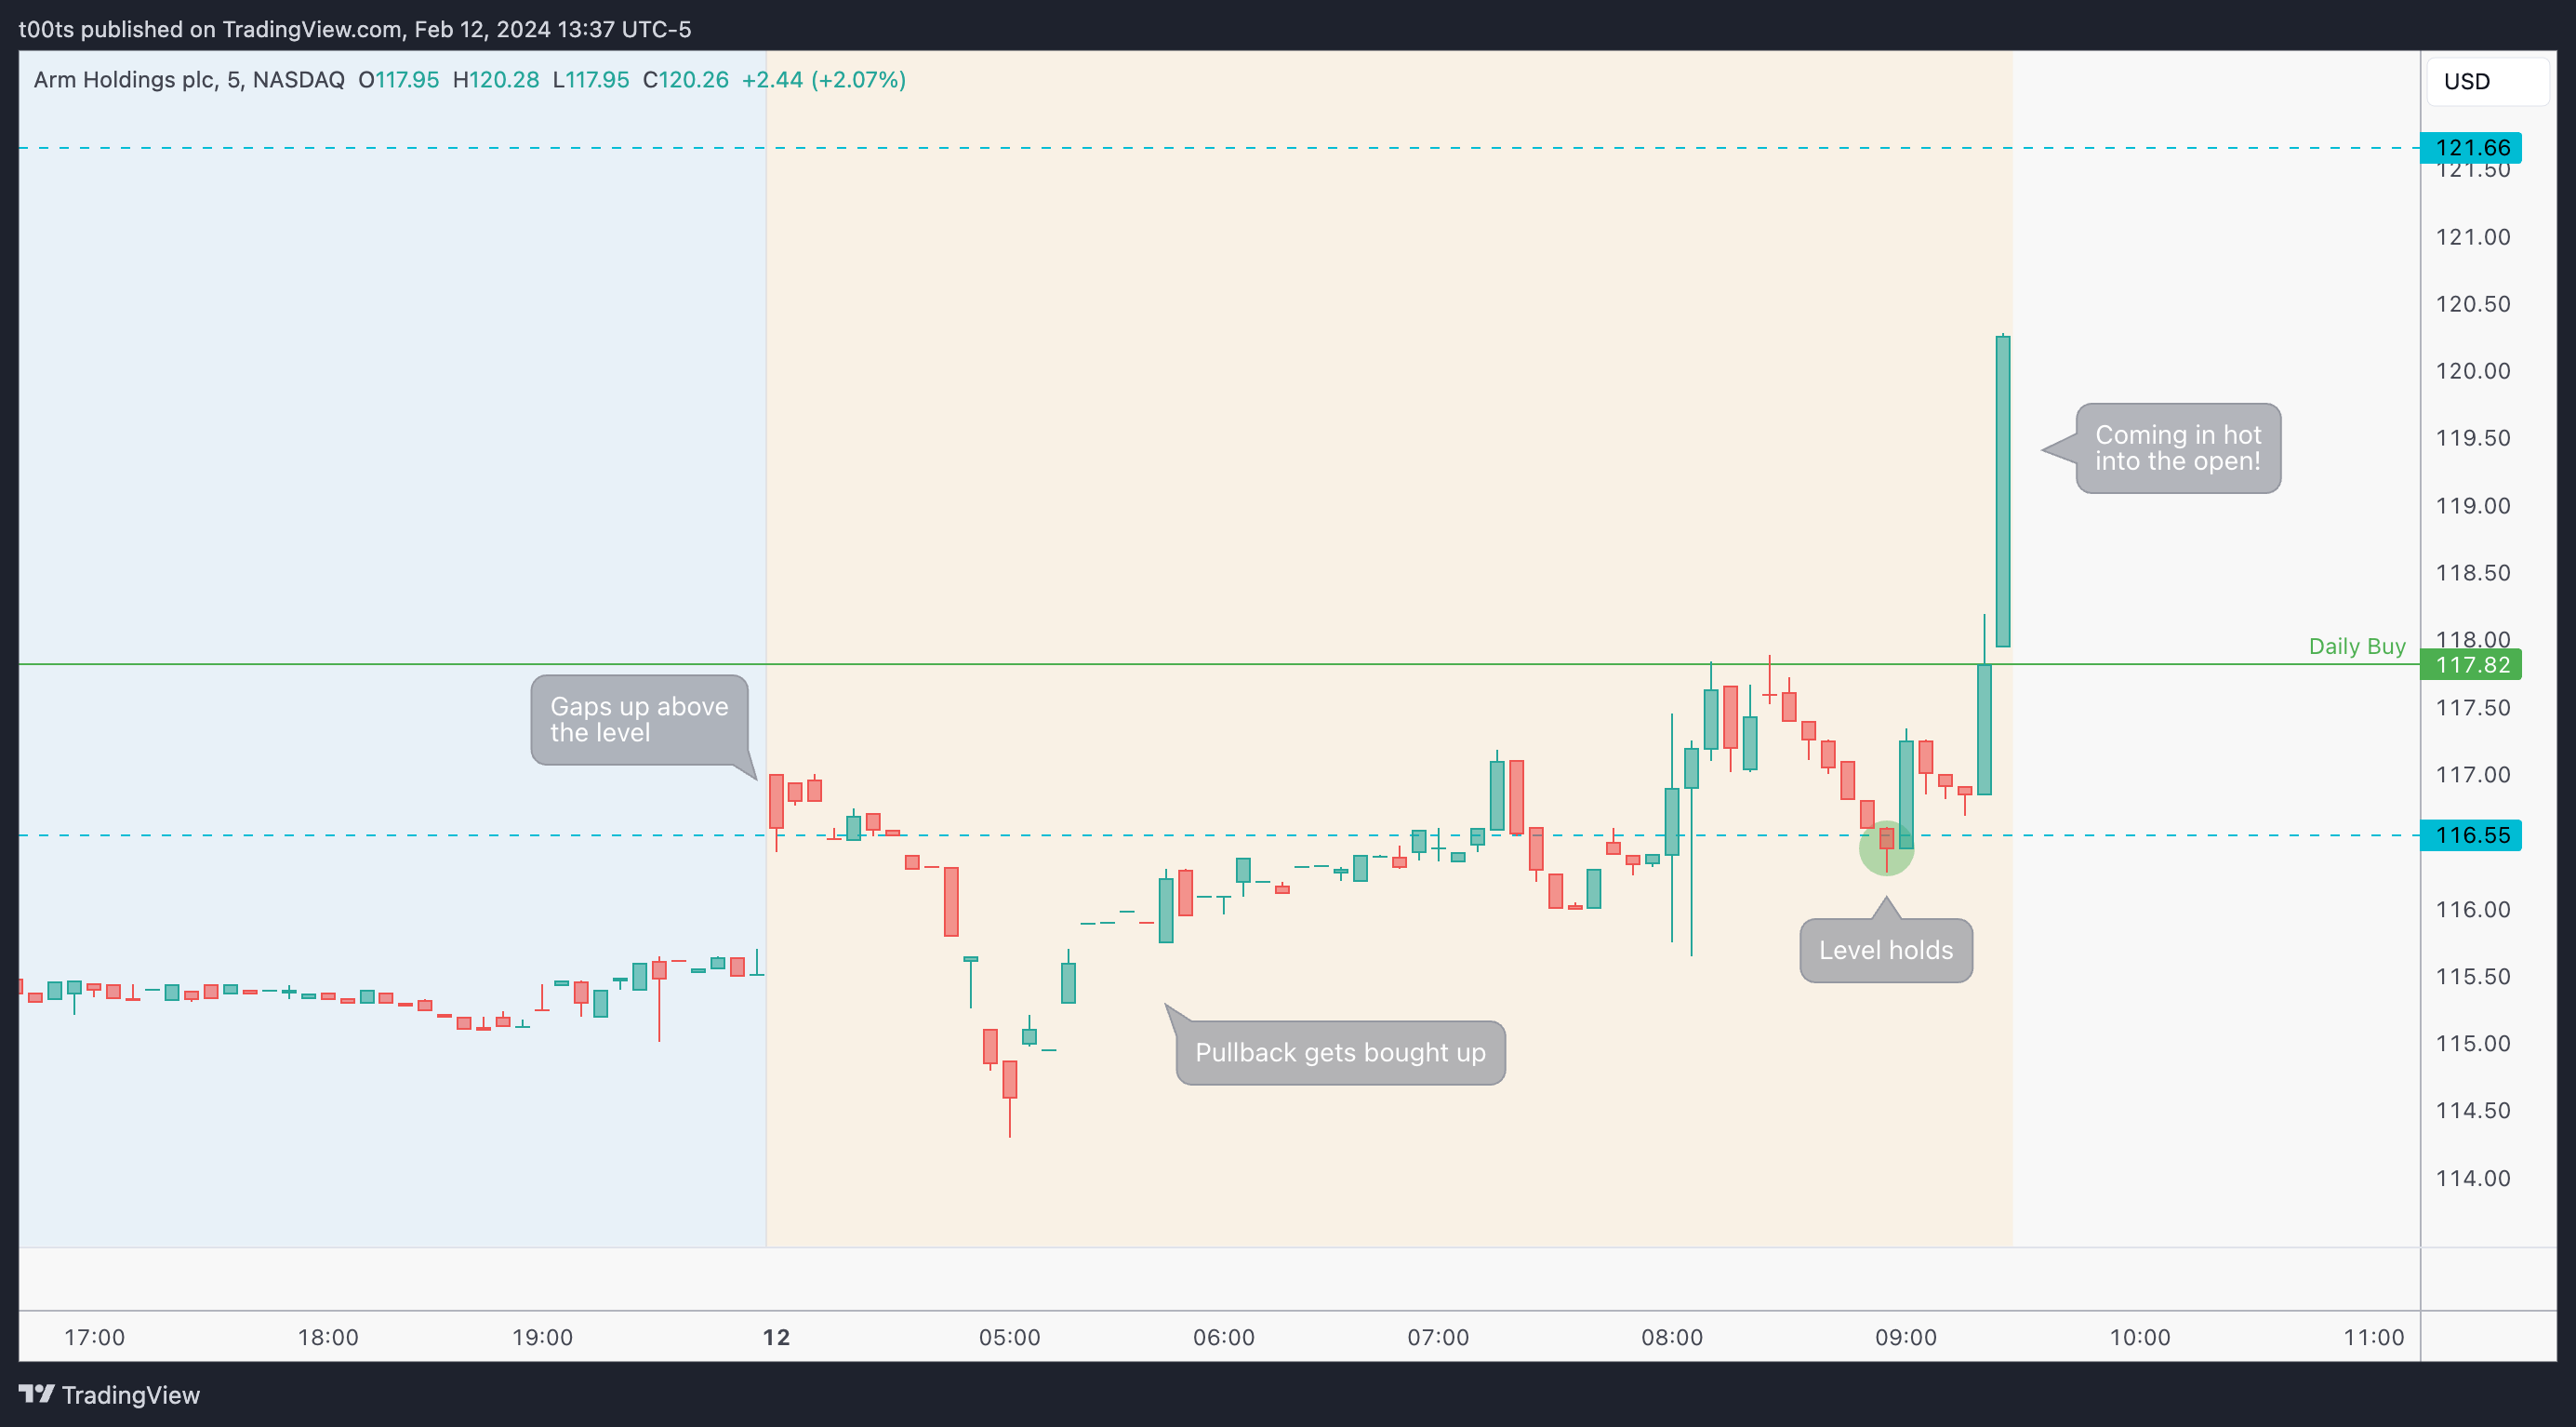
Pre-market action
This pre-market action -especially towards the open- was another eye catcher. ARM has bounced at the $116.55, triggered the daily buy mark and is coming in with very strong momentum into the bell.
The trade
Traded this name with my brother Charls and we had a lot of fun with it. While I did take some entries near the open anticipating moves, I like to keep these posts as quantifiable as possible, so I'll do my best to cover the trade from a systematic approach and avoid wasting your time with my opinions.
Using our CPT Framework:
Cue(s)
Stock belongs to hottest sector and is still in its early stages
Recent extraordinary earnings gap with good follow-through
Daily 3-bar play setting up (and triggering in the pre-market)
Intraday cue: Buy setup at our first level after holding the open
Plan
Ideally we wanted to see a quick washout at the open to get involved in a potential bounce around $118, which was the daily buy trigger. But the stock never gave us $118 and instead broke the $121.66.
We then got a pullback into the $120 psych. level, which very conveniently matched the opening print for the day. Here's where both of us took our entries. The plan was to hold until there was a reason to sell. We were pretty confident it could make new all-time highs.
Trigger
Buy setup off the opening print triggering
2m chart (entry details)

As with every trade where we're looking to get involved near the open, the 2m chart allows us to get involved in our trades quicker. However, it's important to not get absorbed by this chart. Once in, always shift your focus to the higher timeframes to reduce the noice.
There are 3 potential entries marked in this chart:
The first entry triggers when price trades above the highs of that signal bar that bounces off the open and closes above our $121.66 level. You could use the level itself as risk level, placing your stop right below it.
The second entry triggers when price trades above that textbook bullish reversal bar which is putting in a potential higher low. Your stop would be at the lows of that signal bar.
The third entry triggers when price breaks that inside bar after that bullish hammer that's screaming buy as price tries to break those previous all-time highs for the 10th time. Again, your stop is super tight as you can use the lows of that small range in case the breakout fails.
I've also marked two scalper stops (ST1 and ST2) that I believe were justified for anyone scalping near the open. Both are breakdowns of inside bars that have rejected at previous all-time highs and both lead to pullbacks. Even if you were to take these stops, there were still two entries to get involved again.
2m chart (trade detail)
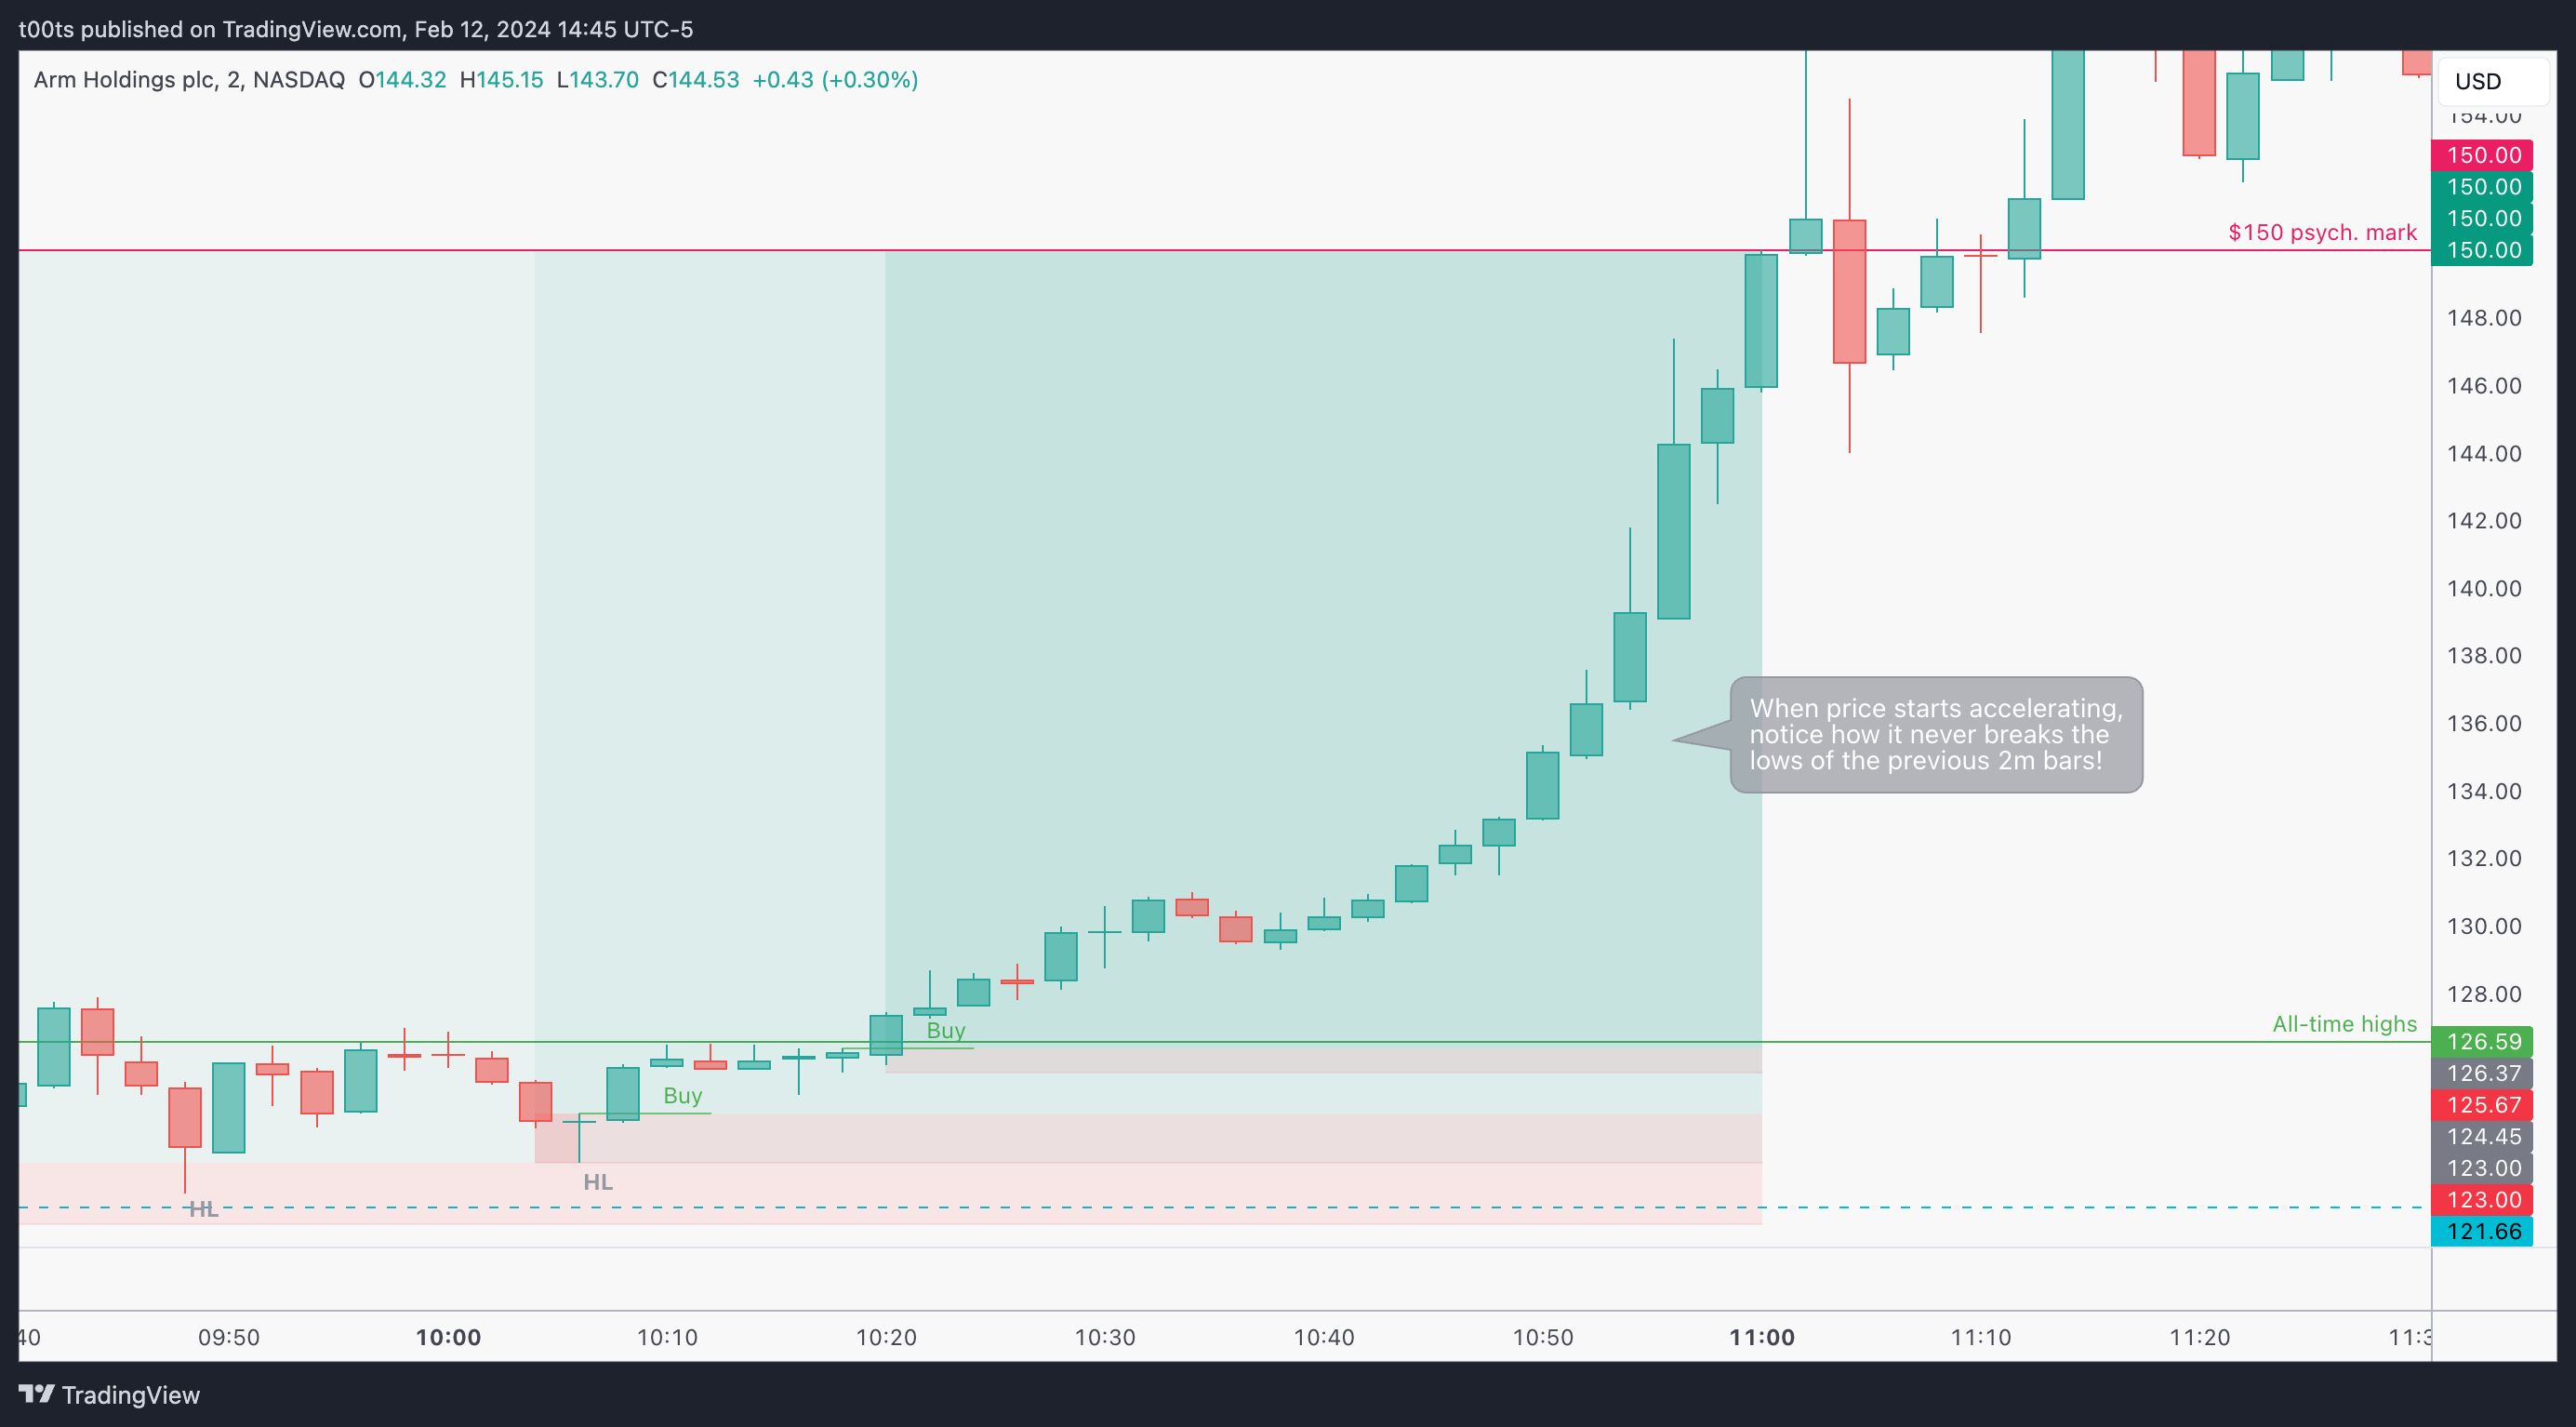
Stock went absolutely bonkers. I've set the target of these longs at the $150 psych. mark because in real-time that was the “obvious” thing to do. I've also chosen to use a 2m chart again just so we get a better idea of what was going on. You can imagine how the 5m looked.
What's interesting here is that as price accelerated to the upside, price never pulled back below previous 2m bar lows. You could trail your stop as every 2m candle closed and it just never triggered, until that pullback at the $150 mark, which would've gotten you out of the trade at the exact same price point as if you took the exit yourself as price reached that level.
Closing notes
There were a few extraordinary moves in the market this day. ARM was one of them. All the entries were straightforward and the initial consolidation allowed anyone who was watching to take a position with little risk and hopefully capture a piece of the move. The exit in this particular case was also quite straightforward as the trade kept working until that $150 pullback.
Certainly one of those opportunities that traders live for. If you missed it, you can either feel bad and complain, or study and prepare yourself to do better on the next one. Spoiler alert: The latter has higher ROI.
I am posting one trade writeup every day throughout 2024. I focus on large caps using levels and price action. The subscription is absolutely free and will always be. I will strive to provide value by offering clues and ideas for you to enhance your edge. Let’s grow together!