

Higher timeframe context
We recently went over a long trade on Airbnb. Yesterday it stood out to me again as it looked like it wanted to attempt yet another break of that IPO price mark that sellers keep defending. The daily chart was once again looking ready for a potential move up, and I took advantage of the opportunity. Let’s go over it!
Weekly chart
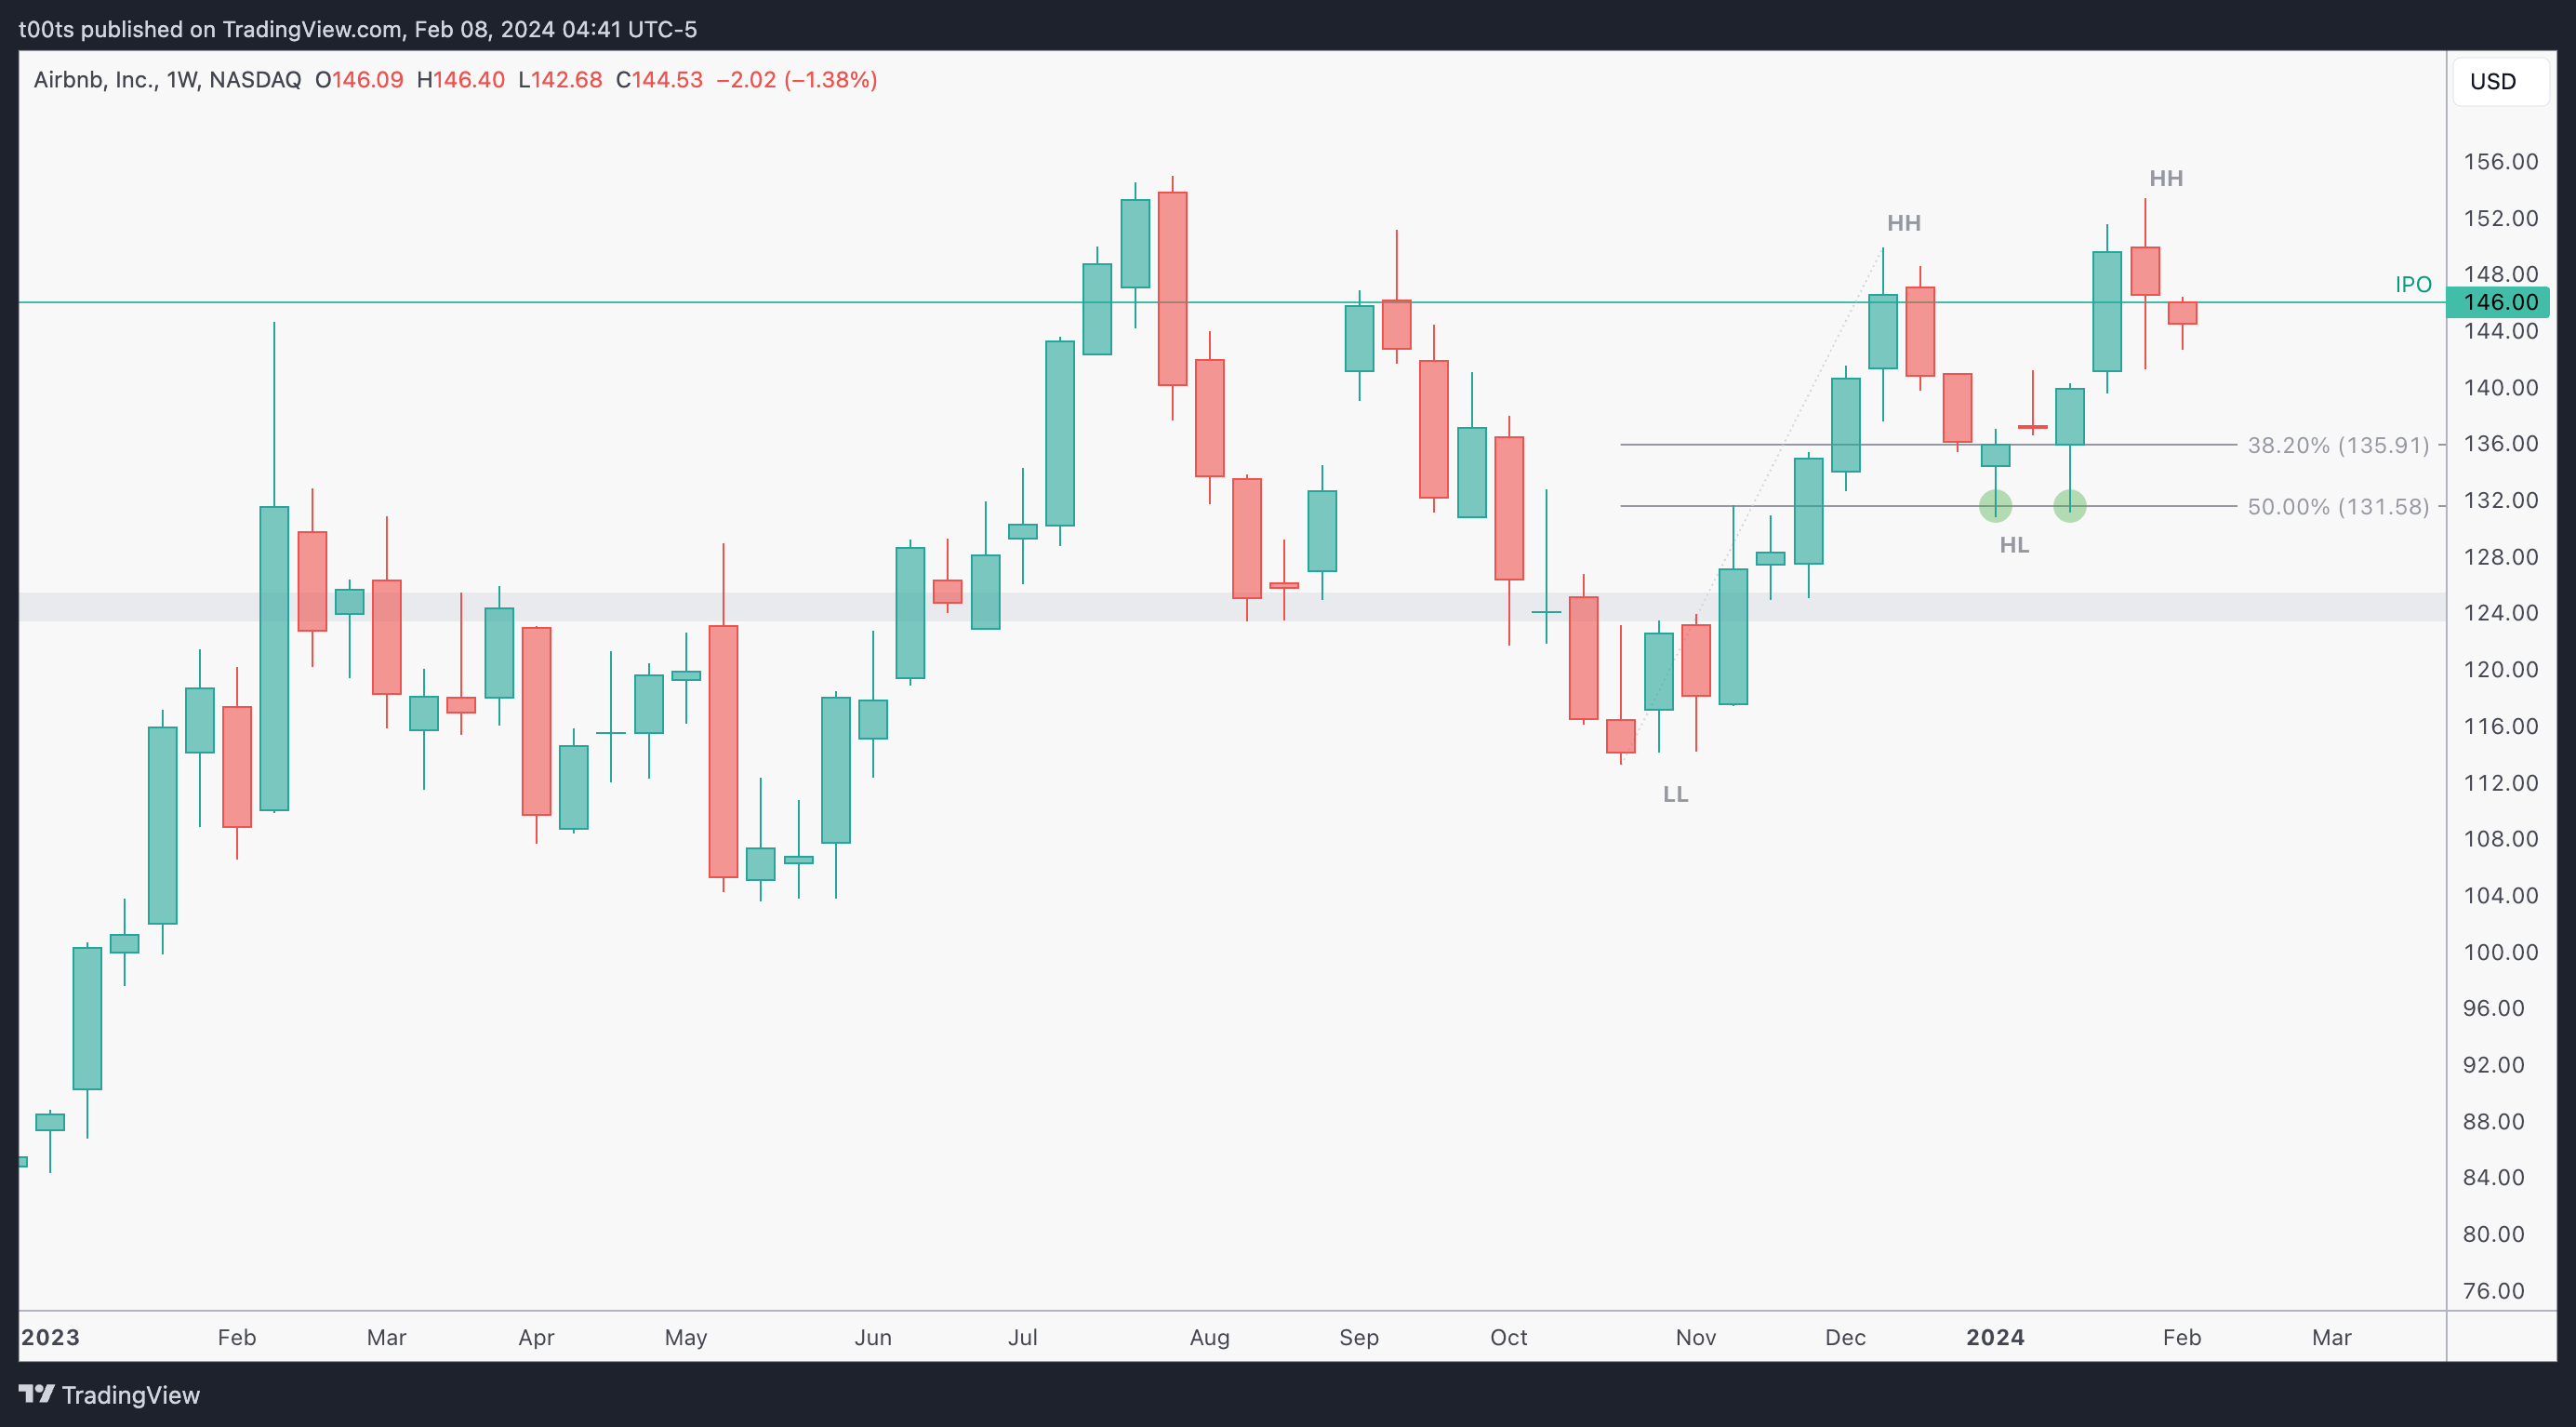
The weekly chart is sitting right under the IPO price once again. We've rejected at these levels the last 4 times price has touched them. We currently find ourselves in a multi-month uptrend, and after that clean double bottom off the 50% retracement it's a name that's naturally on watch for a potential breakout.
Daily chart
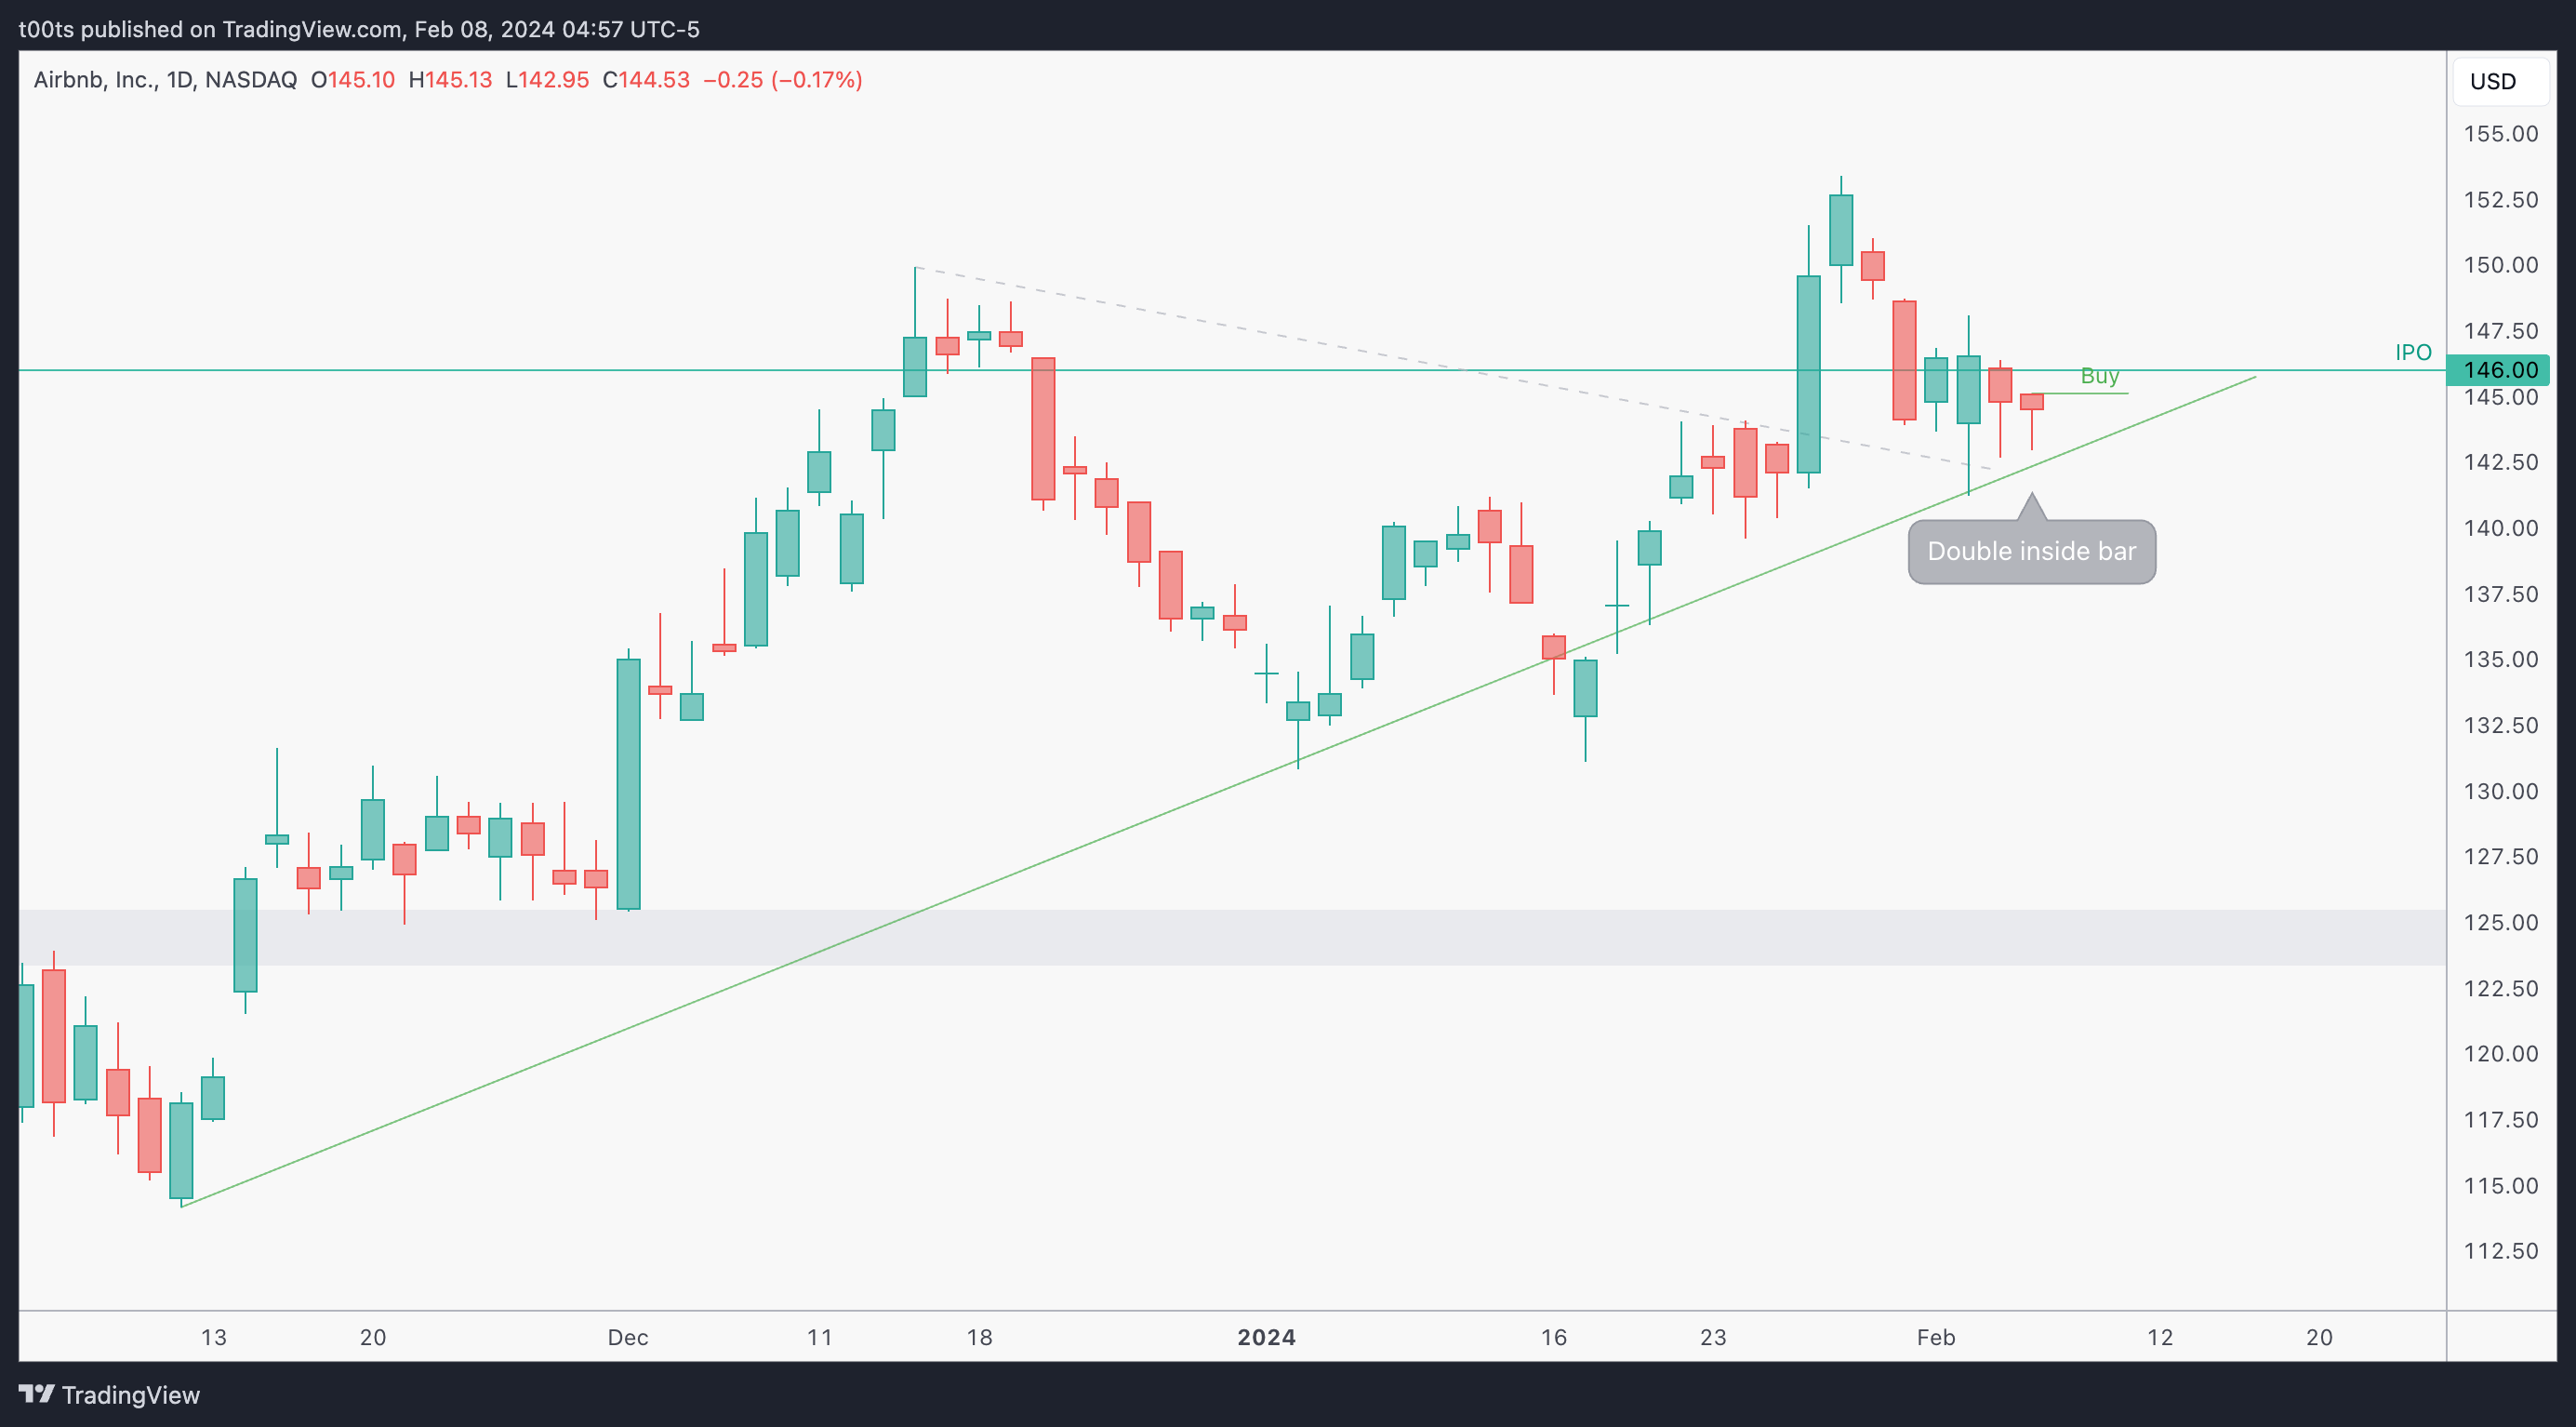
After a rather harsh pullback, price retests that green trendline and bounces strong, putting in that large outside green bar. Look at that double inside bar we get right after that. Both try to trade lower and both get bought up slightly, leaving clear bottom wicks and setting up for a potential move higher. In my opinion, very interesting chart.
Hourly chart
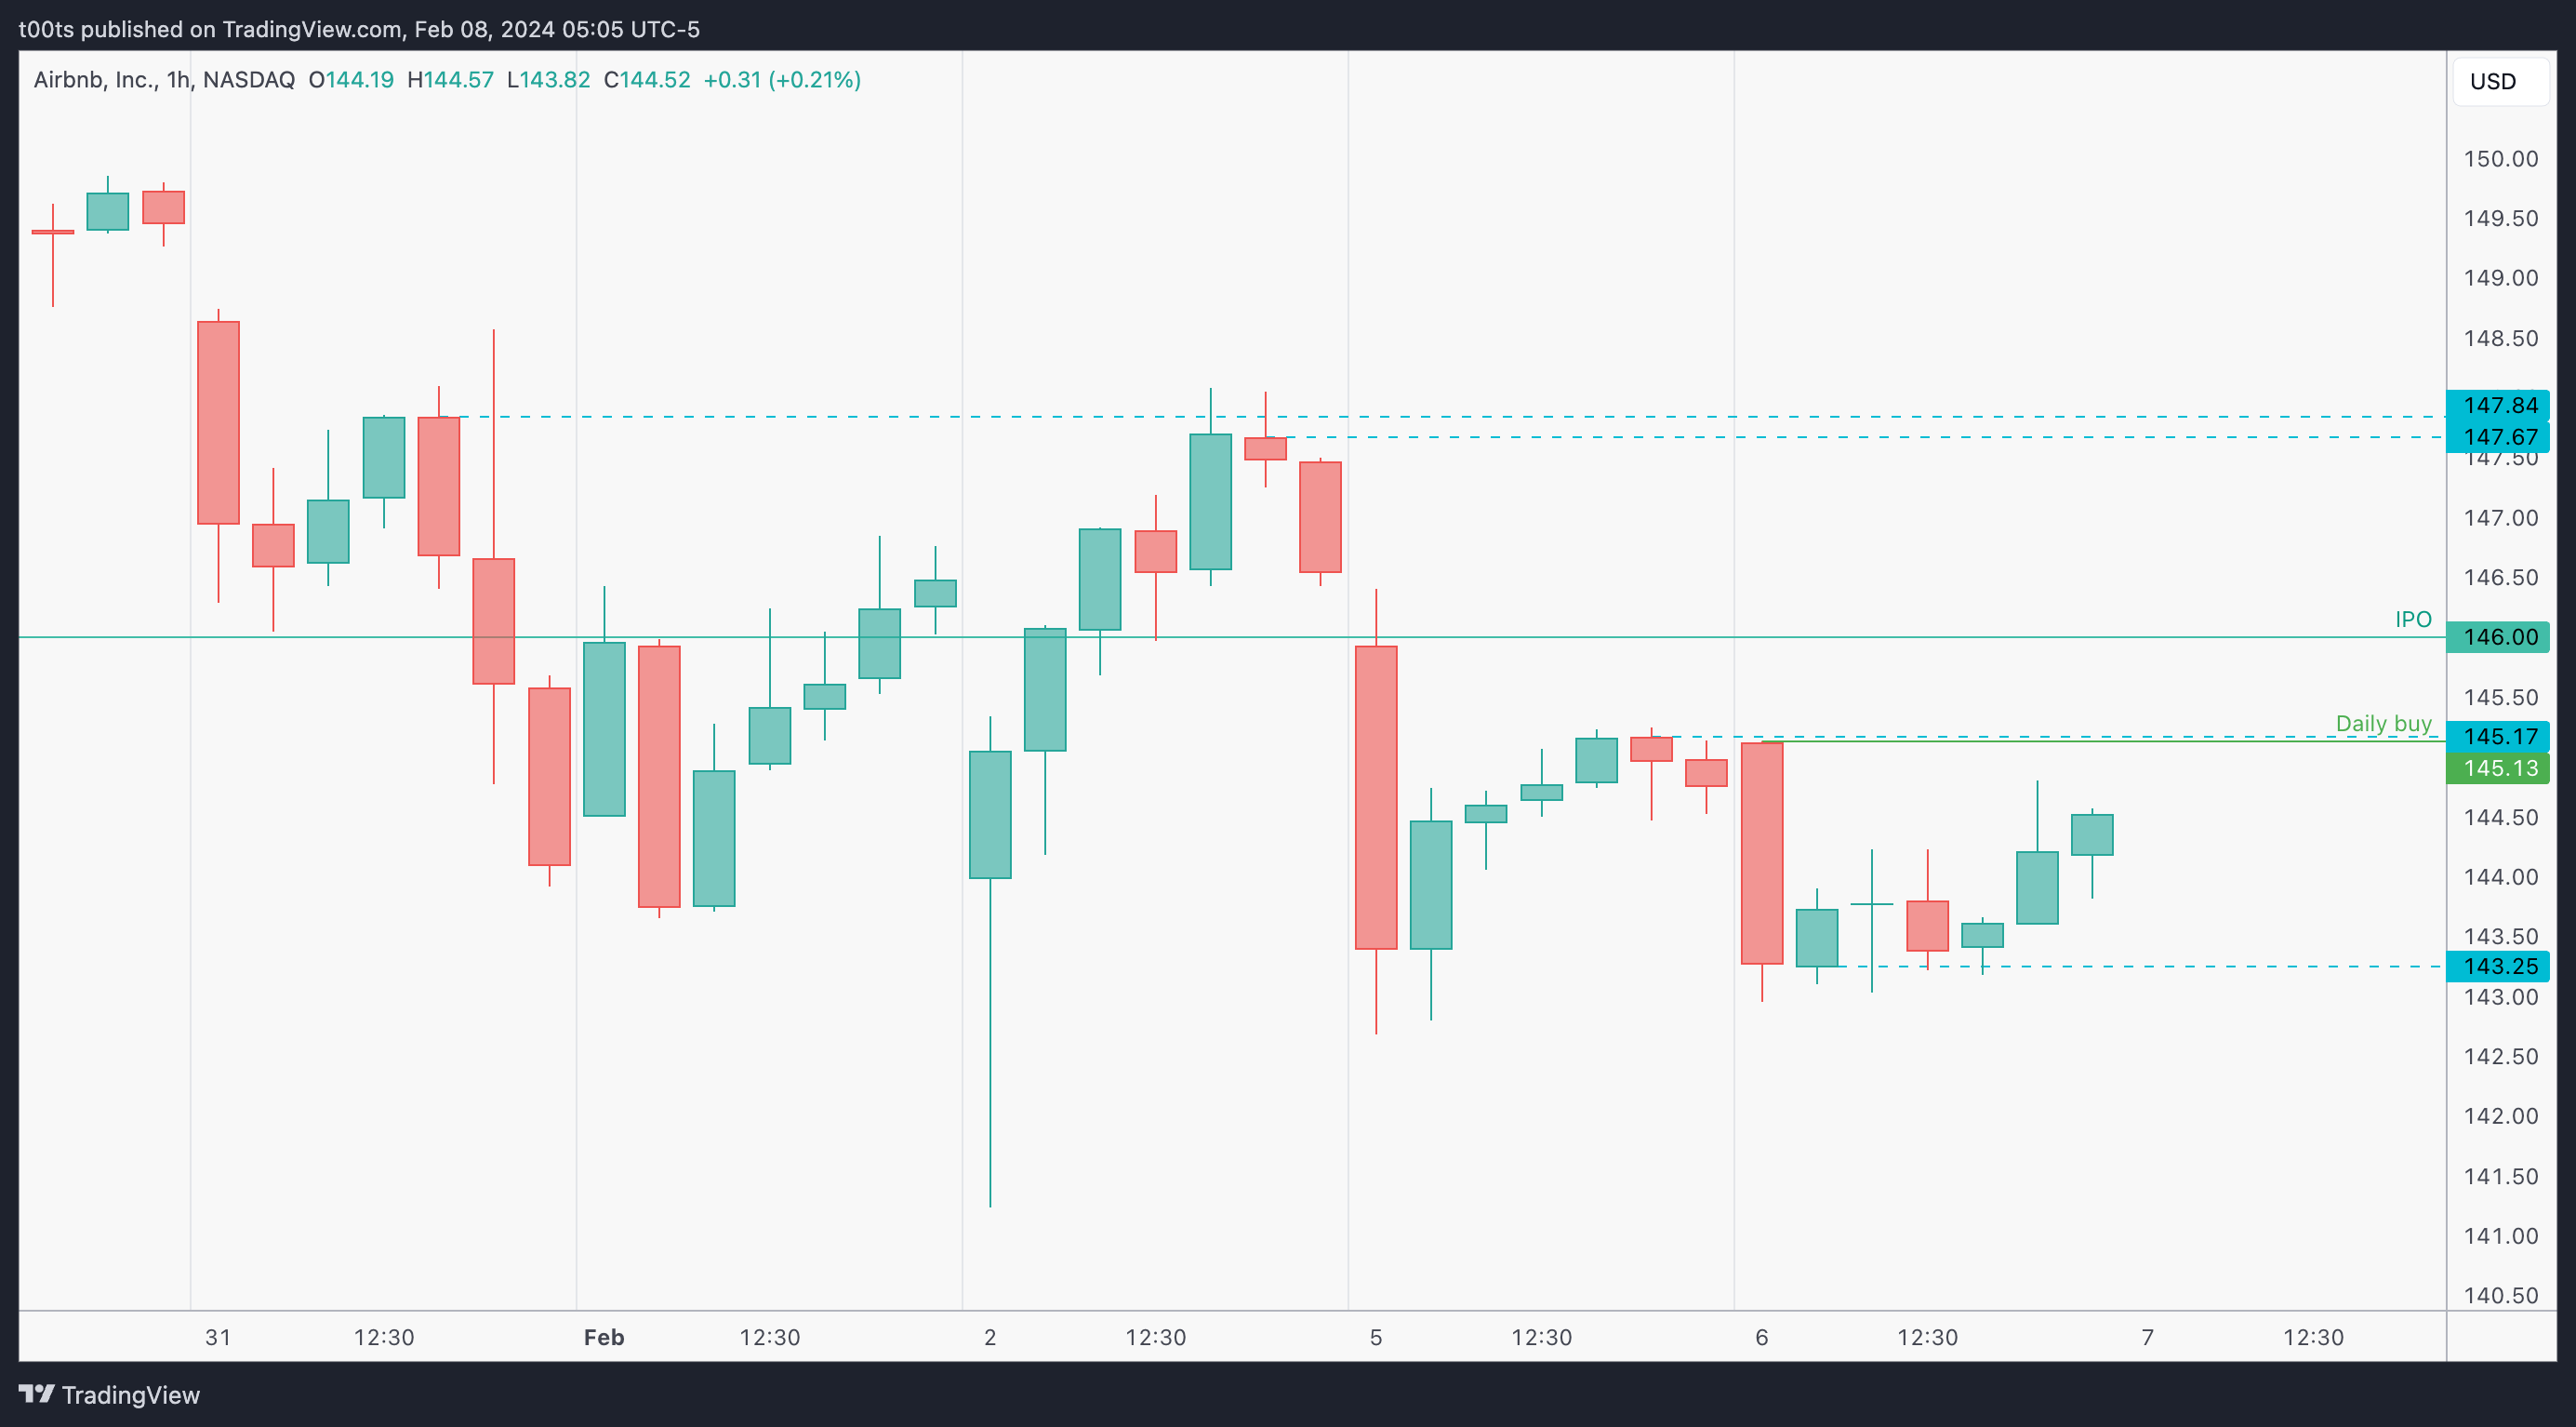
These past couple days have been marked by sellers trying to short against the IPO price and bring this stock down, while buyers kept holding the line and bouncing back towards the end of each session.
Our inside bar daily buy level matches an hourly level at the $145 area, so that's our main watch for any upside potential. If we do get selling at the open, we wouldn't want to see price trade below that $143 area for our long trade thesis to remain in play.
Pre-market action
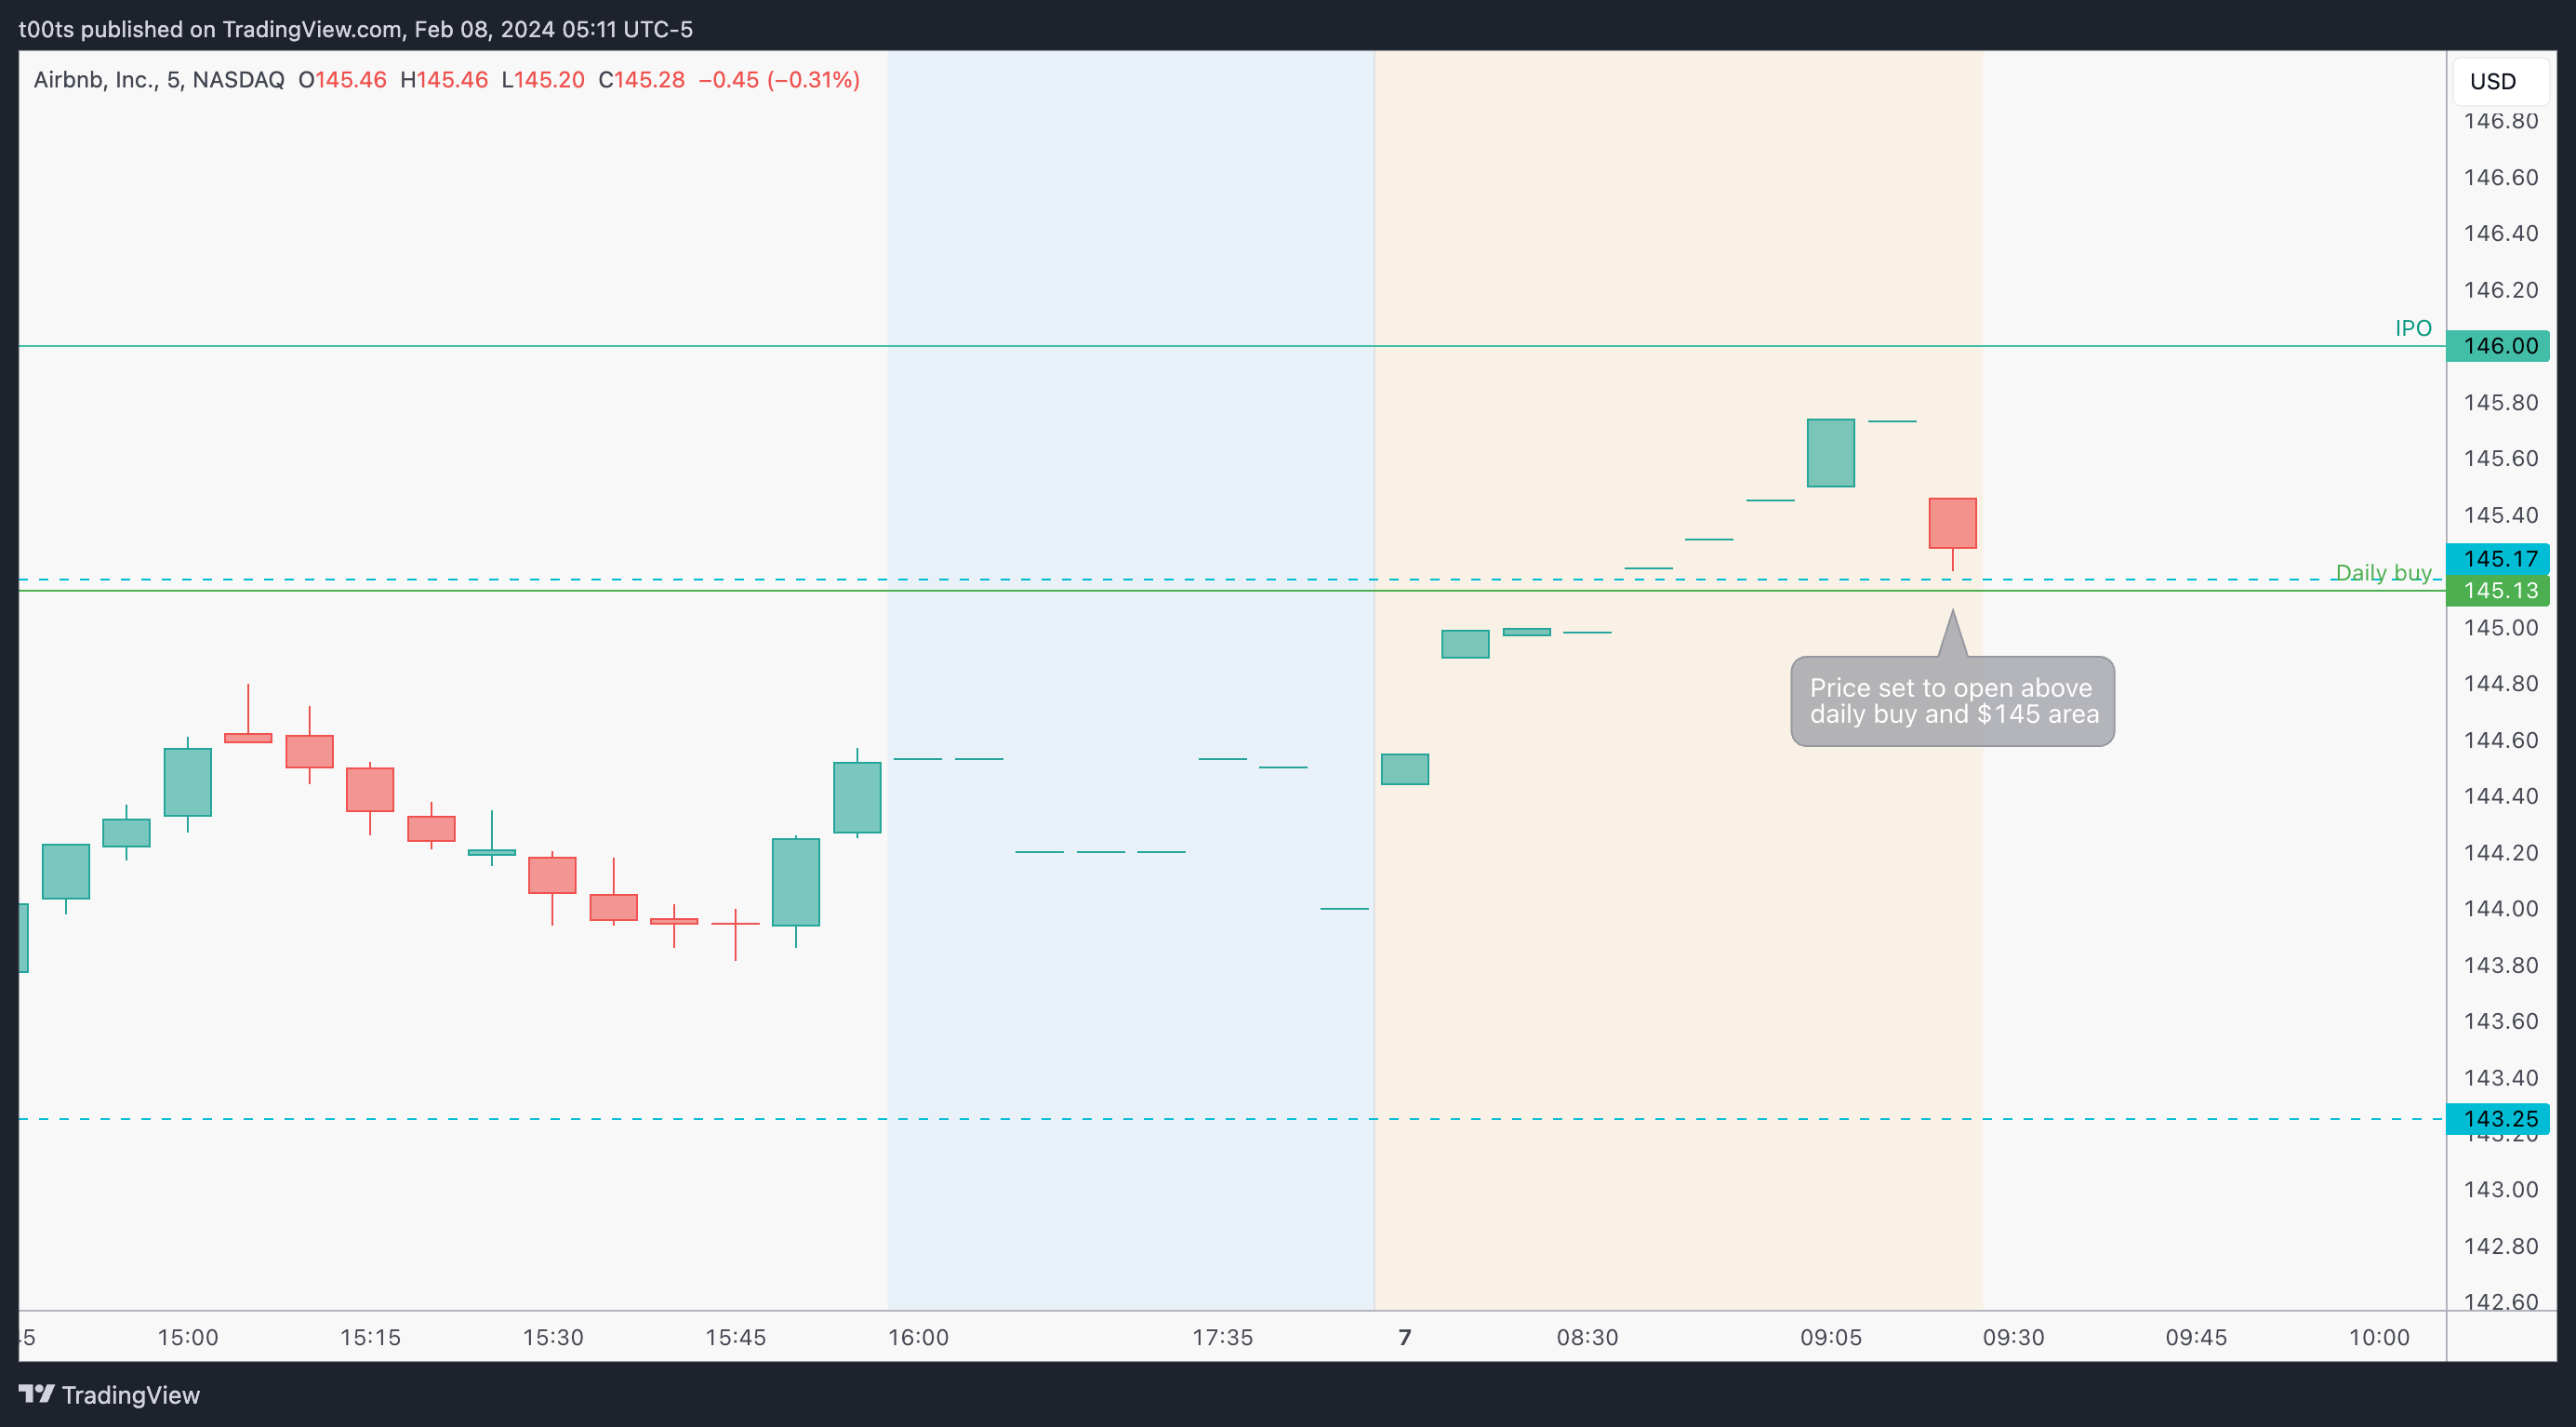
Very illiquid stock in general during extended trading hours, but just note how price is set to open above the $145 confluence area we just discussed.
The trade
Using our CPT Framework:
Cue(s)
Weekly uptrend with strong momentum
Attempting to breakout off a massive level (IPO price) for the millionth time
Daily chart setting up a (potentially) bullish double inside bar setup
Intraday cue: Price setting up a bullish inside bar bounce entry
Plan
This is not a fast stock, so we want to take our time and see what happens around the $145 area. We're interested in getting involved around those levels so we have confirmation of our trade thesis and can establish a tight risk for our position.
Trigger
Any bullish confirmation around that area.
5m chart

First bar resembles a bullish hammer (not quite) right at our $145 confluence area that sets us up for a solid entry to the upside, which triggers on the next bar.
Notice I used a tighter stop than the low of that initial bar, as we have the $145 area to use for a better risk-to-reward. Nothing wrong with that.
Regardless, the IPO level rejects and sellers immediately take over, triggering our stop. This behaviour is quite in-line with what we saw the past couple days on our hourly chart above.
I must admit I was lucky to be watching my TSLA position when this initial 5m buy setup triggered. I would've surely taken it and it clearly failed. I'm marking it on the chart for accountability and transparency.
At this point, all you really want is for a higher low to form with respect to the past couple days. I was eyeing a 5m and 15m chart to get some context and all I wanted was a reason to get involved.
Buyers hold the drop and, very conveniently, set up what in my opinion is a very bullish looking inside bar which can be used as signal bar to take an entry below the $145s.
While I agree it's not ideal to go long below our line in the sand, here's where being a human and not a robot gives you that slight advantage to make these decisions in real-time, anticipating a potential breakout and move higher, which is exactly what we got.
You'll notice my initial stop was at the lows of the day, as I am expecting to swing this name and looking to capture a bigger move.
However, as soon as the stock breaks out of the $145 confluence area, I aggressively trail my stop (T1) to the lows of the bar that broke it.
Same thing when price breaks the IPO price mark (T2).
The next trail (T3) is on the first pivot after the failure to go higher, which conveniently matches the previous rest bar lows.
There's a lot of chop for the next couple hours. Honestly, you should avoid watching chop at all costs. Not only to avoid mental fatigue, but more so because you'll start seeing potential exits and adds everywhere. Chop by definition is all failures and failed failures. You need to be able to identify when these are happening in choppy conditions and stay away from doing anything stupid. Use alerts instead!
This is actually one of the hardest things problems I'm currently facing on my algorithmic trading efforts.
When my stop level alert triggered I opened up the chart and noticed a lot of choppy action leading to it. As far as I could tell, there were no real efforts by sellers to bring this stock down, so I watched for 10 minutes as price failed to close below the stop and started trading higher.
Soon enough, the breakout alert would trigger and here's where you want to trail your stop one more time (T4), as we don’t want price to lose that $147.67 - $147.84 area.
There was an opportunity to add (marked on the chart) which I personally didn't take advantage of.
Closing notes
Although technically price triggered the stop right before the closing bell, I decided to hold my trade. If you've been following, you'll notice I've been trying to catch multi-day longer move that gets some follow-through. First it was ARM (just popped +25% on strong earnings, ouch!), then it was TSLA, which I still have some exposure to, and now ABNB.
I like how the daily bar closed above the critical IPO price. We'll see what the rest of the week brings. Airbnb has its earnings release next Tuesday. Depending on the price action that leads us into the announcement, I will consider holding it through.
I am posting one trade writeup every day throughout 2024. I focus on large caps using levels and price action. The subscription is absolutely free and will always be. I will strive to provide value by offering clues and ideas for you to enhance your edge. Let’s grow together!