

Higher timeframe context
In a day where not much was going on, this name stood out to me.
Keeping this one simple because there's really no need to overcomplicate something that was indeed so straightforward.
I added a personal note on stops that you might find interesting.
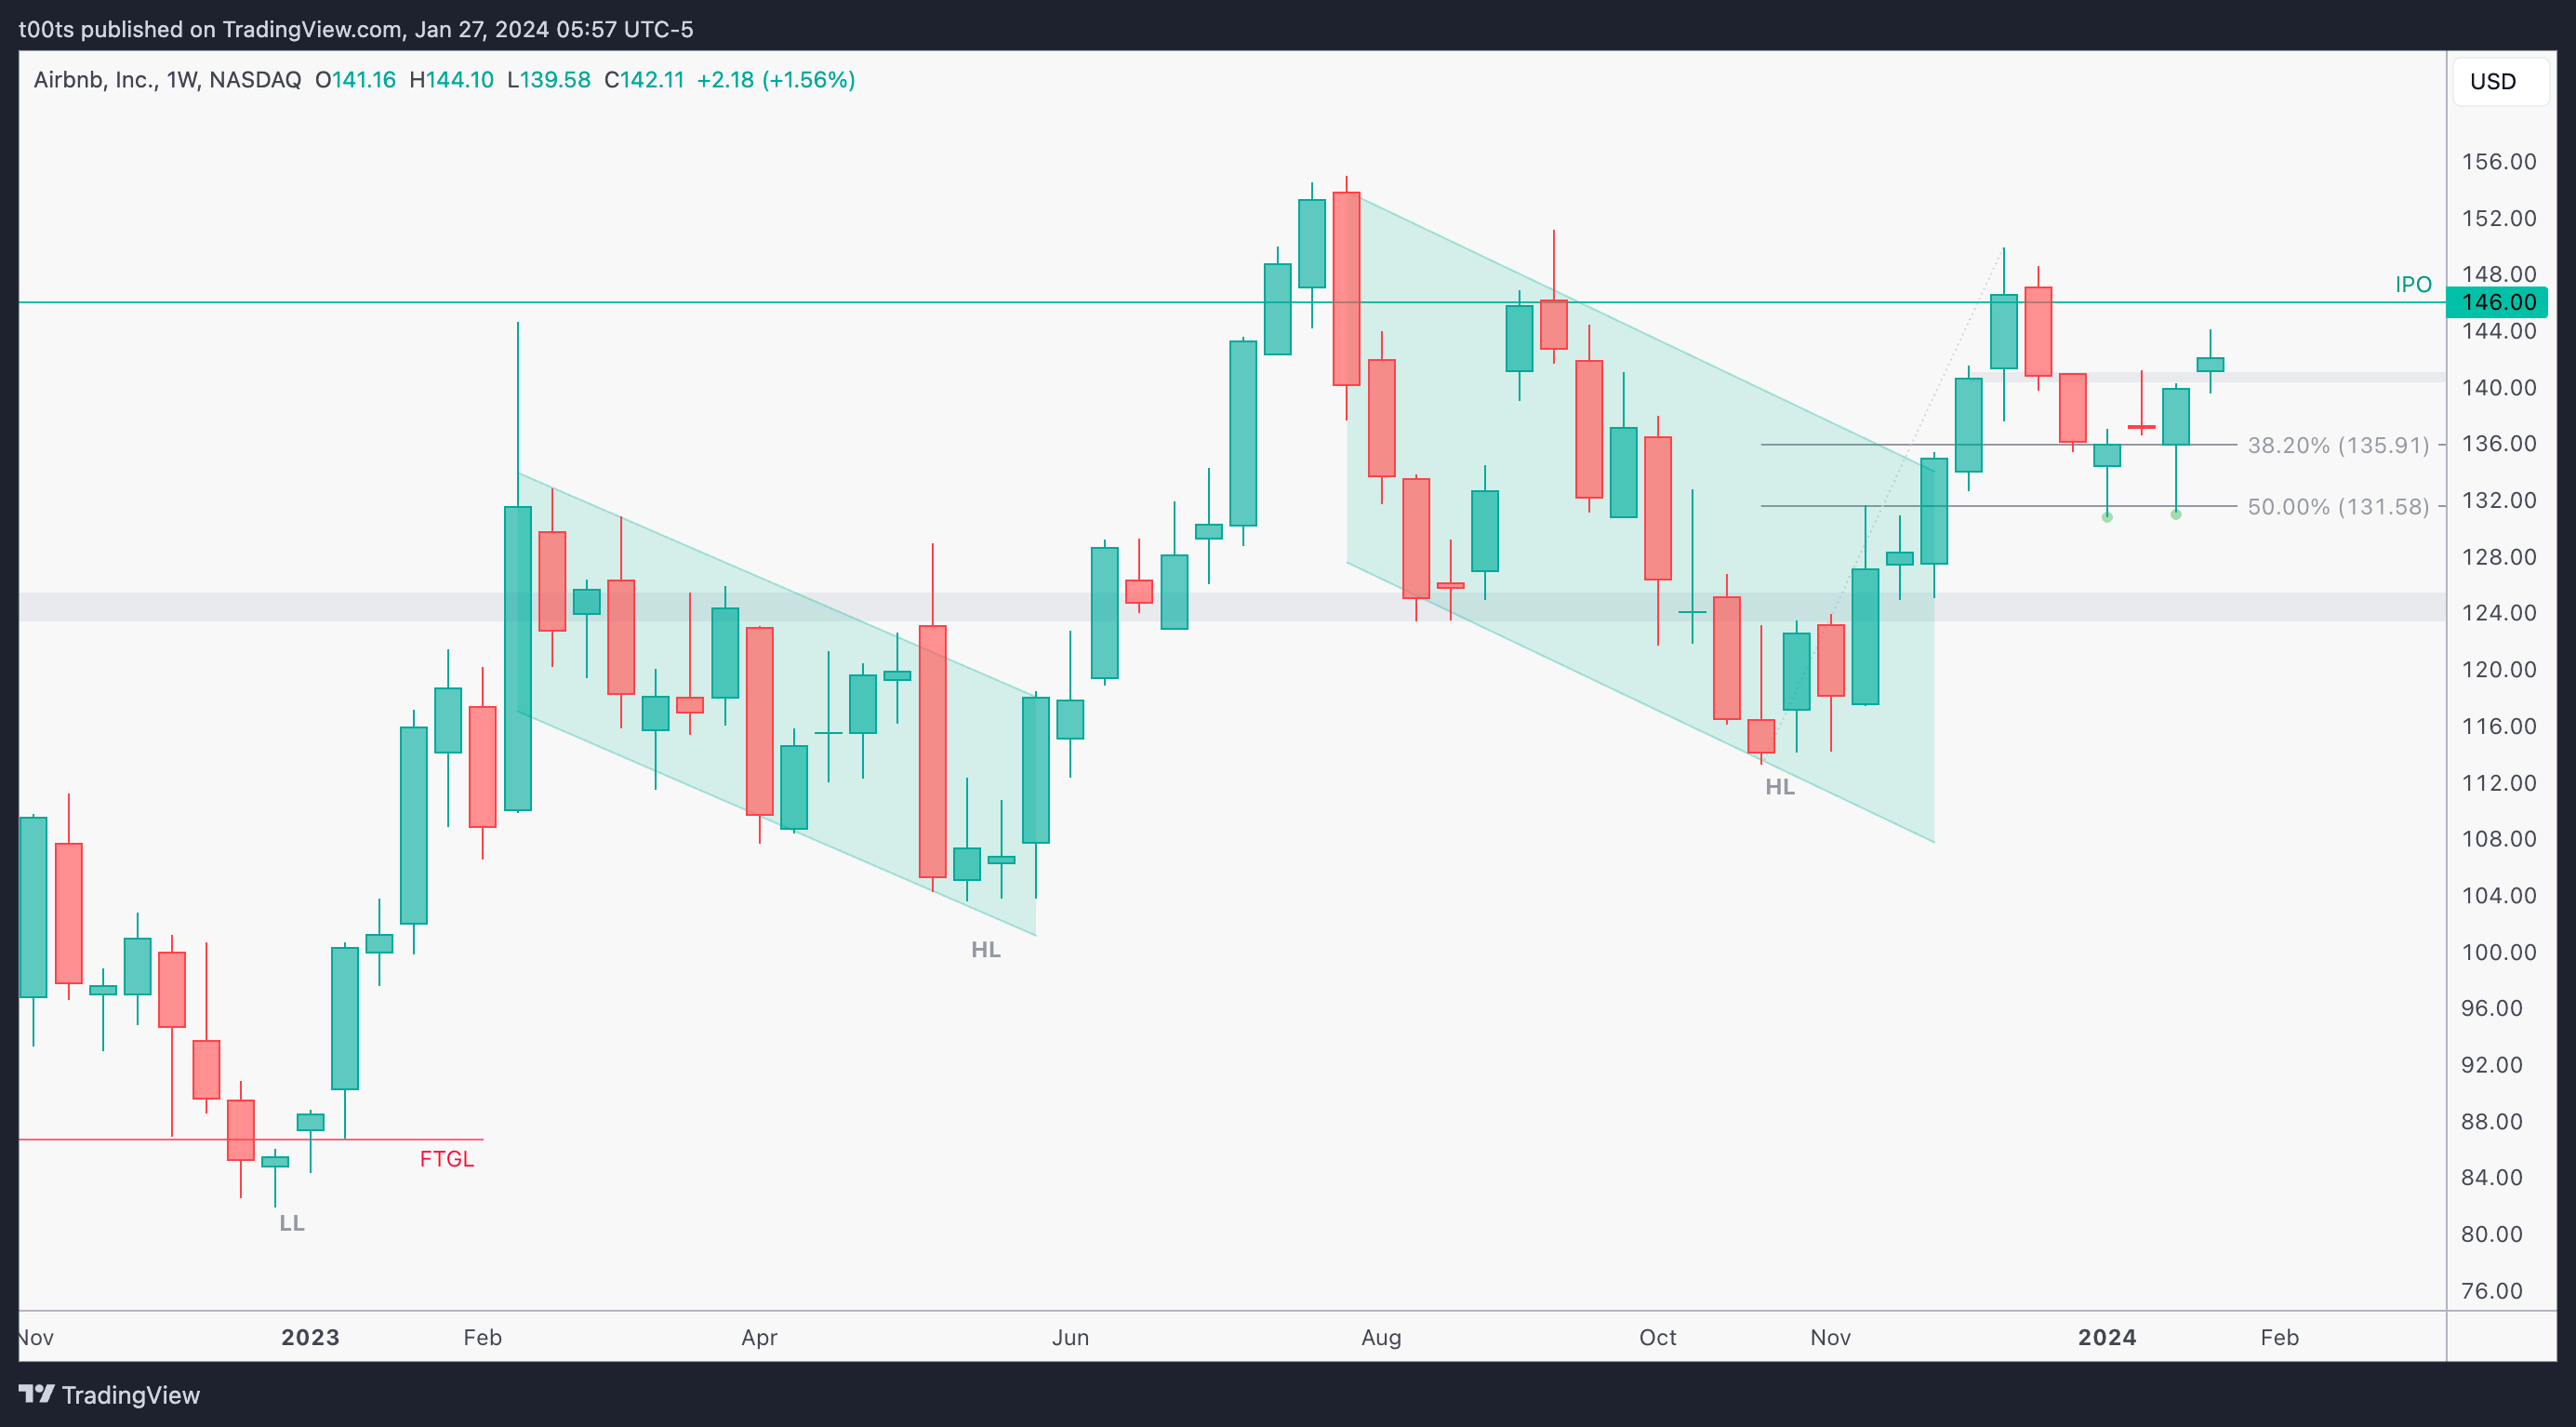
Weekly chart
One of those weekly charts that immediately stands out. In a broader level, stock has been putting in higher lows since the trend flipped on early 2023. Price has seen a couple upswings with their corresponding flags. While this last flag breaks the support area (marked in gray) buyers pick the stock back up to form the third leg.
The IPO price seems to be a critical level in terms of resistance. It keeps rejecting at every attempt from buyers.
We're currently at an interesting spot, as price has pulled back and bounced off the 50% FIB retracement level from this last leg up, setting up for a move higher. The keen eye will also observe a failed failure pattern in recent price action. We know these patterns often lead to great trades.
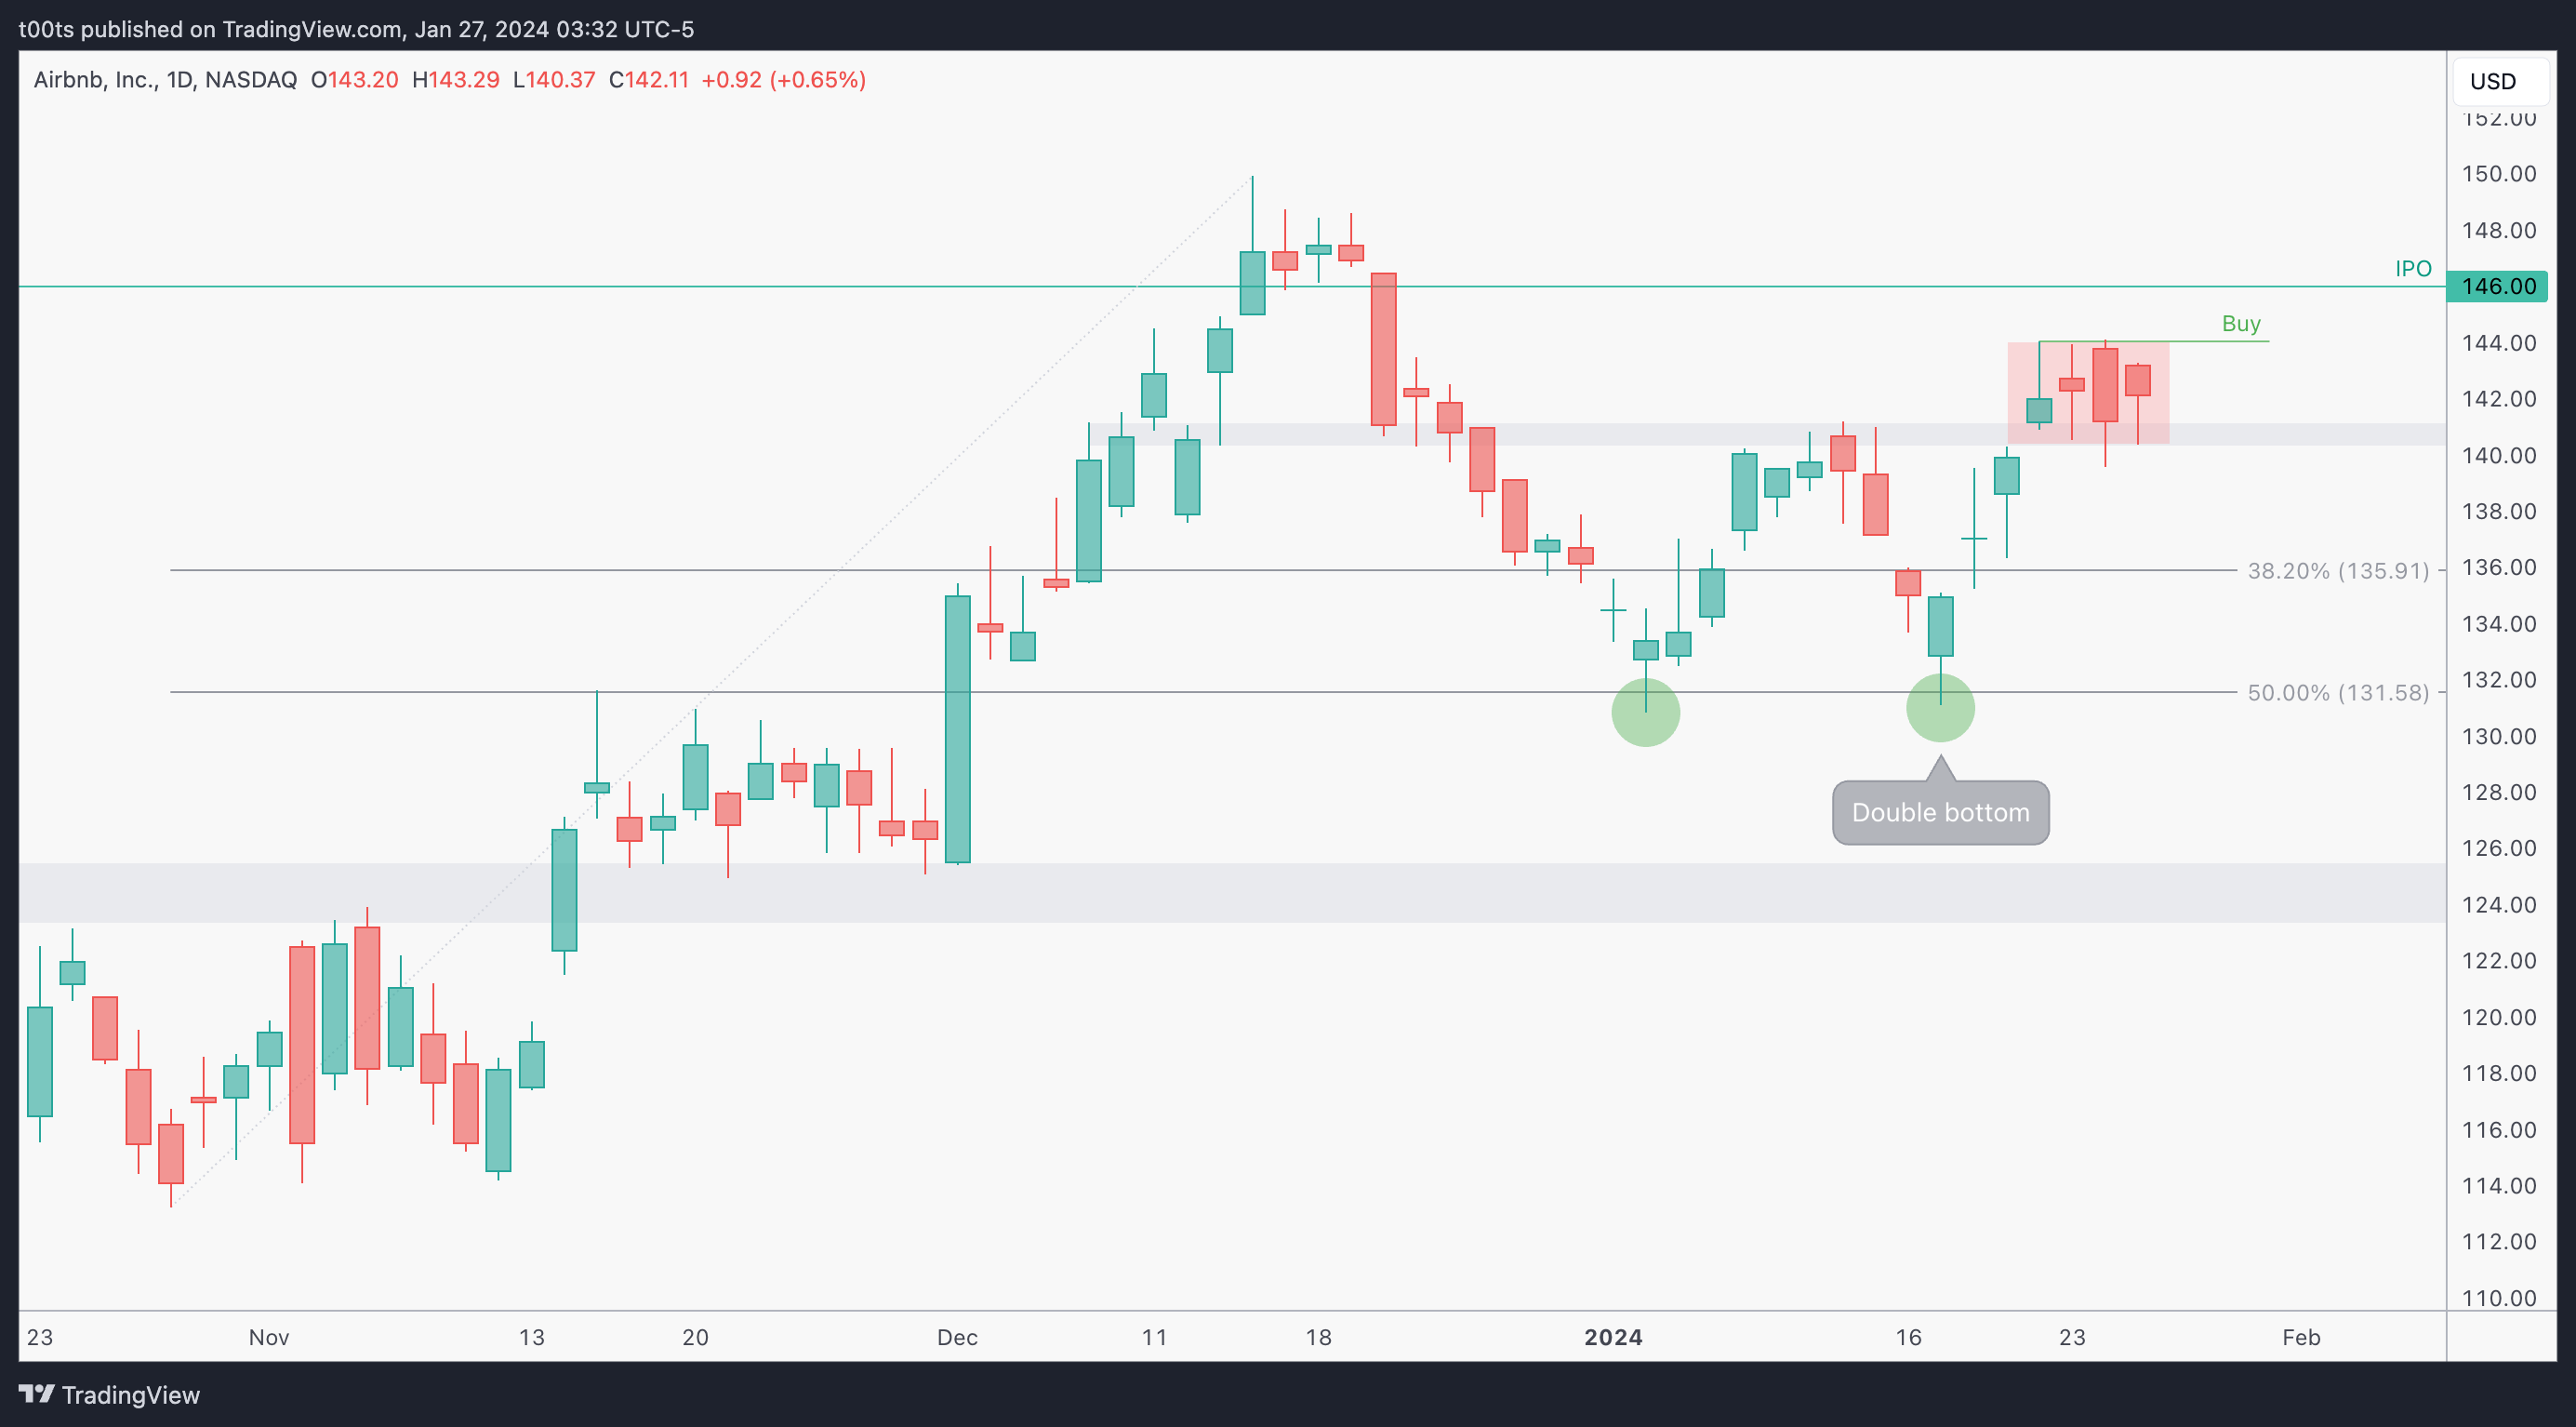
Daily chart
Daily chart is currently ranging (or “bull flagging”) after a confirmed double bottom. Buyers keep stepping up at the $140 area as the stock gets ready to make a move into the IPO price and beyond.
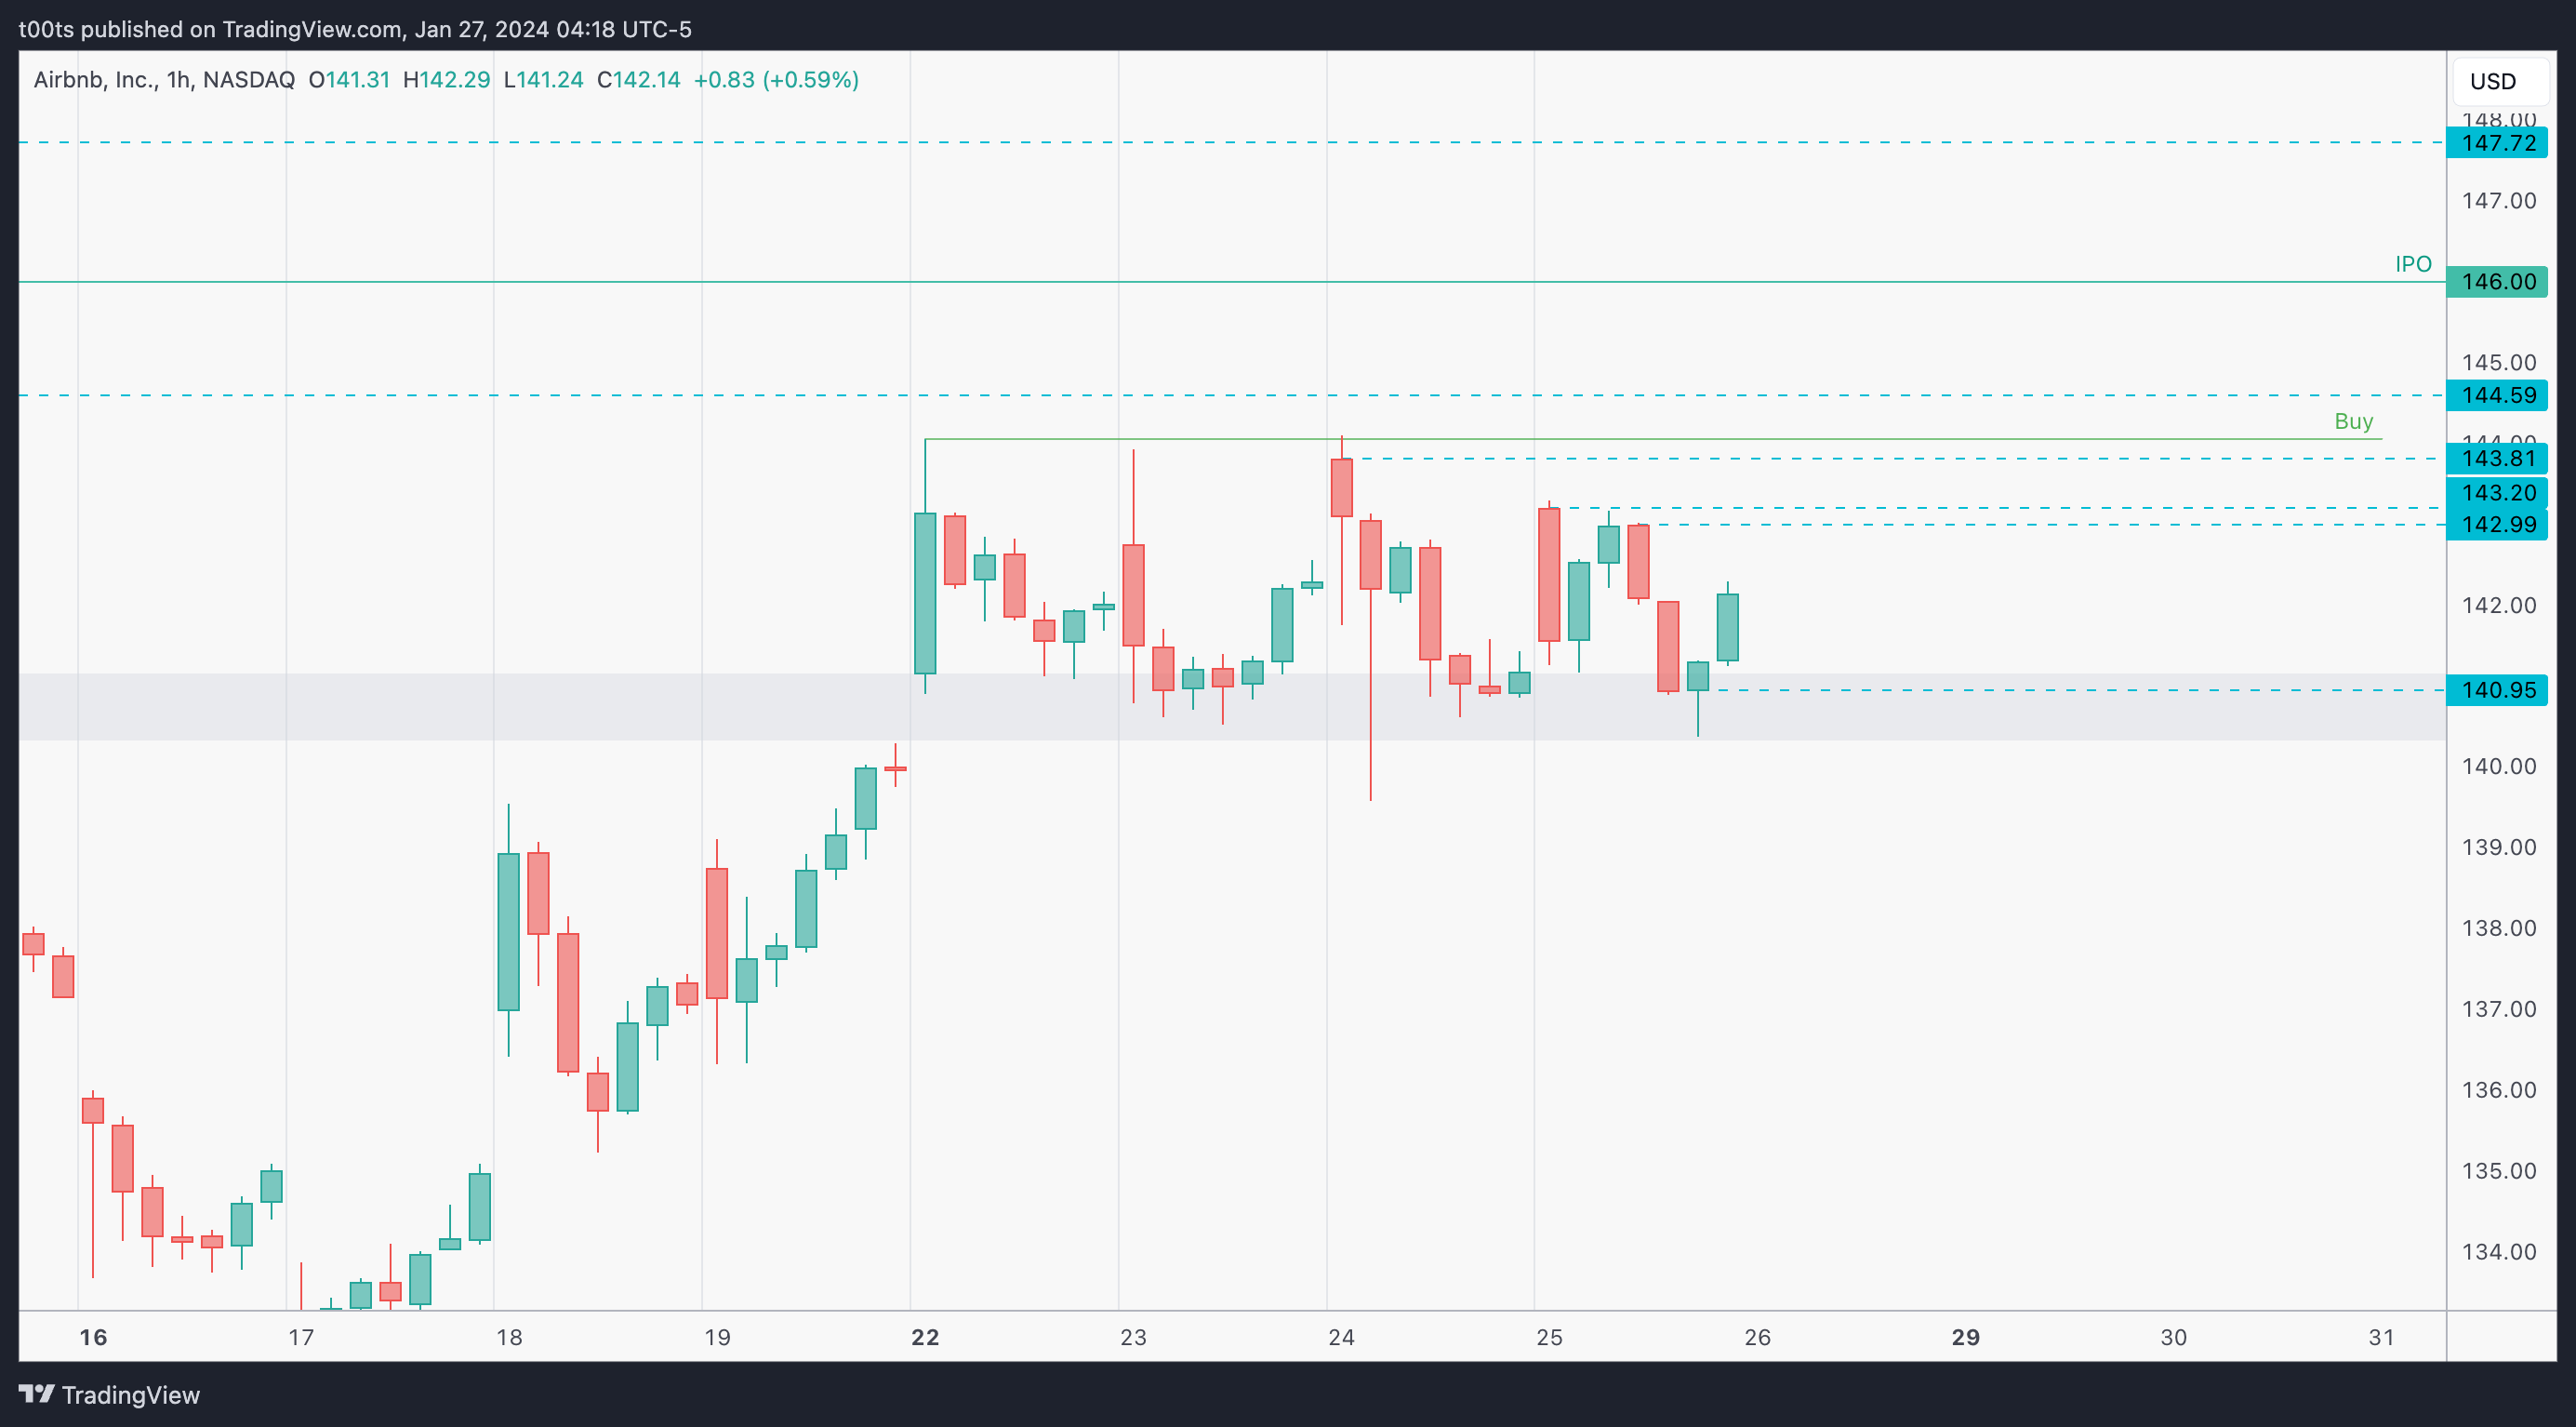
Hourly chart
The hourly chart just confirms the range we saw on the daily chart and gives us further insights on levels we can use to trade off of. Bull flag is clear.
Pre-market action
Pre-market action was irrelevant to this trade. Stock opened flat
The trade
Using our CPT Framework:
Cue(s)
Higher timeframes setting up for a move higher
Failed failure pattern on the weekly chart
Intraday cue: Price flagging above a level after an initial move up
Plan
Wait for a buy signal and jump in when triggered.
Trigger
Price trading above the signal bar.
5m chart
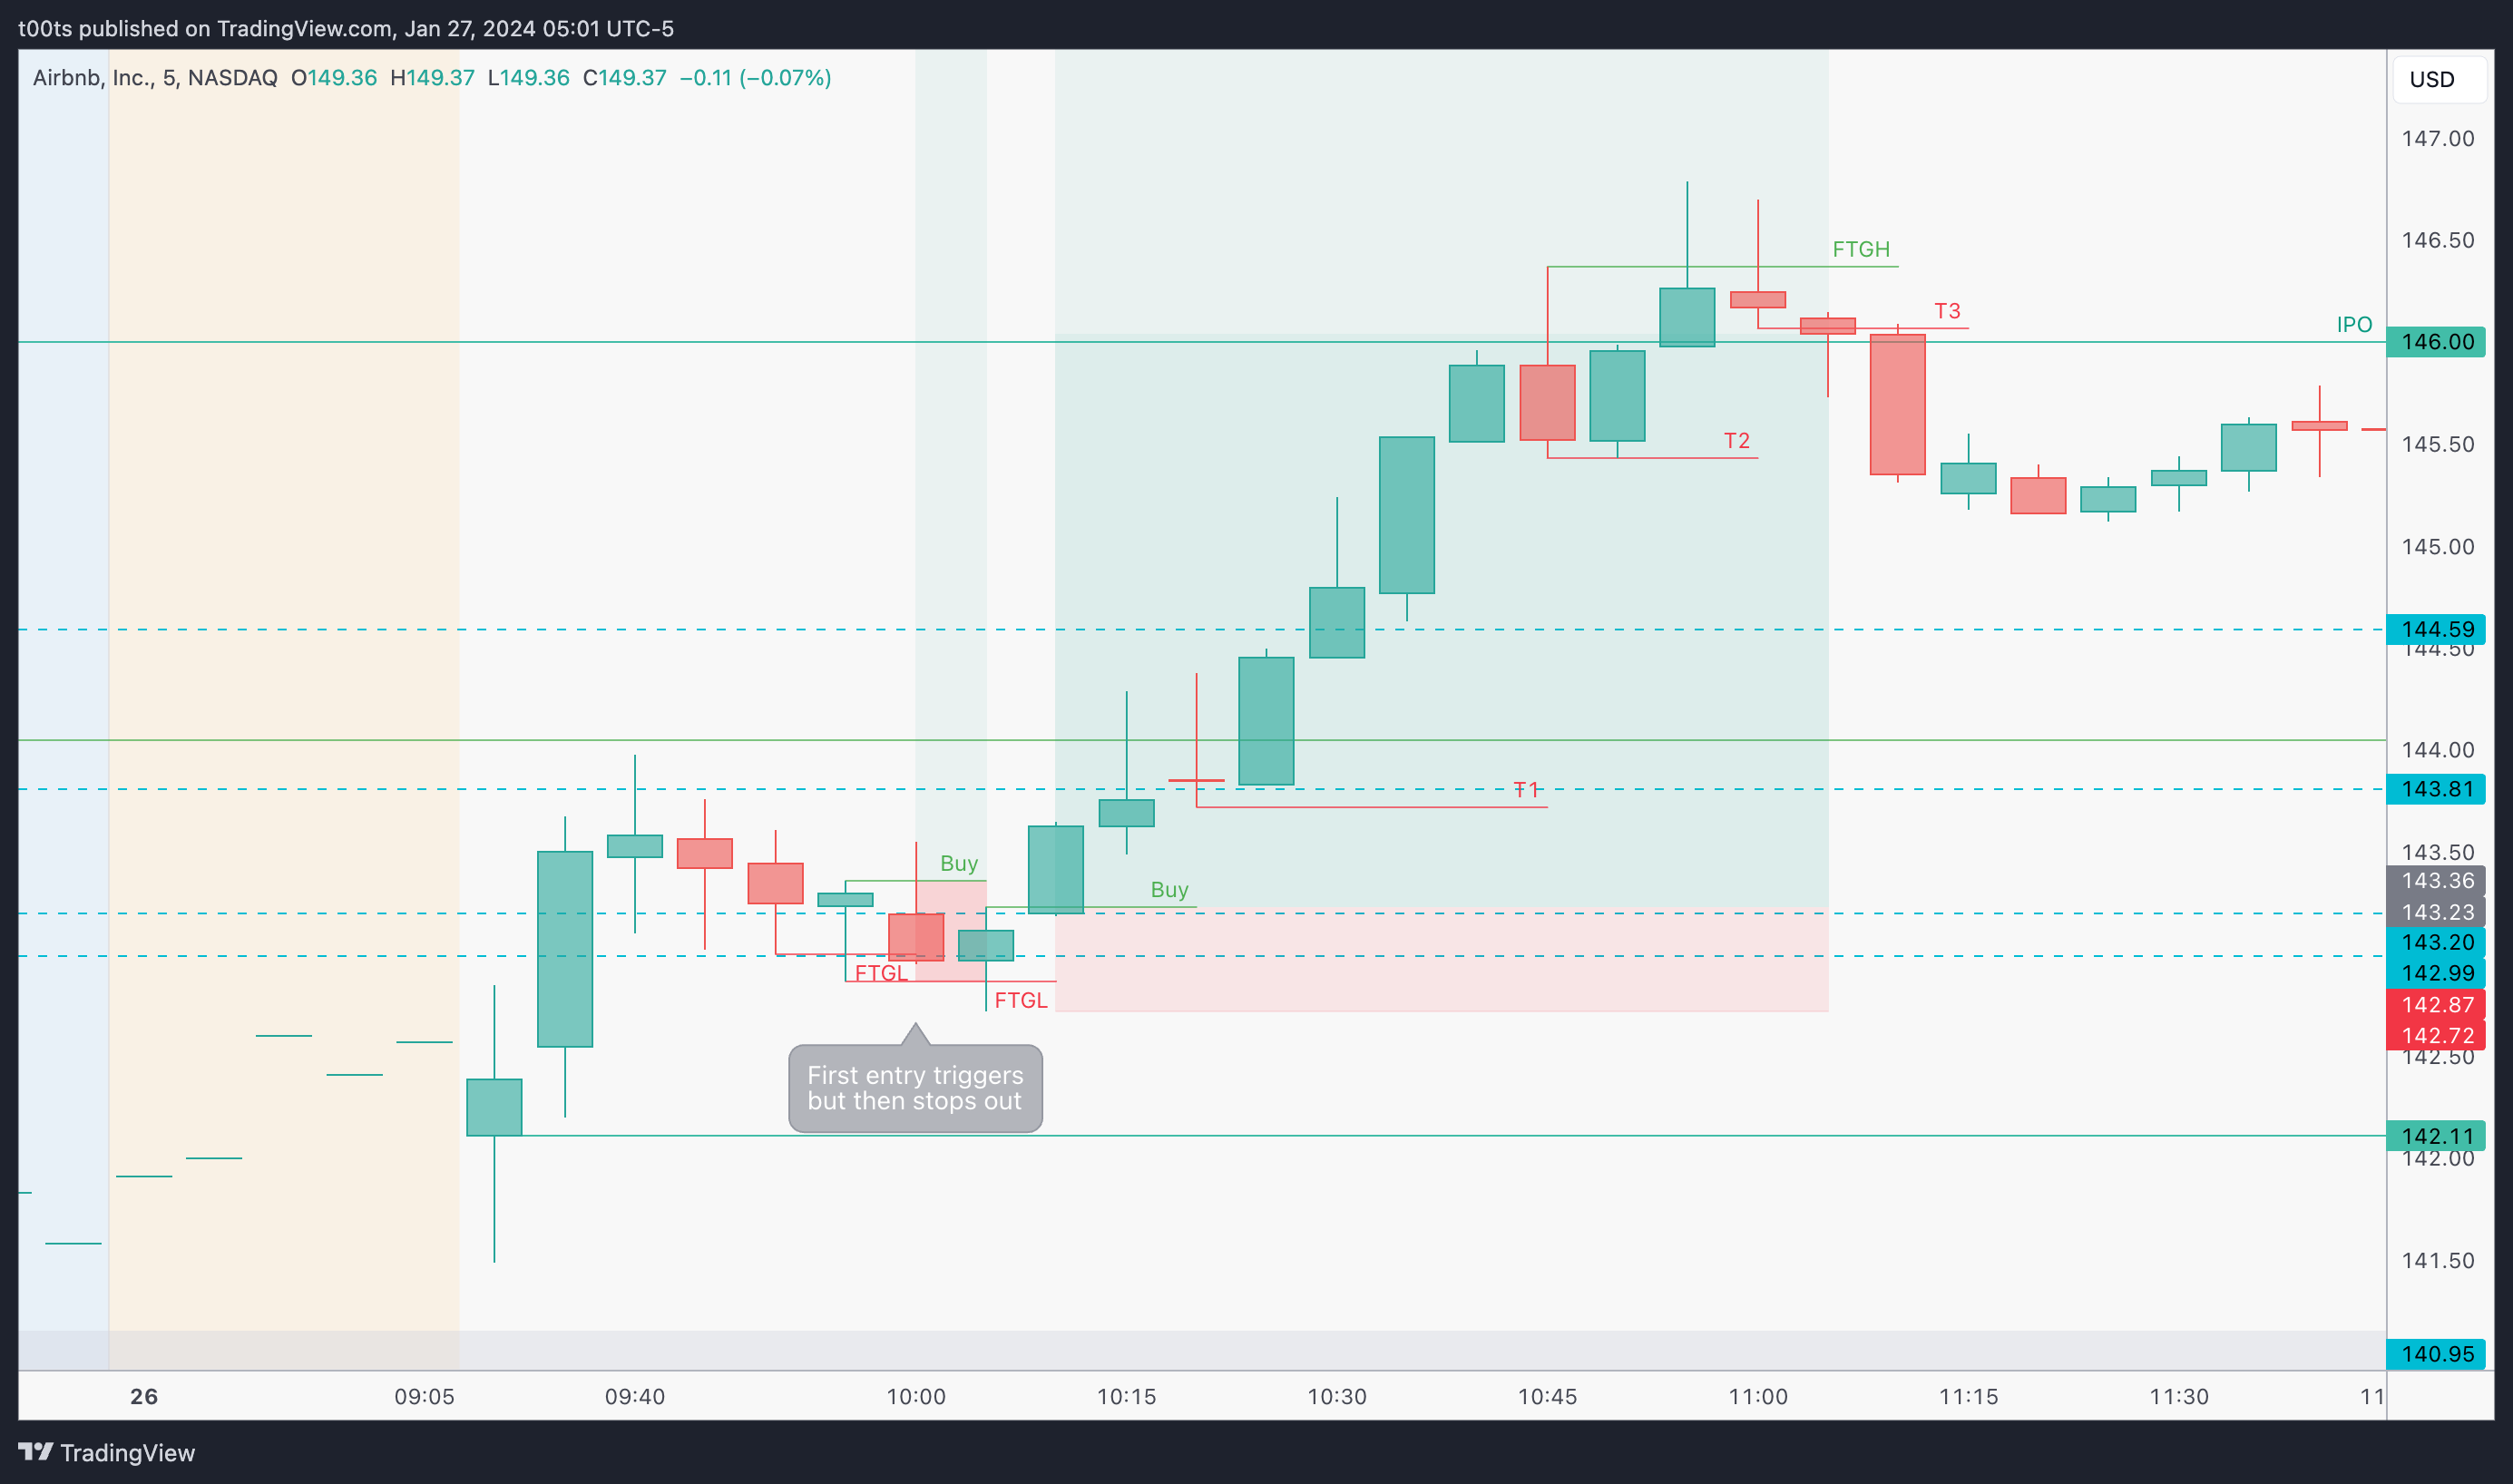
The start of the day was very choppy. Unless you got caught in something else, it gave plenty of time to prepare for good trades. I was looking at AMZN around the open but the move didn't get any follow-through. I then found this gem scanning through my watchlist.
It's an interesting trade because the first attempt actually has all the ingredients we're looking for but still stops us out at a loss. The same bar that stops us out sets up another signal bar for the trade that worked.
A note on stops:
I've had issues in the past with stopping myself out of trades. Sometimes I would wait for the bar to close, sometimes I'd look for the next level below, and other times I'd find any excuse to just hold onto my belief that the trade would work.If you struggle with this, the fix is pretty easy, and it all takes place before the trade.
As a trader, before getting into a trade, it is of imperative importance that you have two things clear:
1. Accept there's a [high] chance the trade might not work.
2. What does your trade not working exactly look like?If you have these two things clear, you'll execute your stops with no hesitation. Most stop problems happen when you haven't accepted the failure scenario, and then when it hits you don't know how to react. But that's not enough. You also need to define when exactly you're going to press the button. And here's where you can spice things up a little bit.
Not all stops are equal!
I've found that I have 4 different stop scenarios in my system. Let me share them with you.
Entry stop: The stop we place to protect our entry.
I'll respect these to the tick. The moment they trigger I'm out. Can always get back in.Trailing stop: The stop that we trail as the trade moves in our favor.
If the move is still trending I'll wait for a bar close.
If there are signs of potential trend flips (such as failures), I'll take the stop to the tick.
Profit target: Our target for the trade. I'll usually take some off just to lock in some gains, but I've found it's best to wait and see how price reacts to your target.
Back to the trade.
As we can see on the chart above, the trade works immediately after our second entry. These are the trades we like, and the only way to find them is to choose your stocks properly. That's why we always go from top to bottom, every day, as boring as it may seem. There's two strong rejections at the top of the range but none trigger a stop. Price keeps climbing and al the shorts that had piled in on those two 5m wicks are forced to cover, leading to that strong break of the $144.59 level.
Our next rejection happens at the IPO price. What a surprise. This level has proven to be a tough one for the past few weeks. We trail our stop after price fails that level, but it still never triggered it.
Buyers managed to make a new high of day and break that wall at the IPO mark. After two consecutive failures we trail our stop and it immediately gets hit, leaving us with a very respectable 5.6R trade. Next week's 145C were around 70% profit at this point.
While it's true that ABNB ran another 5+ points into the end of the day, the overall market had a mid-day sell-off which would’ve made it a tough hold, especially given it's current overextended state. It wasn't clear if it would hold or pull back stronger.
Closing notes
I was more than happy with this move to end the week, no need to overstay on a Friday. Your confidence PnL is far more important than the number in your account.
I am posting one trade writeup every day throughout 2024. I focus on large caps using levels and price action. The subscription is absolutely free and will always be. I will strive to provide value by offering clues and ideas for you to enhance your edge. Let’s grow together!