

Higher timeframe context
ARM stock has been lagging with respect to its fellow chip sector peers recently. As stocks like NVDA, SMCI, and AVGO continue to make new highs, others like ARM, QCOM, or even AMD have been pulling back.
We already covered what Arm actually does. For anyone not familiar with them, give this intro a quick read and you'll understand what I'm talking about. In a nutshell, despite belonging to the semis sector, they don't really produce any chips. Regardless, it's a recently new IPO and their presence is prominent in top-of-the-line products. Quite possibly the device you're reading this post on runs on an ARM chip.
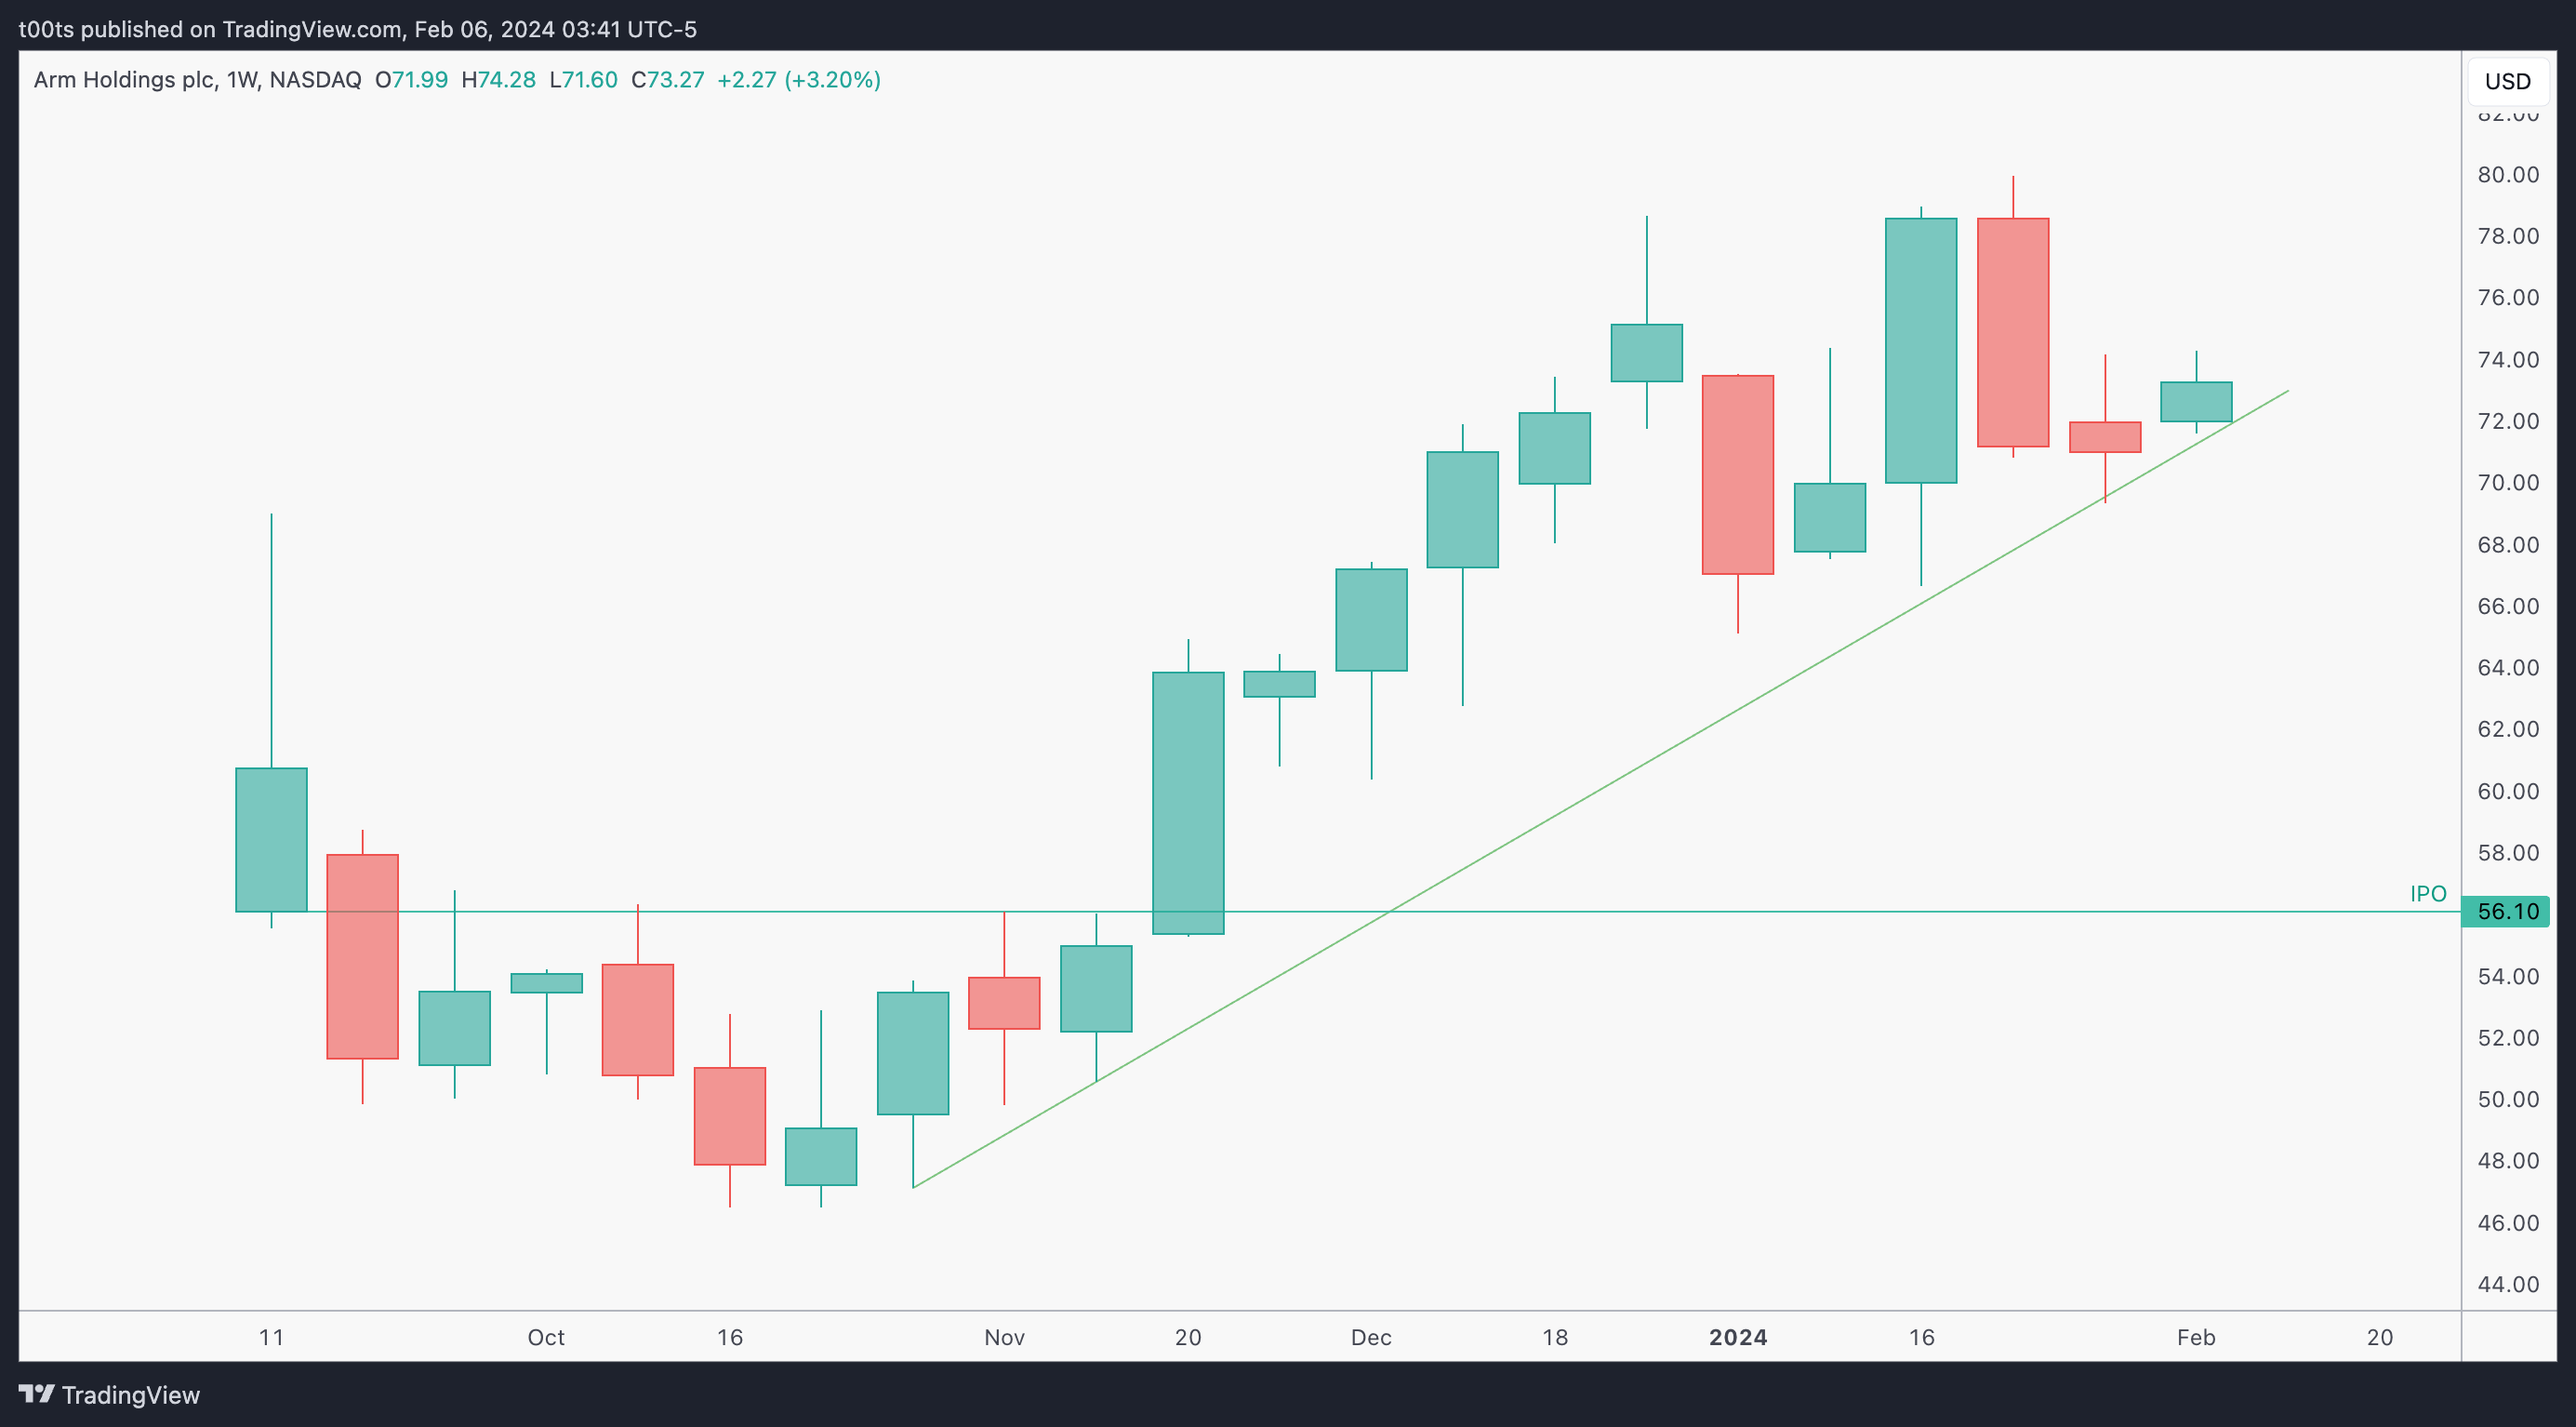
Weekly chart
However you quantify an uptrend, I think we'd all agree price still fits those conditions. We’ll see in a minute that the details start on the daily chart.
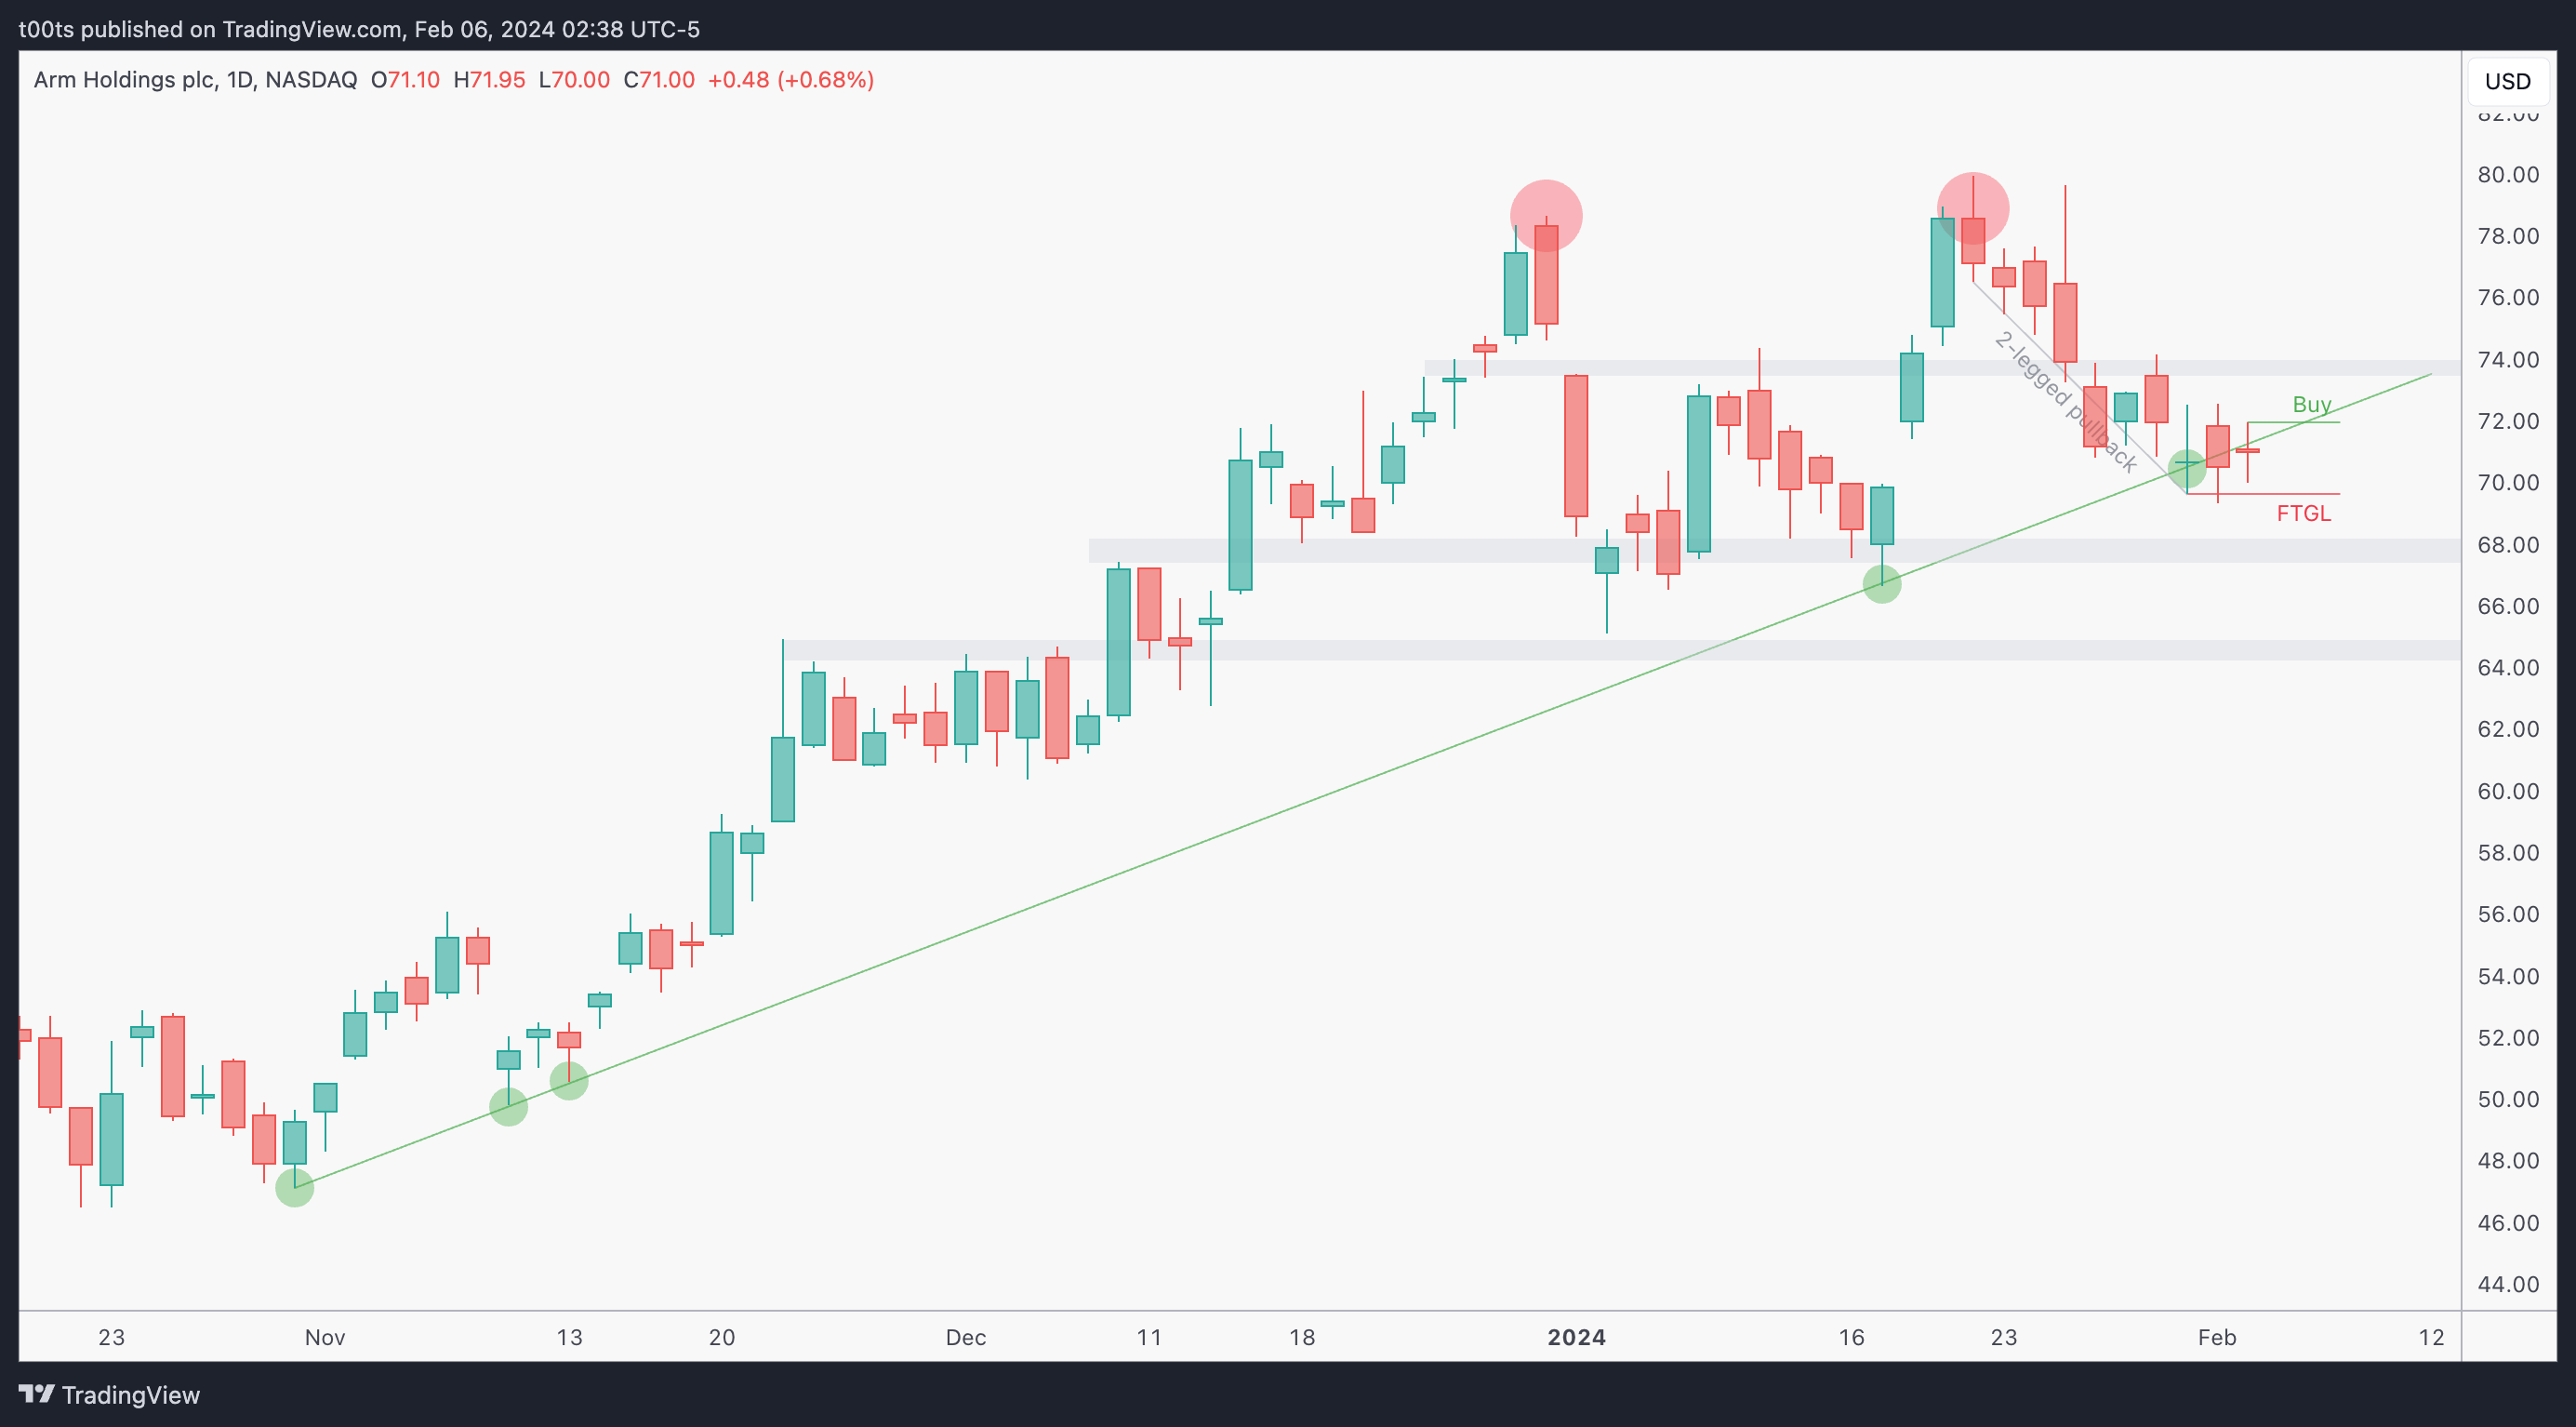
Daily chart
This daily chart is really what caught my attention. The stock is in a clear uptrend and it's currently hovering around this bullish trendline that has held up to 5 times so far (we're currently in the 6th touch). Price double topped around the $80 mark and was followed by a 2-legged pullback (which I personally like). Furthermore, there was a small failure to go lower as sellers tried to bring this stock below the trendline, and on Friday we got a convenient inside doji bar that sets us up for a low-risk entry if price can trade above its highs.
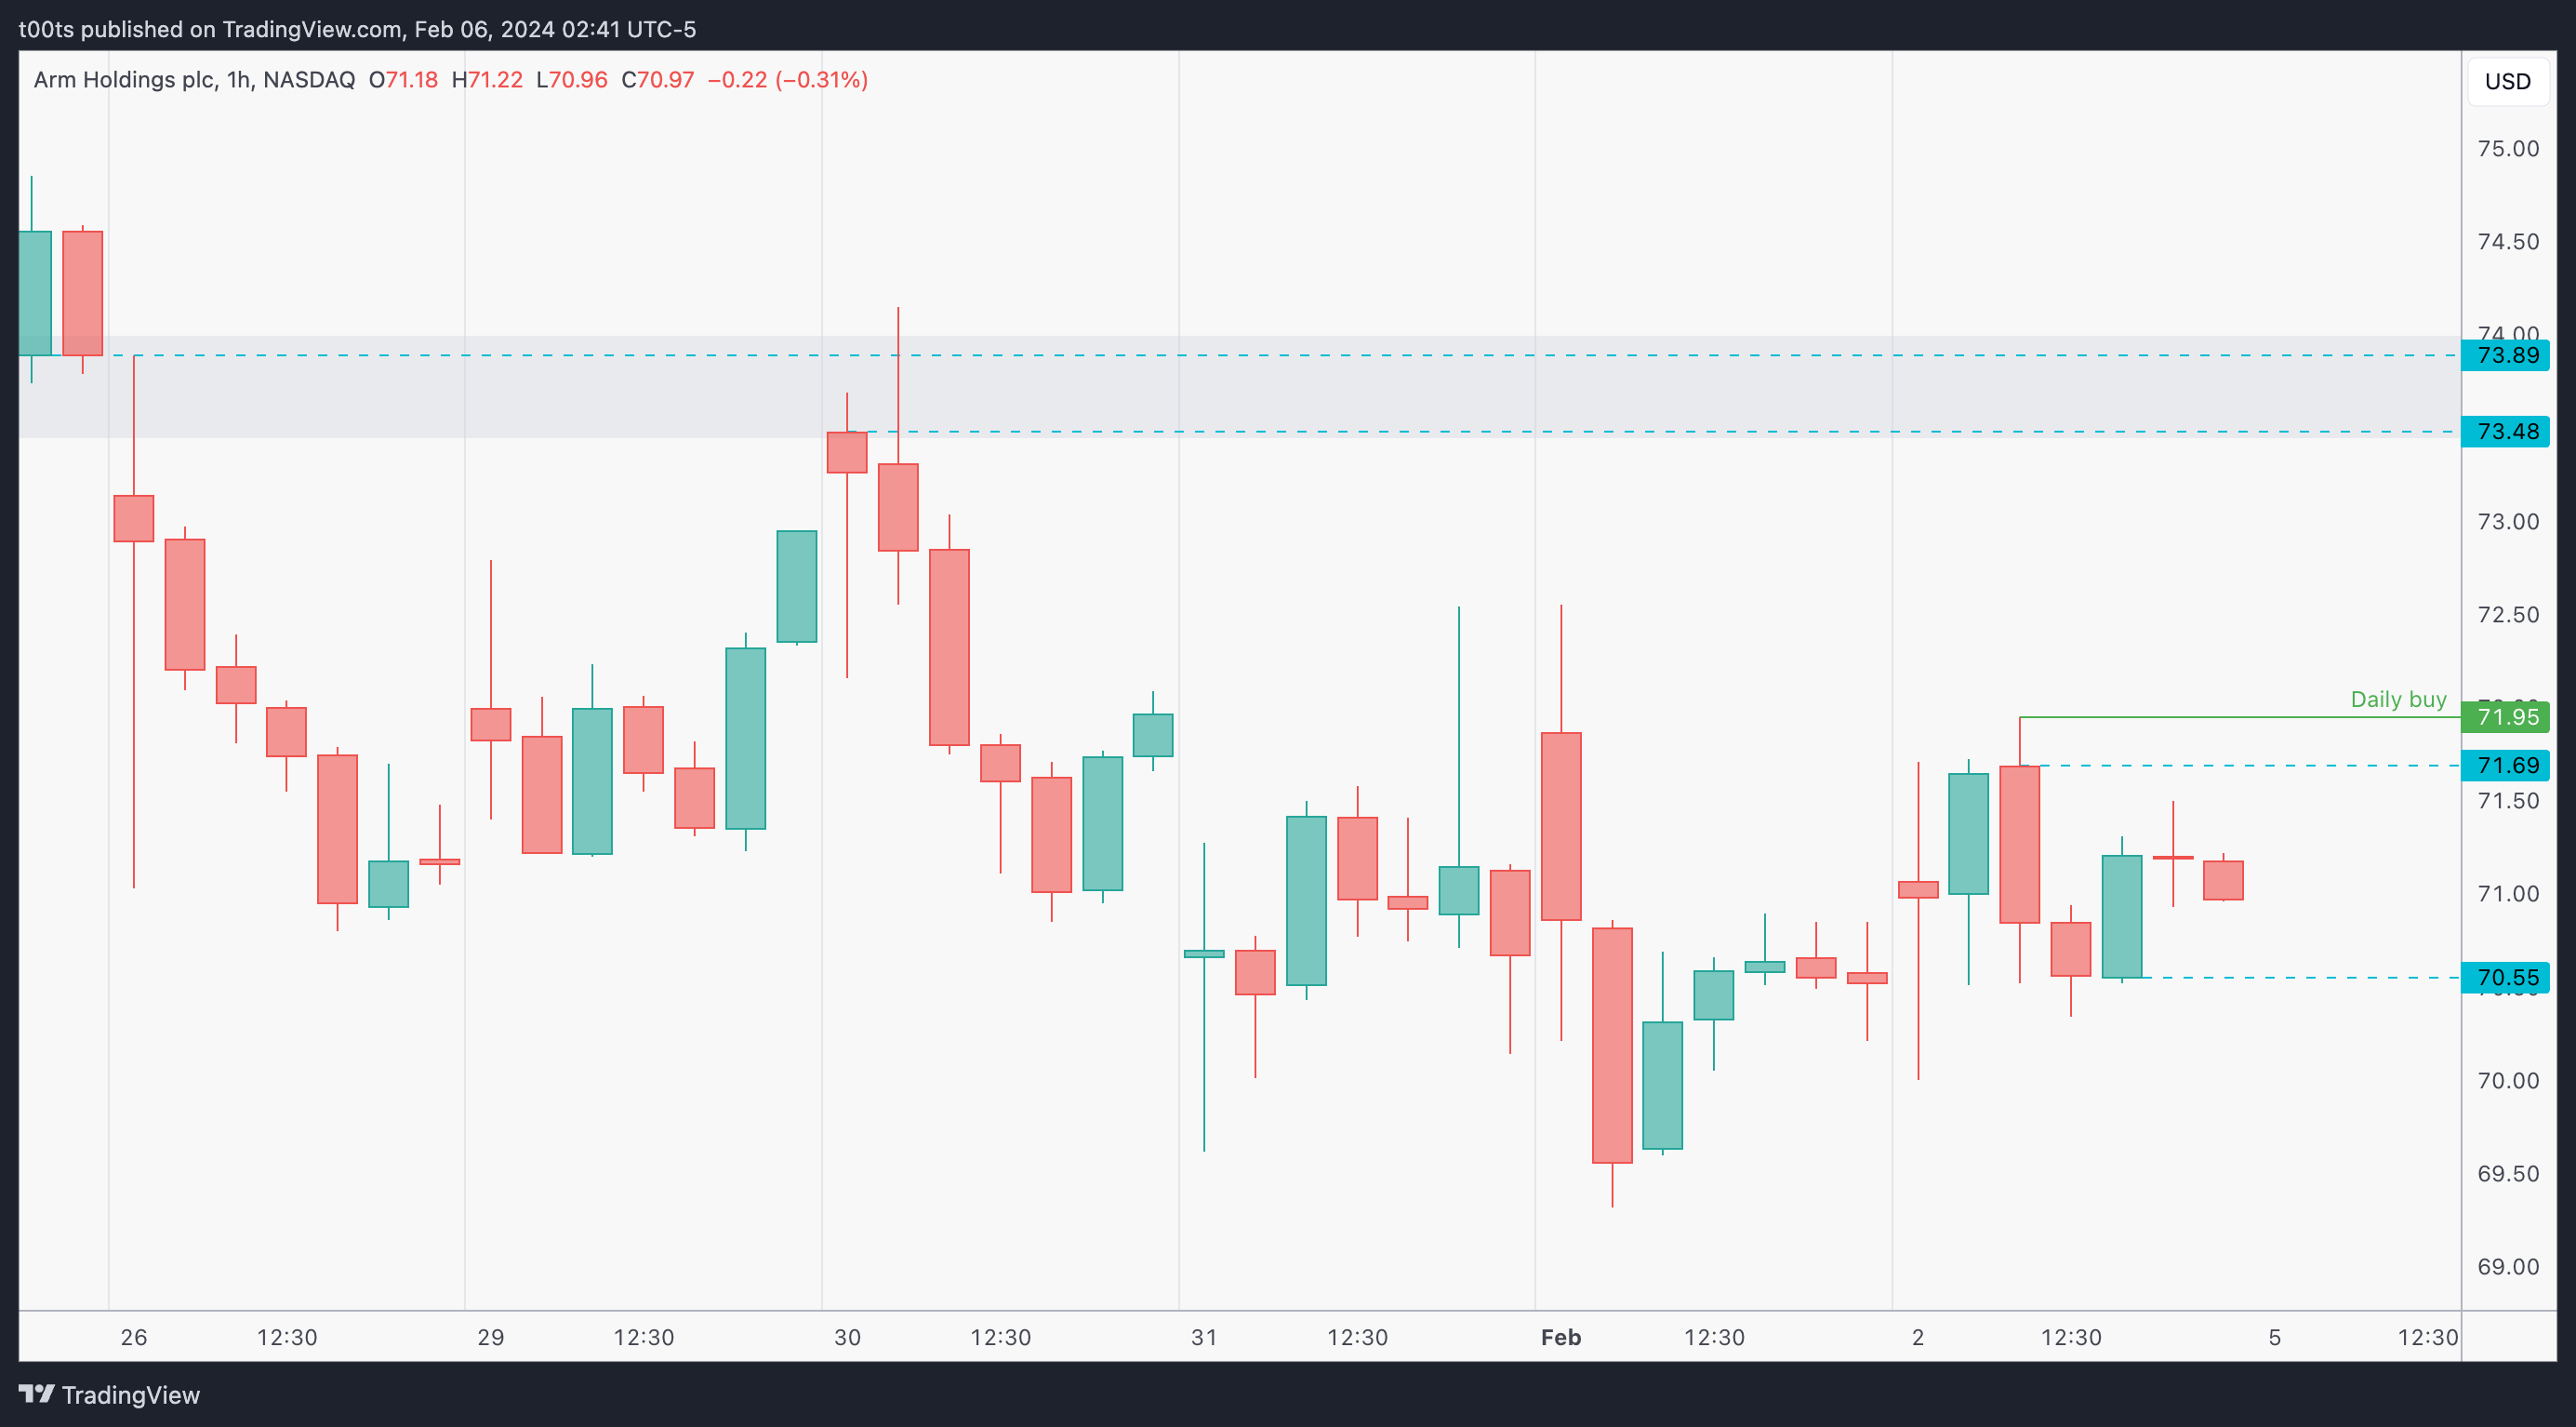
Hourly chart
The $71.69 is our main level of interest to trade off of. There's two full points move until the next level at the $74 area, matching that daily resistance we marked earlier. That's a lot of room to move.
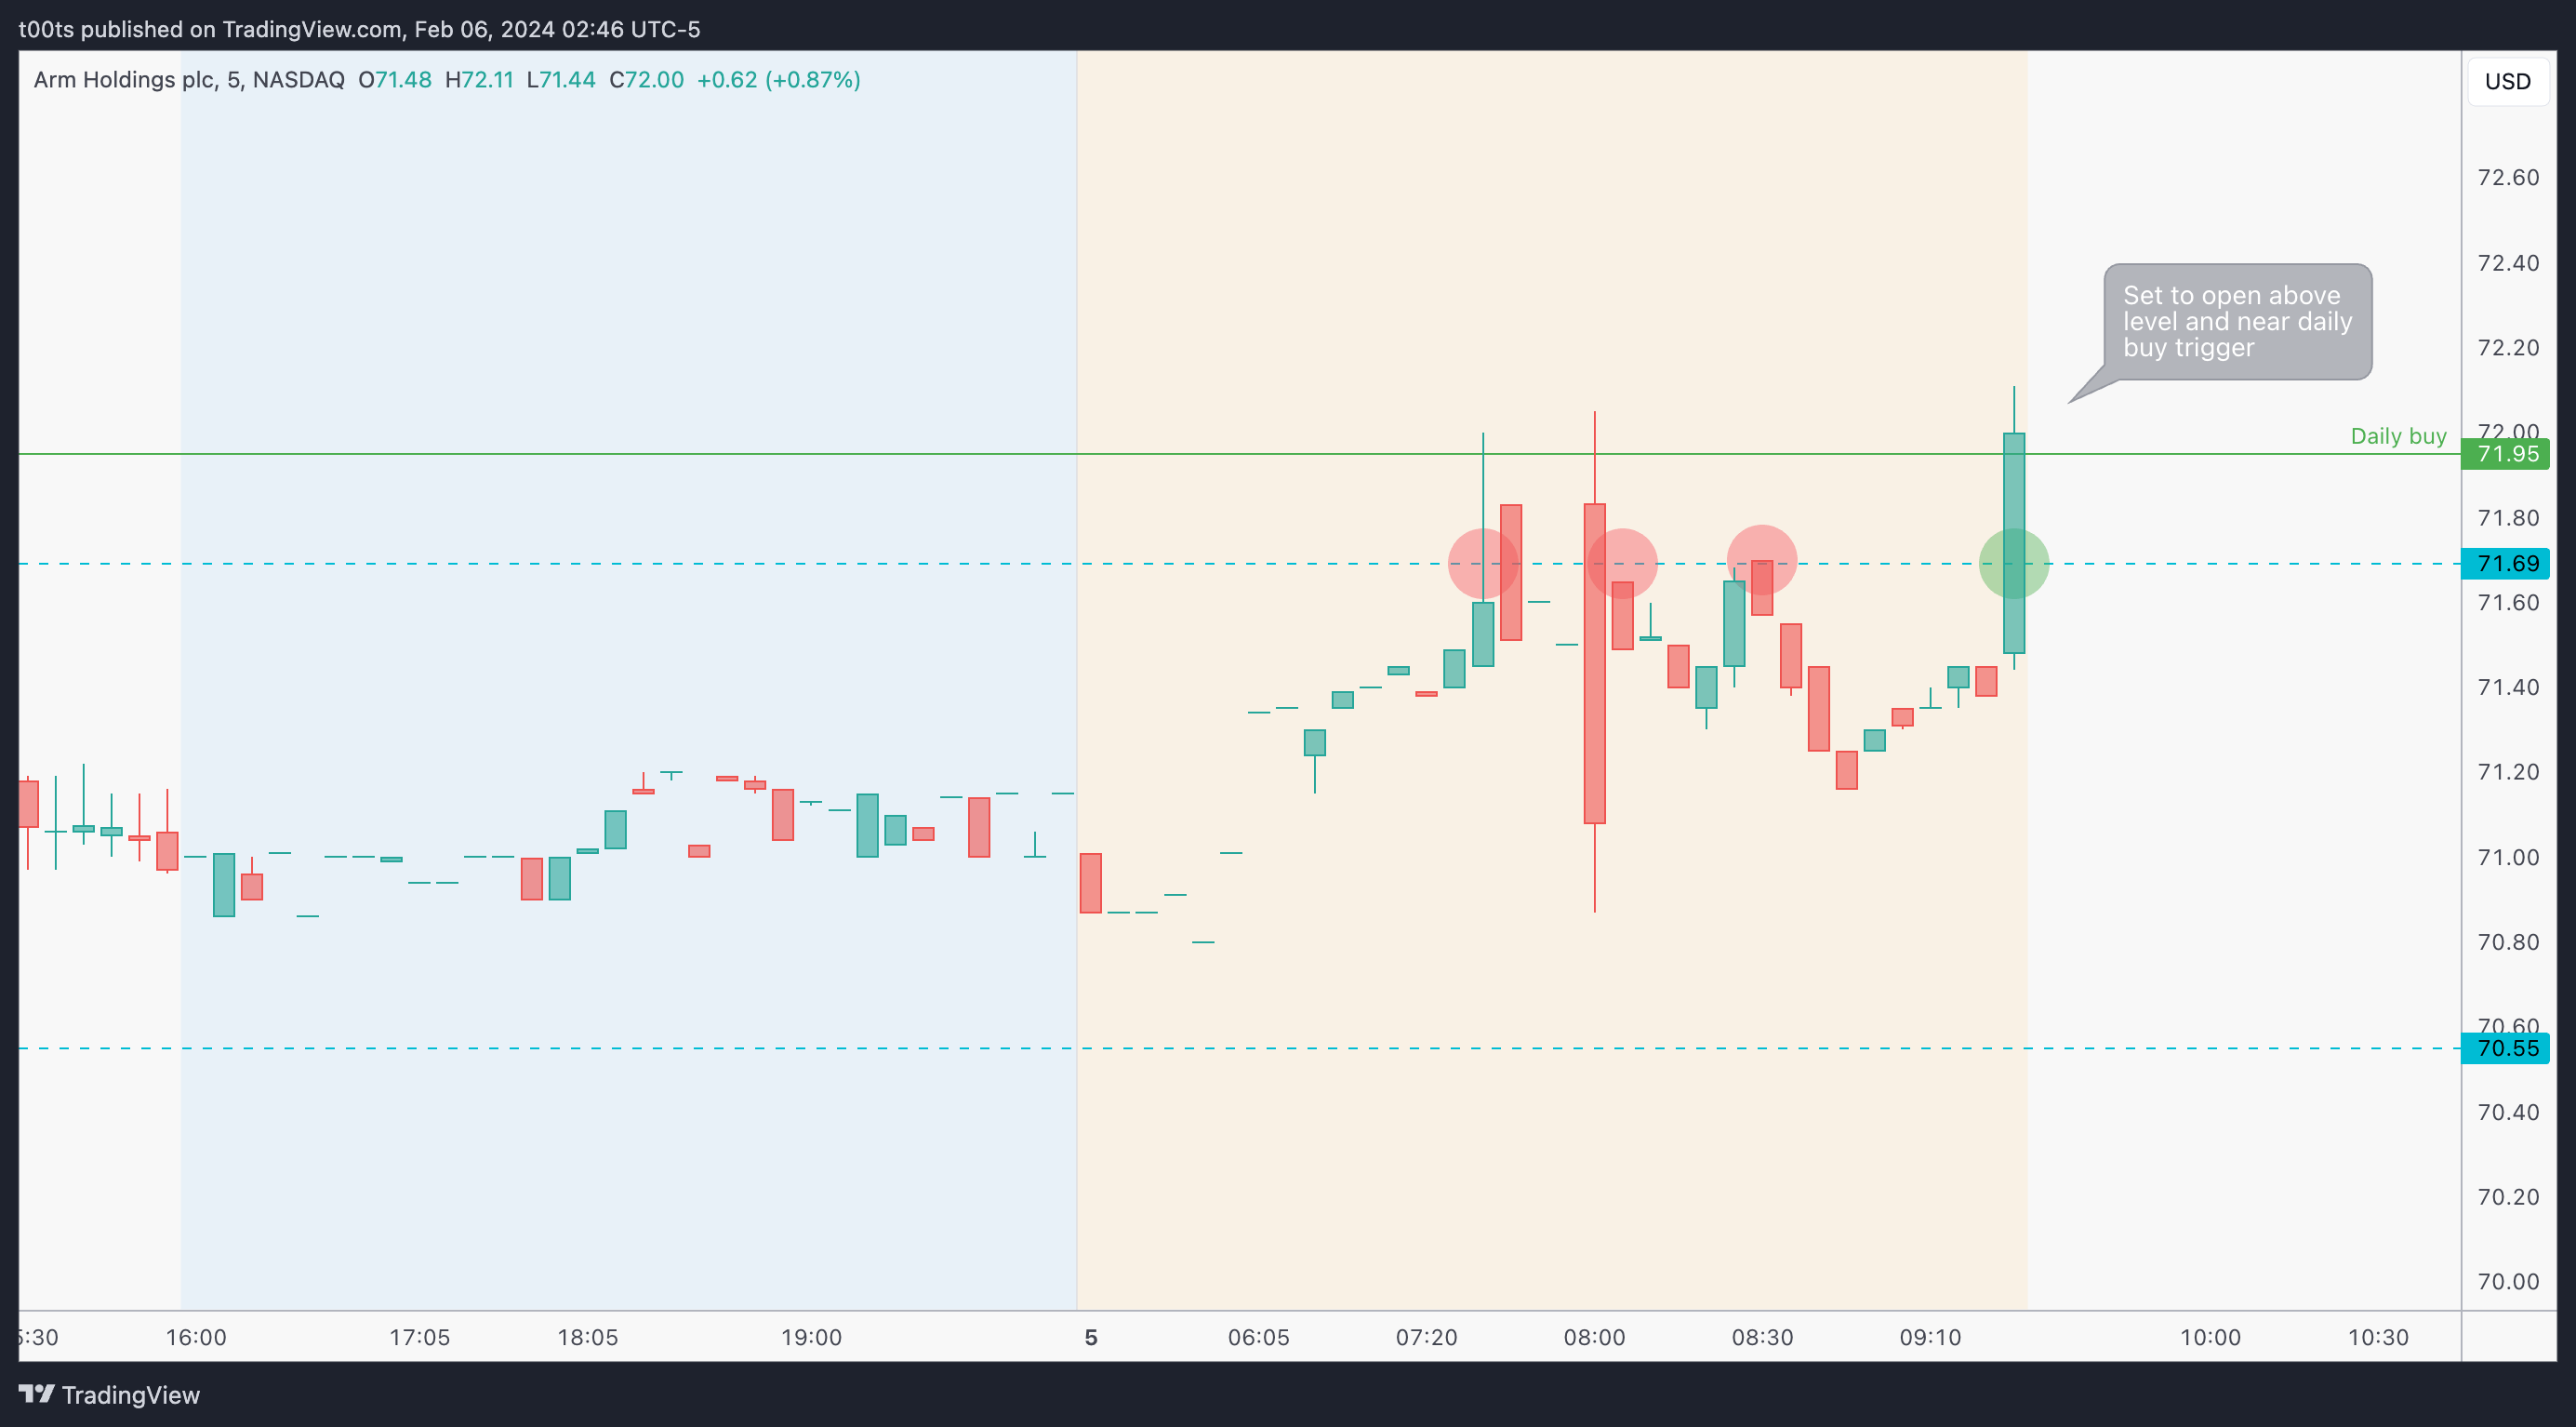
Pre-market action
The stock is set to open above the $71.69 level of interest. That makes it relevant and a top watch for the day. We can even see how it got rejected a few times but finally made it through, and is now teasing at the daily buy trigger.
The trade
Fairly straightforward trade until the market sold off. Let's go over it.
Using our CPT Framework:
Cue(s)
Daily chart at a potential bounce area after 2-legged pullback from highs
Stock lagging while its peers make new highs consistently
Intraday cue: Price set to open above our level of interest
Intraday cue: Price holds our level of interest at the open
Plan
The moment price keeps holding above our level, I honestly just got in. Went with shares so the risk was very limited. To keep things consistent and systematic, I've placed the entry on the break of the 5m 3-bar play, although I was already in it by then, with my stop set around the $71.50s (low of day), and not even looking.
Trigger(s)
Price holding the daily buy trigger mark, or triggering the intraday 5m momentum entry.
5m chart
Very straightforward trade and chart so there won't be much to cover here today.
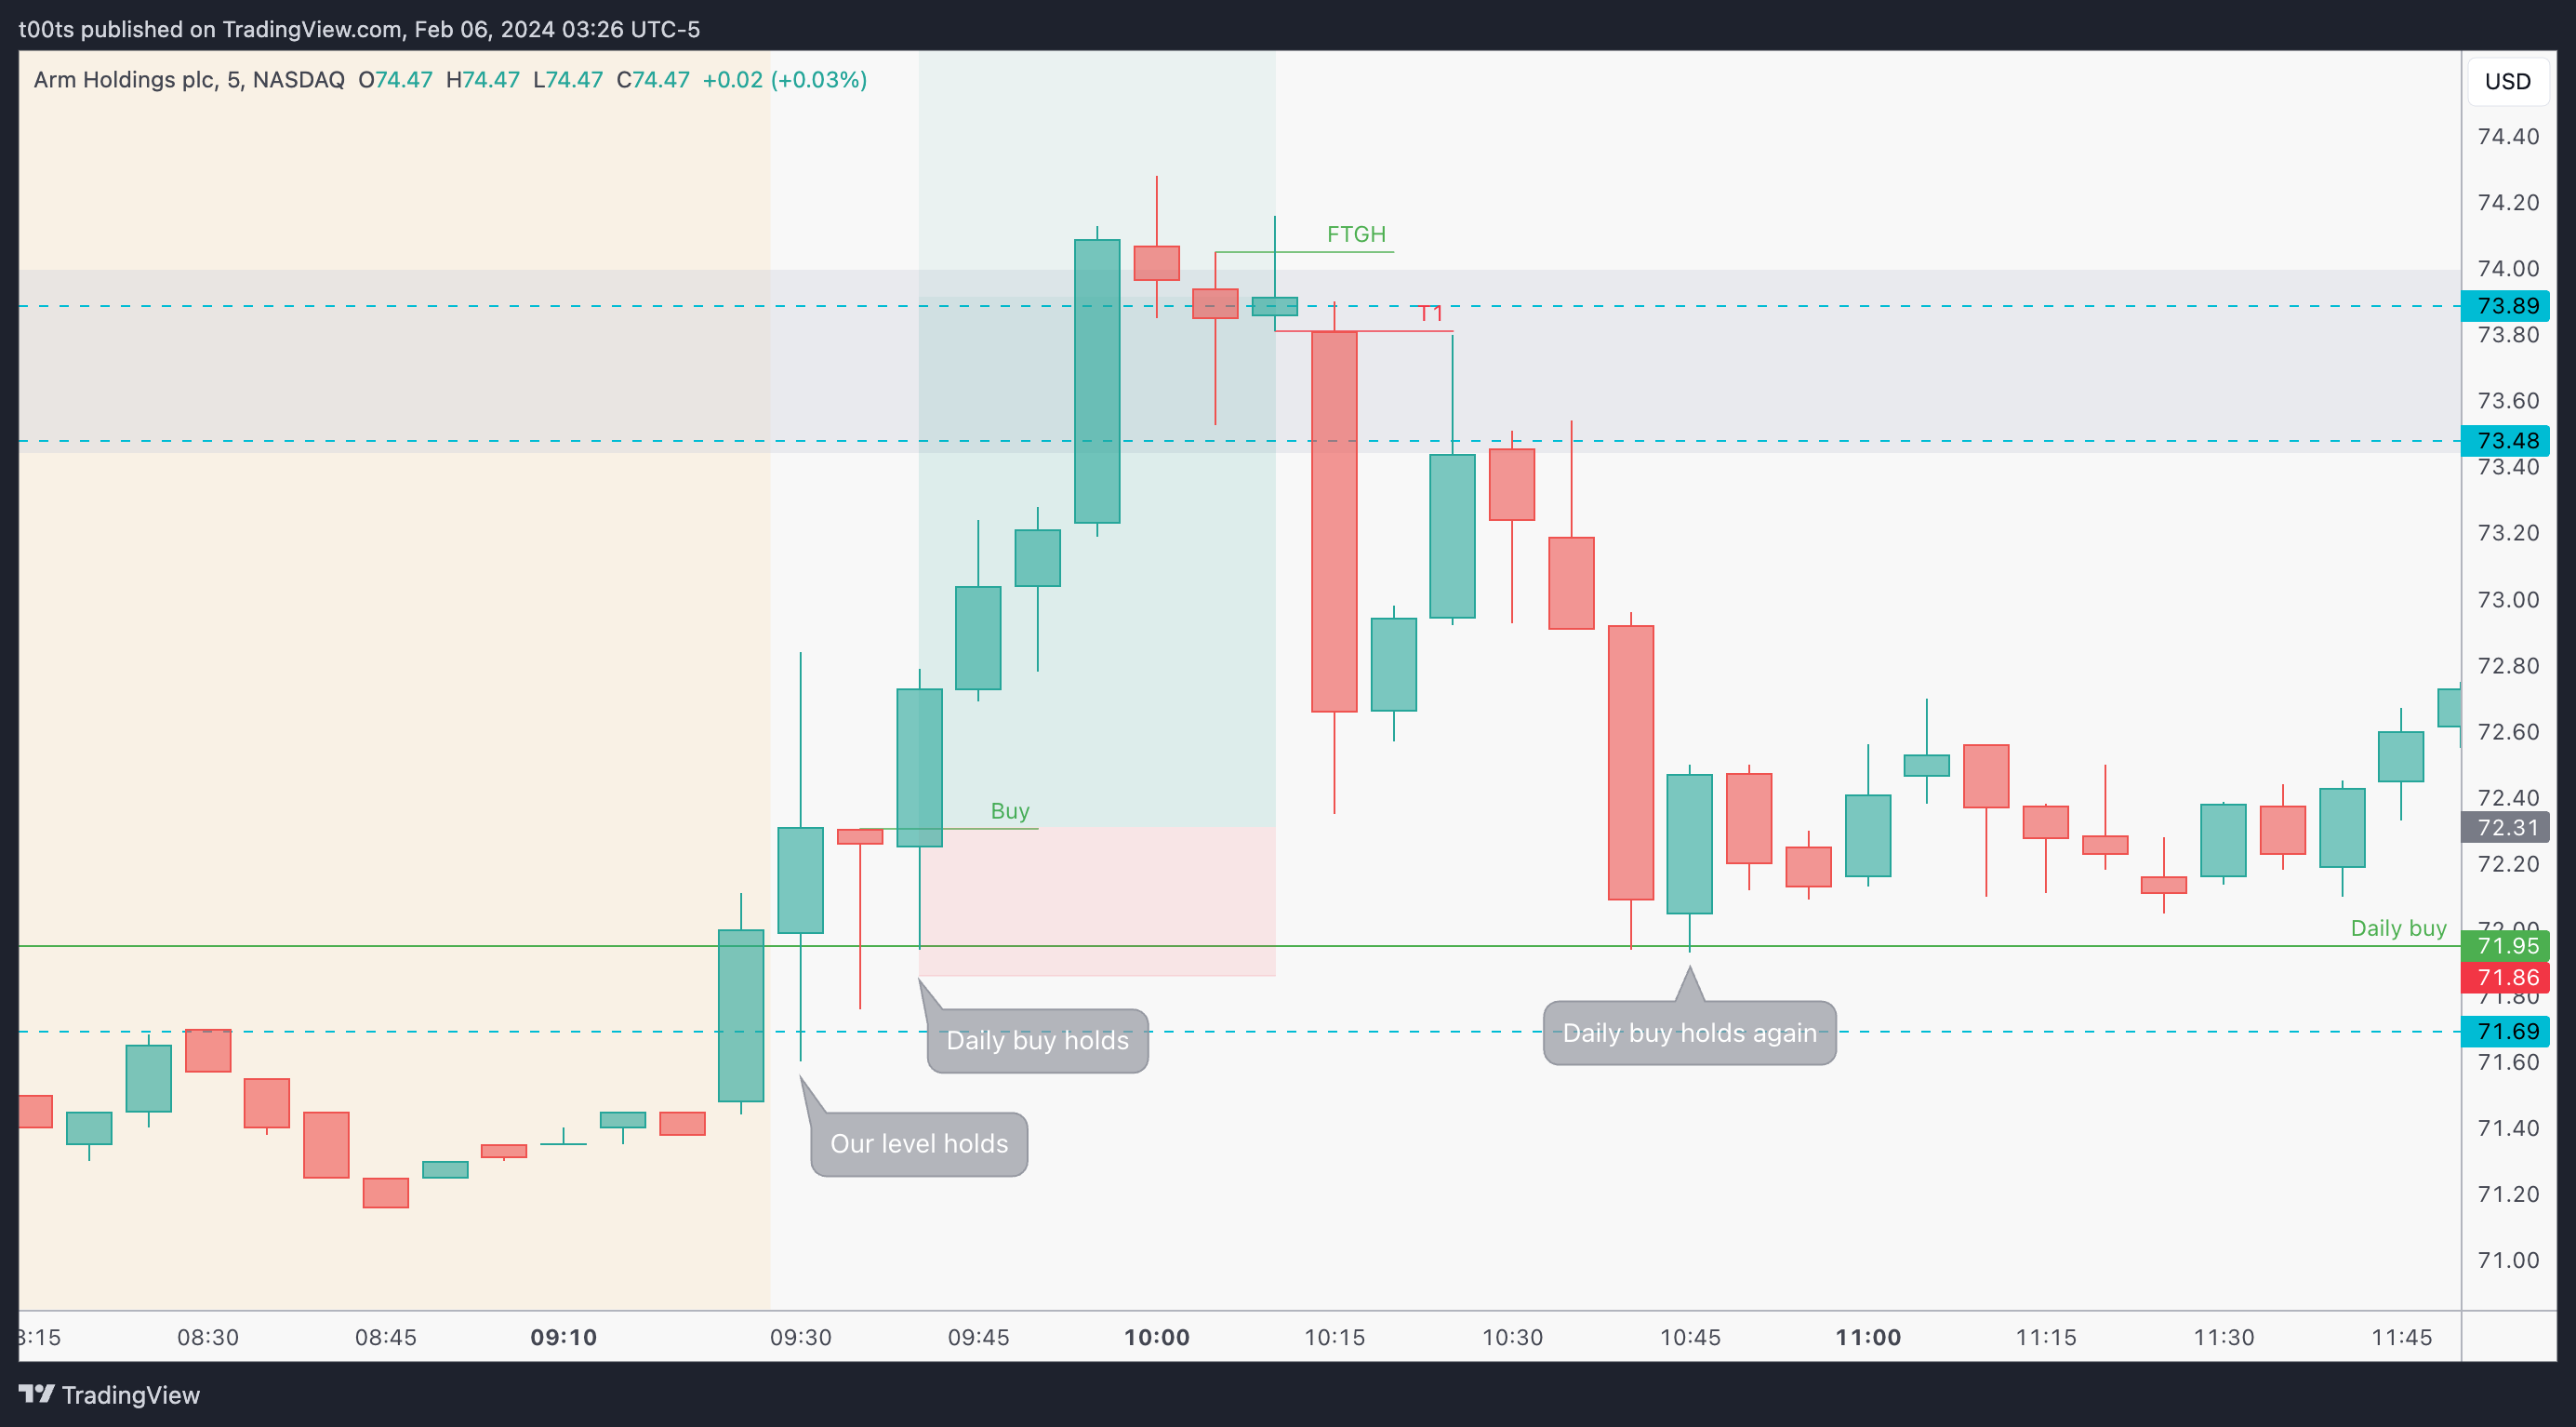
First thing we saw at the open was our level hold. While there was one quick push up after the level holding, the rest of the action during the first 10m was frankly really slow. You had plenty of time to think and get involved after the spike.
I felt a slight bit of FOMO on that quick spike as I was trading off my phone and wasn't quick enough to get in, so I set a limit order at $72 and to my surprise it hit pretty quickly. From then, I just went on to set a stop at the lows, conveniently sitting below our main level of reference, and it was just a matter of letting the trade work.
Stock runs all the way to our $74 area pretty cleanly, and although I was looking to hold this for a few days, I'm forced to exit due to the SPY sell-off we got around 10am.
I've marked T1 on the chart as it is the first trail according to our system, the moment we see that failure to trade above the $73.89 level. The stop hits pretty much immediately and would have saved you from the big drop.
I held the trade longer because I wasn't actively monitoring it. But eventually, despite ARM's relative strength, I saw the market pulling back strong and decided to let go on that second rejection at the $73.48.
Closing notes
I really liked this setup and unfortunately I was kicked out by the market-wide sell-off we experienced around 10am. I wasn't even at my desk, and when I don’t have all the tools to properly manage a situation, I just offload my risk.
It's a shame seeing now that the daily chart had a very decent close and that the trade thesis for the swing is still valid. I got clearly shaken out, which honestly happens way more than you might expect. No need to get upset. Focus on the next trade.
I am posting one trade writeup every day throughout 2024. I focus on large caps using levels and price action. The subscription is absolutely free and will always be. I will strive to provide value by offering clues and ideas for you to enhance your edge. Let’s grow together!