
Super Micro Computer (SMCI) - Jan 30th 2024
How to fearlessly short an overstretched stock

Higher timeframe context
SMCI is one of those stocks that has been recently popping up in every traders watchlist. A chip company I had never heard about that's benefiting from the AI hype wave bringing the whole sector to new heights, offering monster returns to investors. They just reported their Q4 earnings and as you'd expect, they beat analyst expectations in all fronts.
I wasn't trading yesterday, so this is my hindsight review on a solid trade opportunity which had all the ingredients to catch my attention.
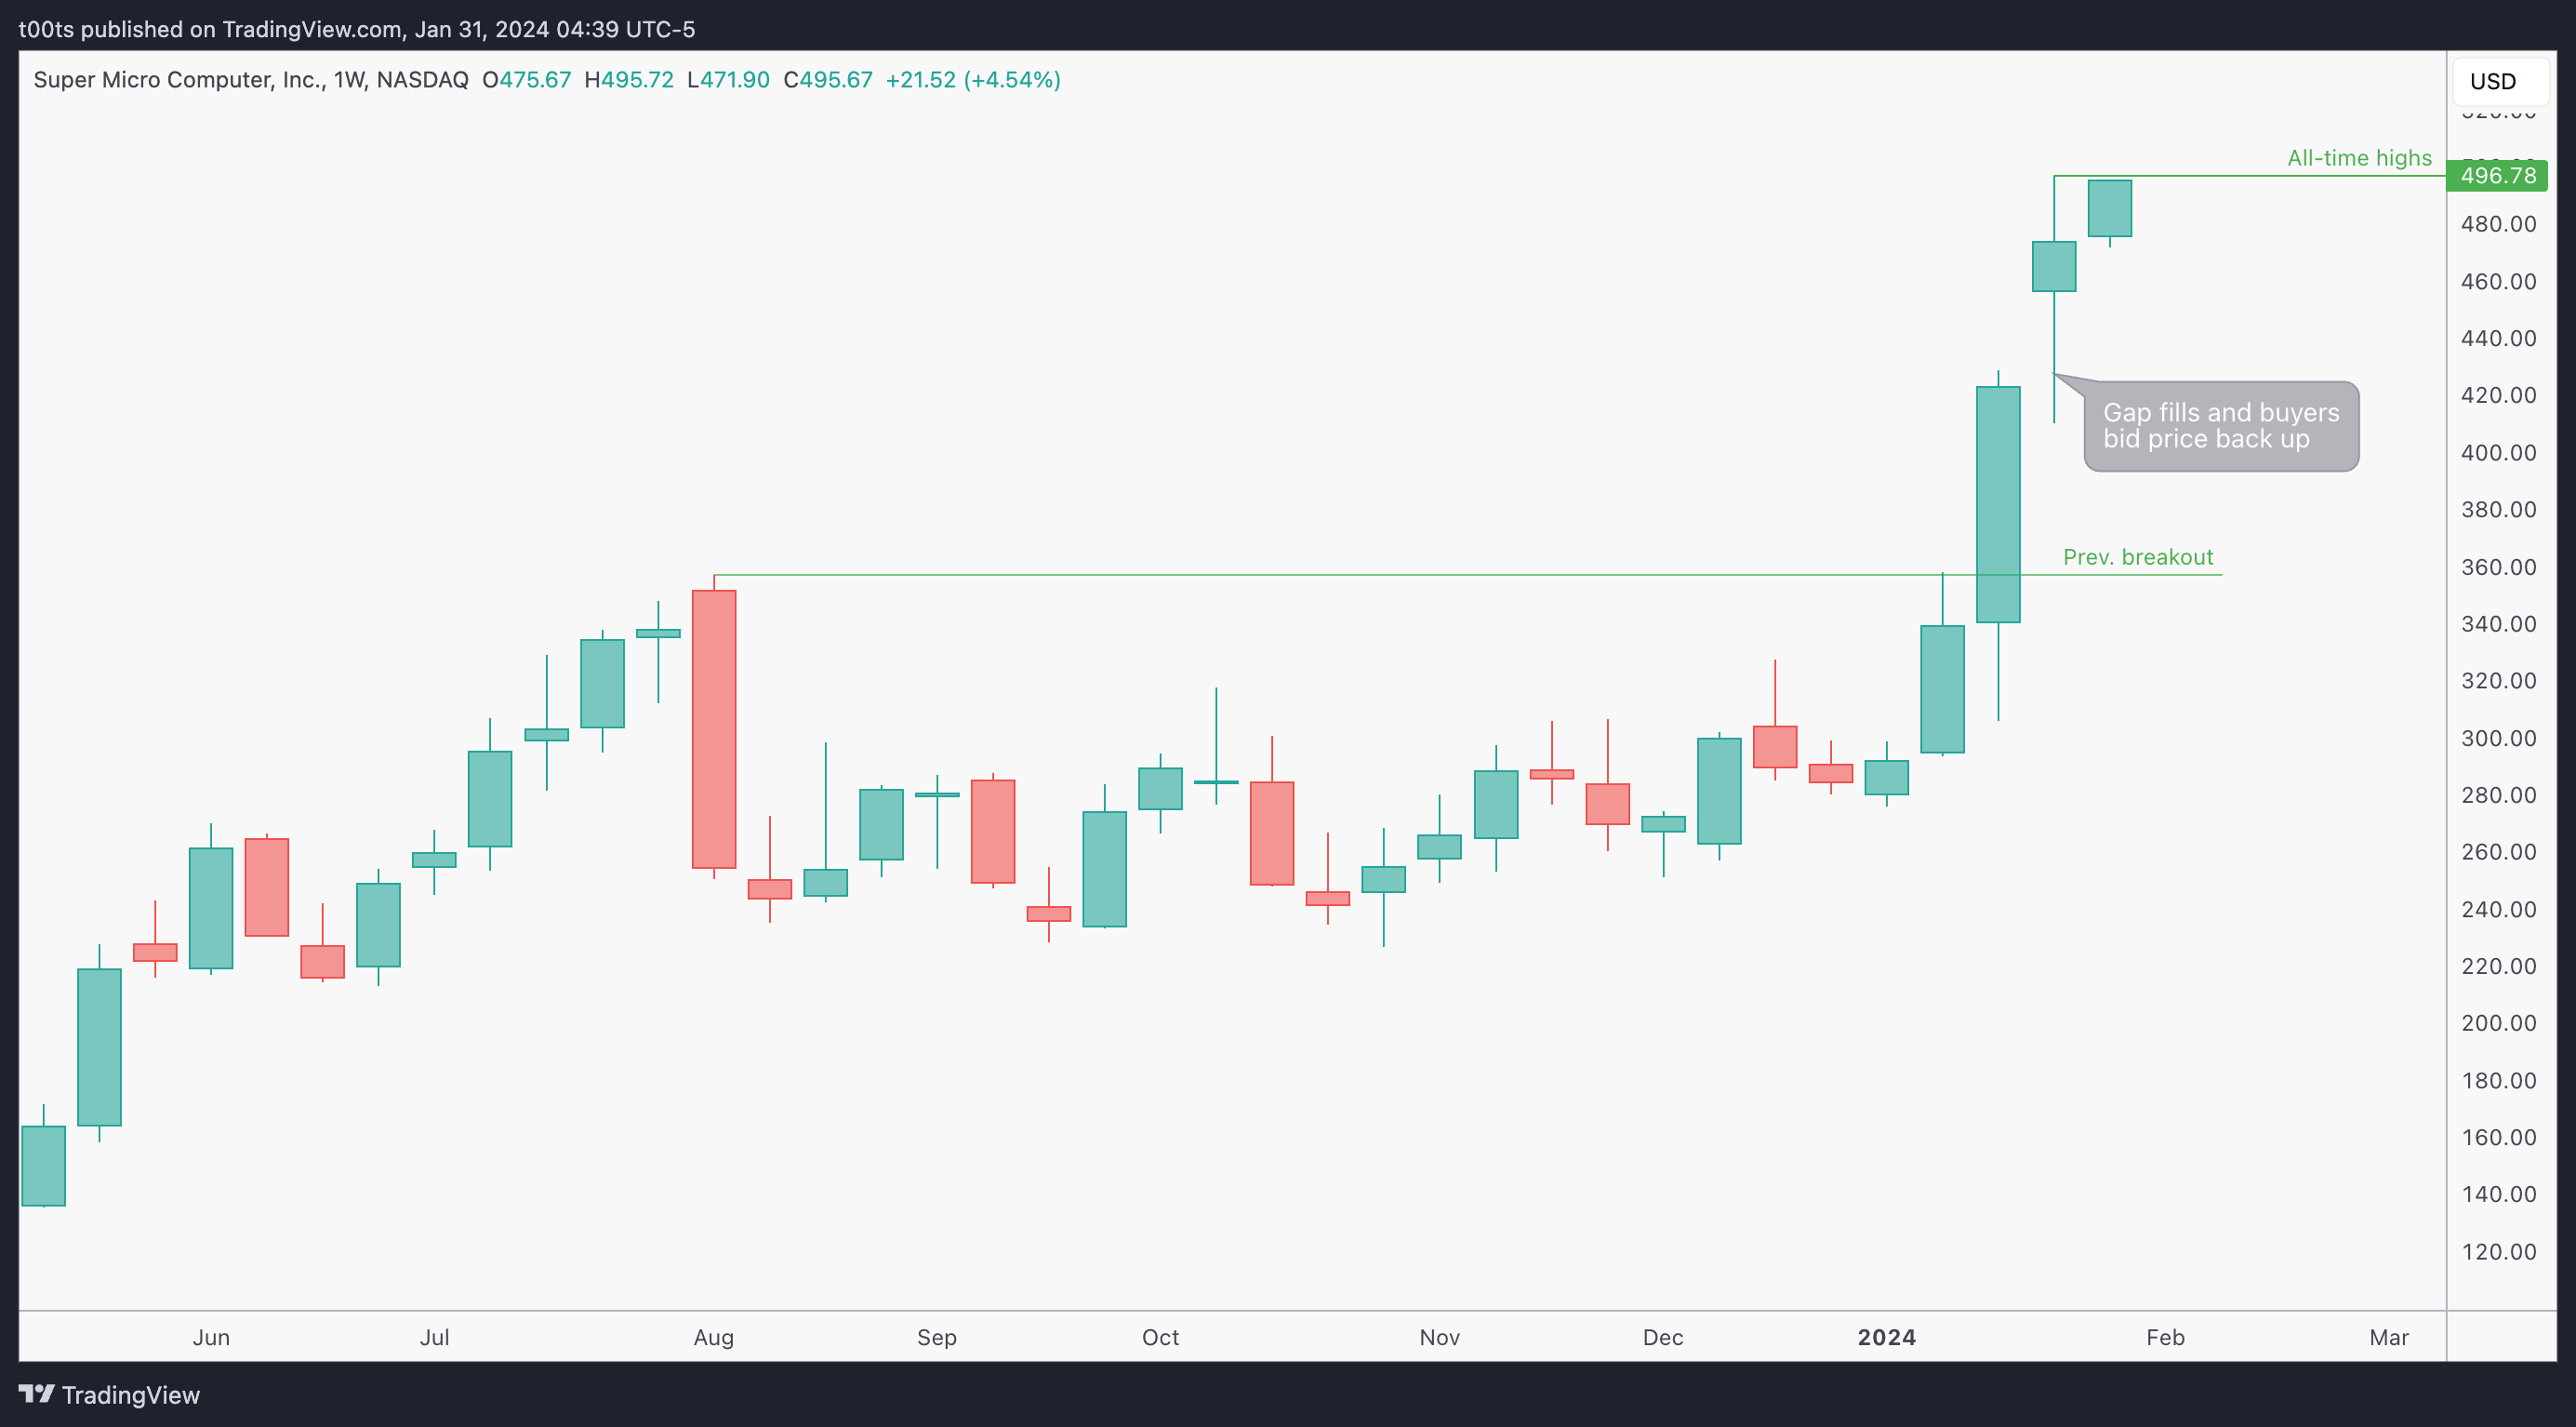
Weekly chart
In our previous SMCI post we went over how this recent multi-week breakout had kicked off. Today we're solely focusing on the recent action leading to their earnings release.
The first thing I see on this weekly chart heading into the announcement is that $500 level. Price is so close! We've been talking a lot recently about how these psychological levels act as magnets. I wish I had checked the open interest on the weekly options for the $500 and $550 to get a feel of the general betting outlook heading into the announcement.
Regardless of the announcement itself, if we're solely focusing on price action momentum is still strong.
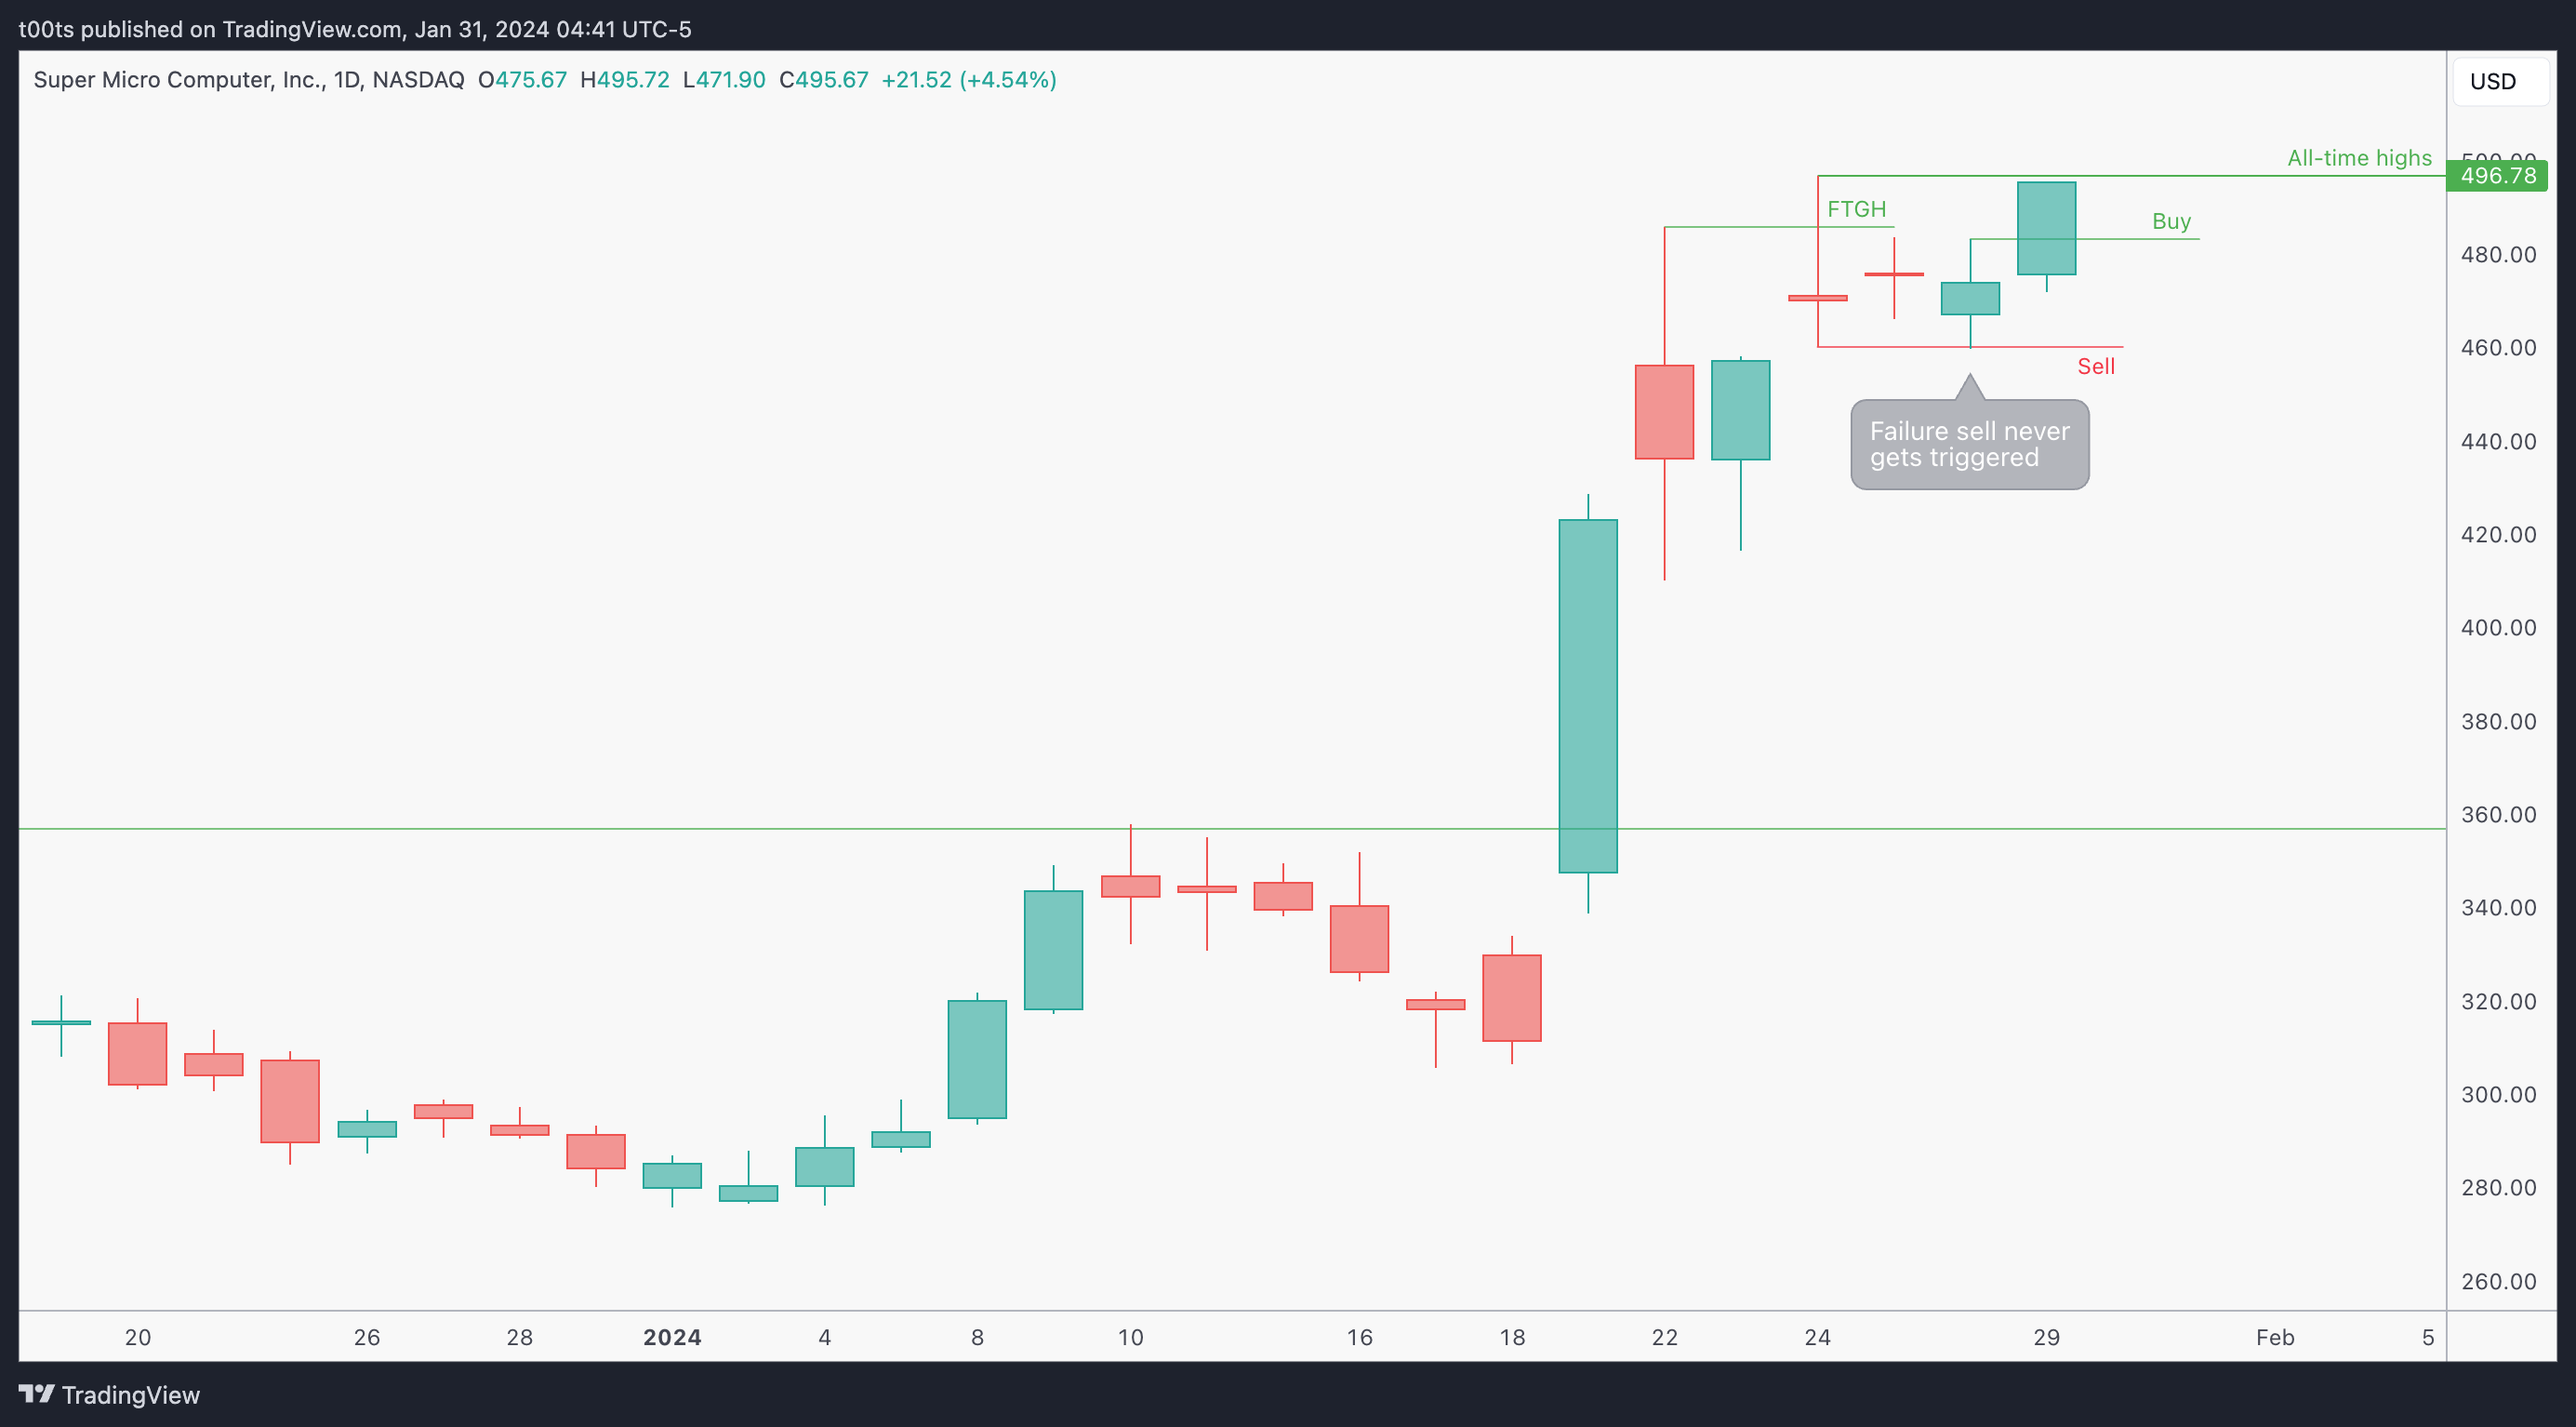
Daily chart
On the daily chart it gets even clearer. Look at how buyers immediately kicked in as the stock tried to pull back. Also, the consolidation of these past few days has taken place in a fairly tight range -adjusted to the stock's ATR. More recently, buyers have managed to close with a nice bull trend bar pointing to new highs as we head into the announcement.
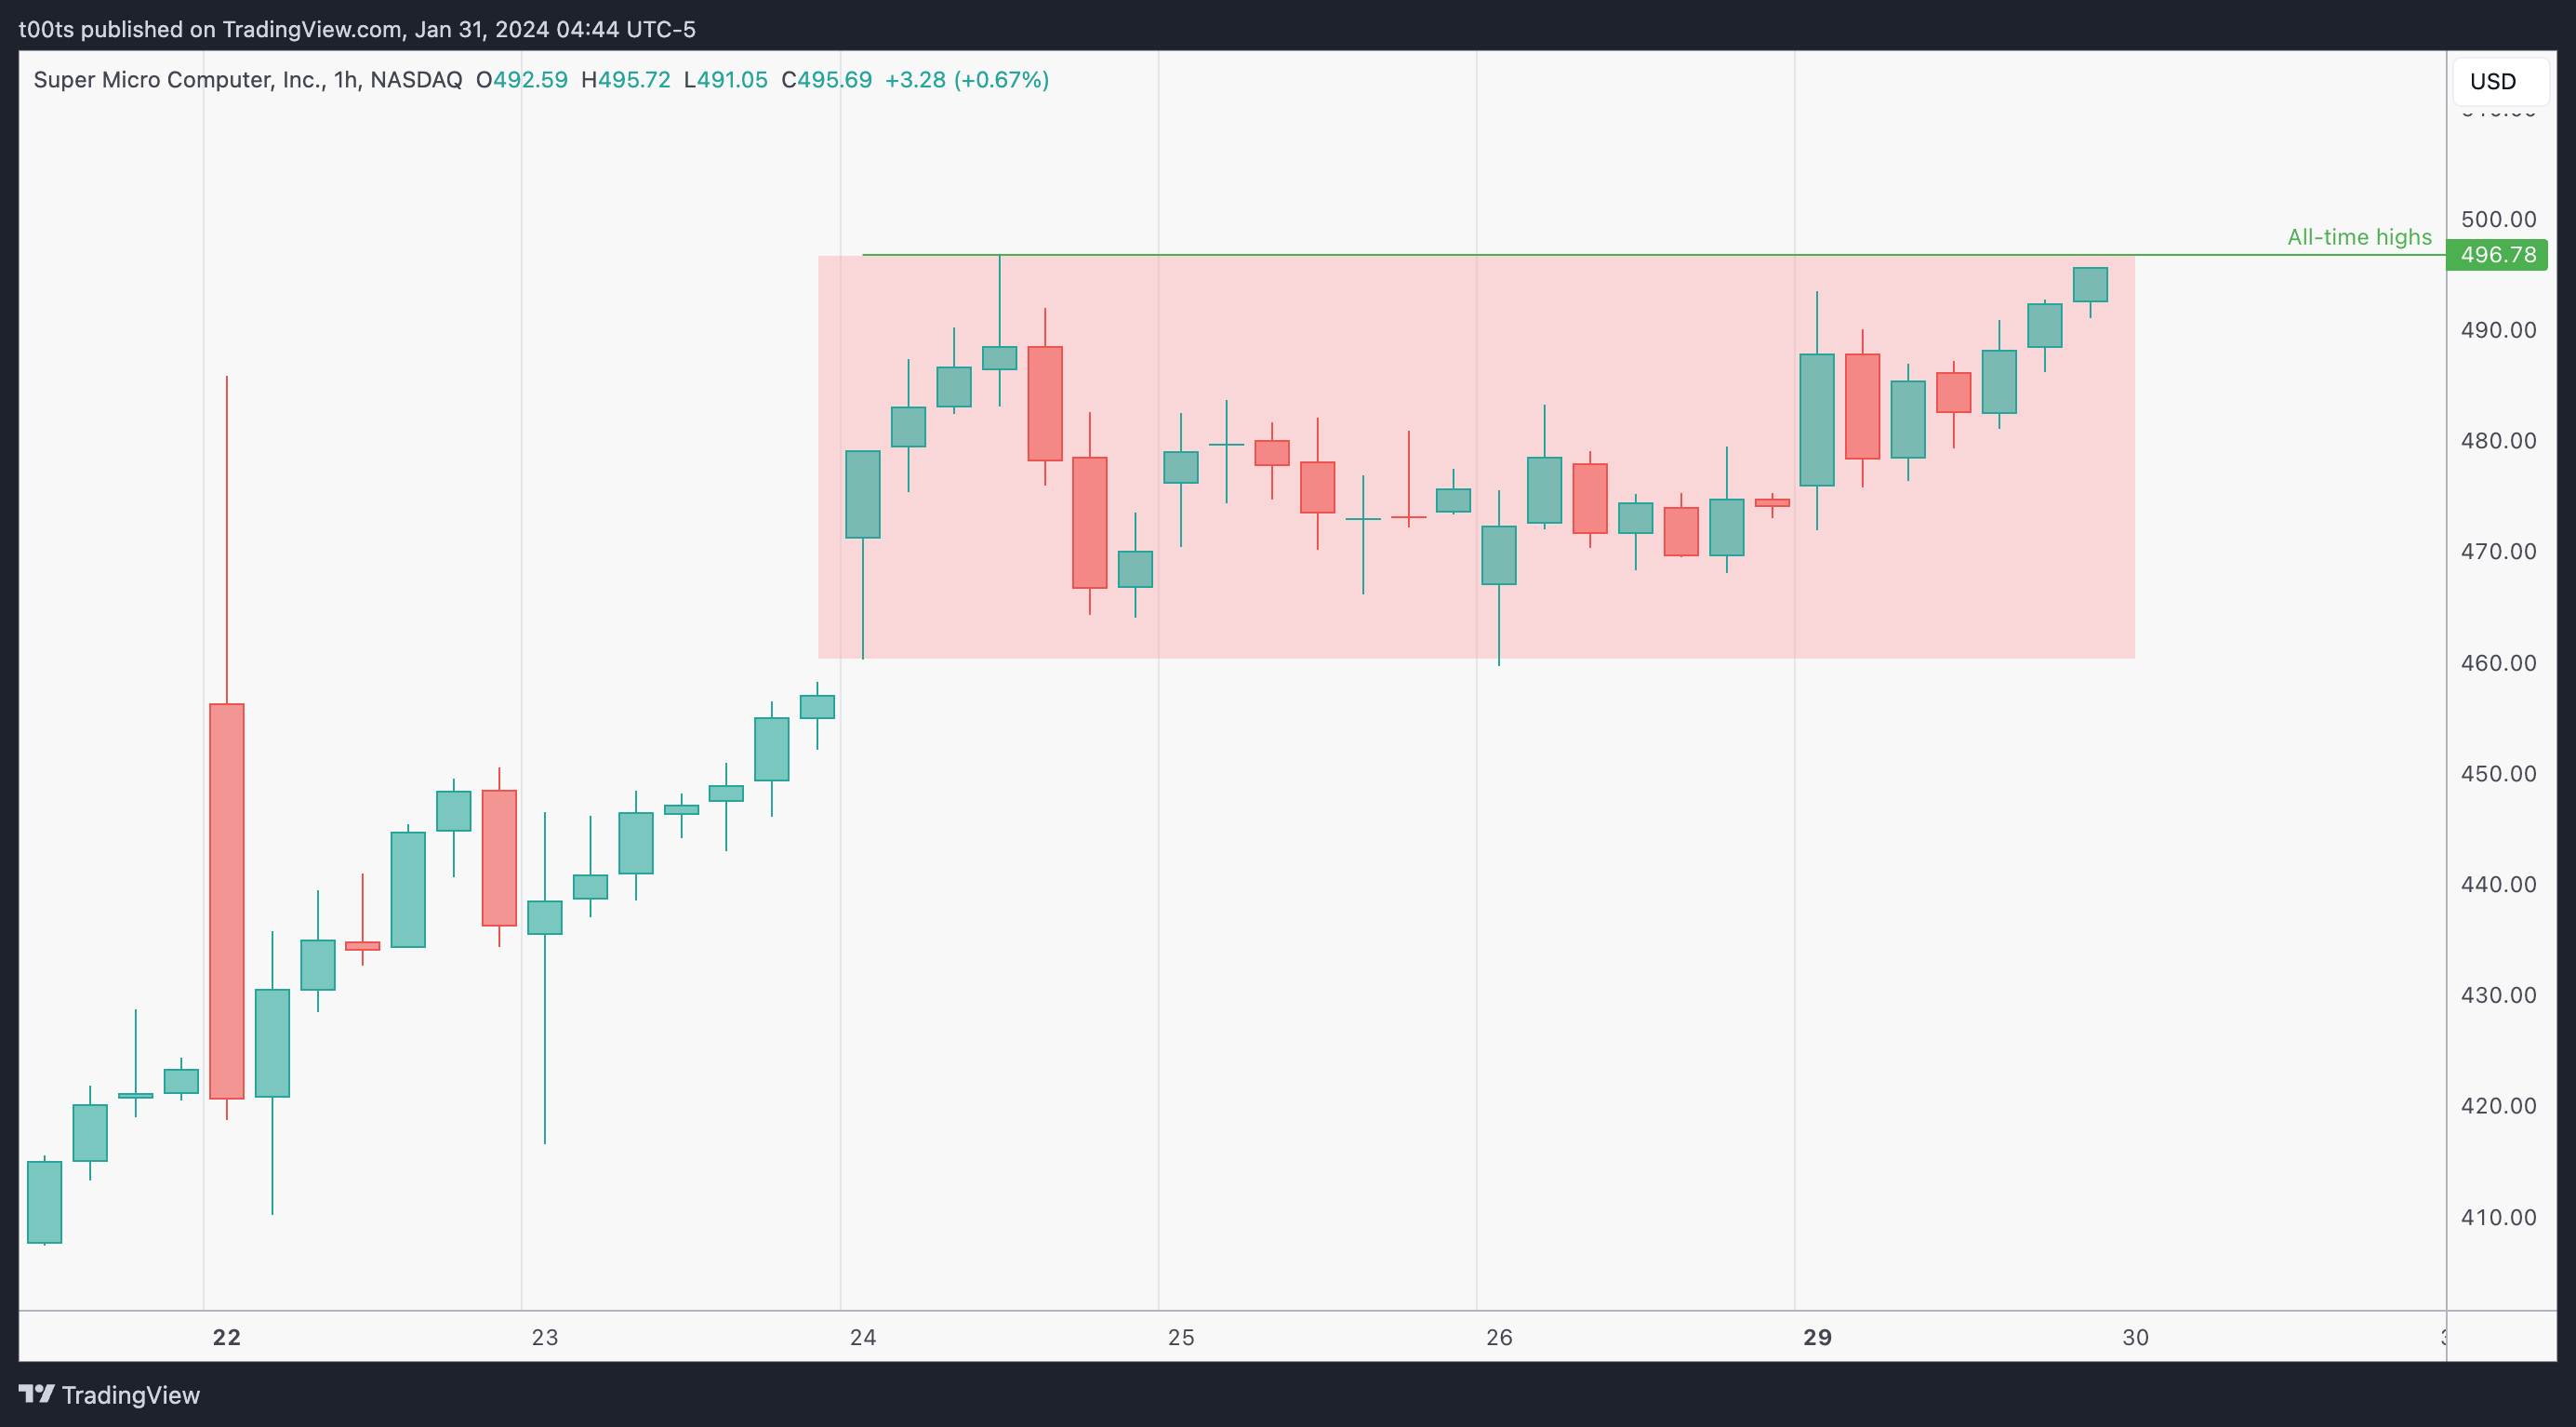
Hourly chart
This hourly chart is kind of irrelevant given the stock is gapping up on strong earnings into unvisited territory, thus why I didn't mark any levels. All that's relevant here is to note how price has closed near the top of this short-term range headed into the earnings release.
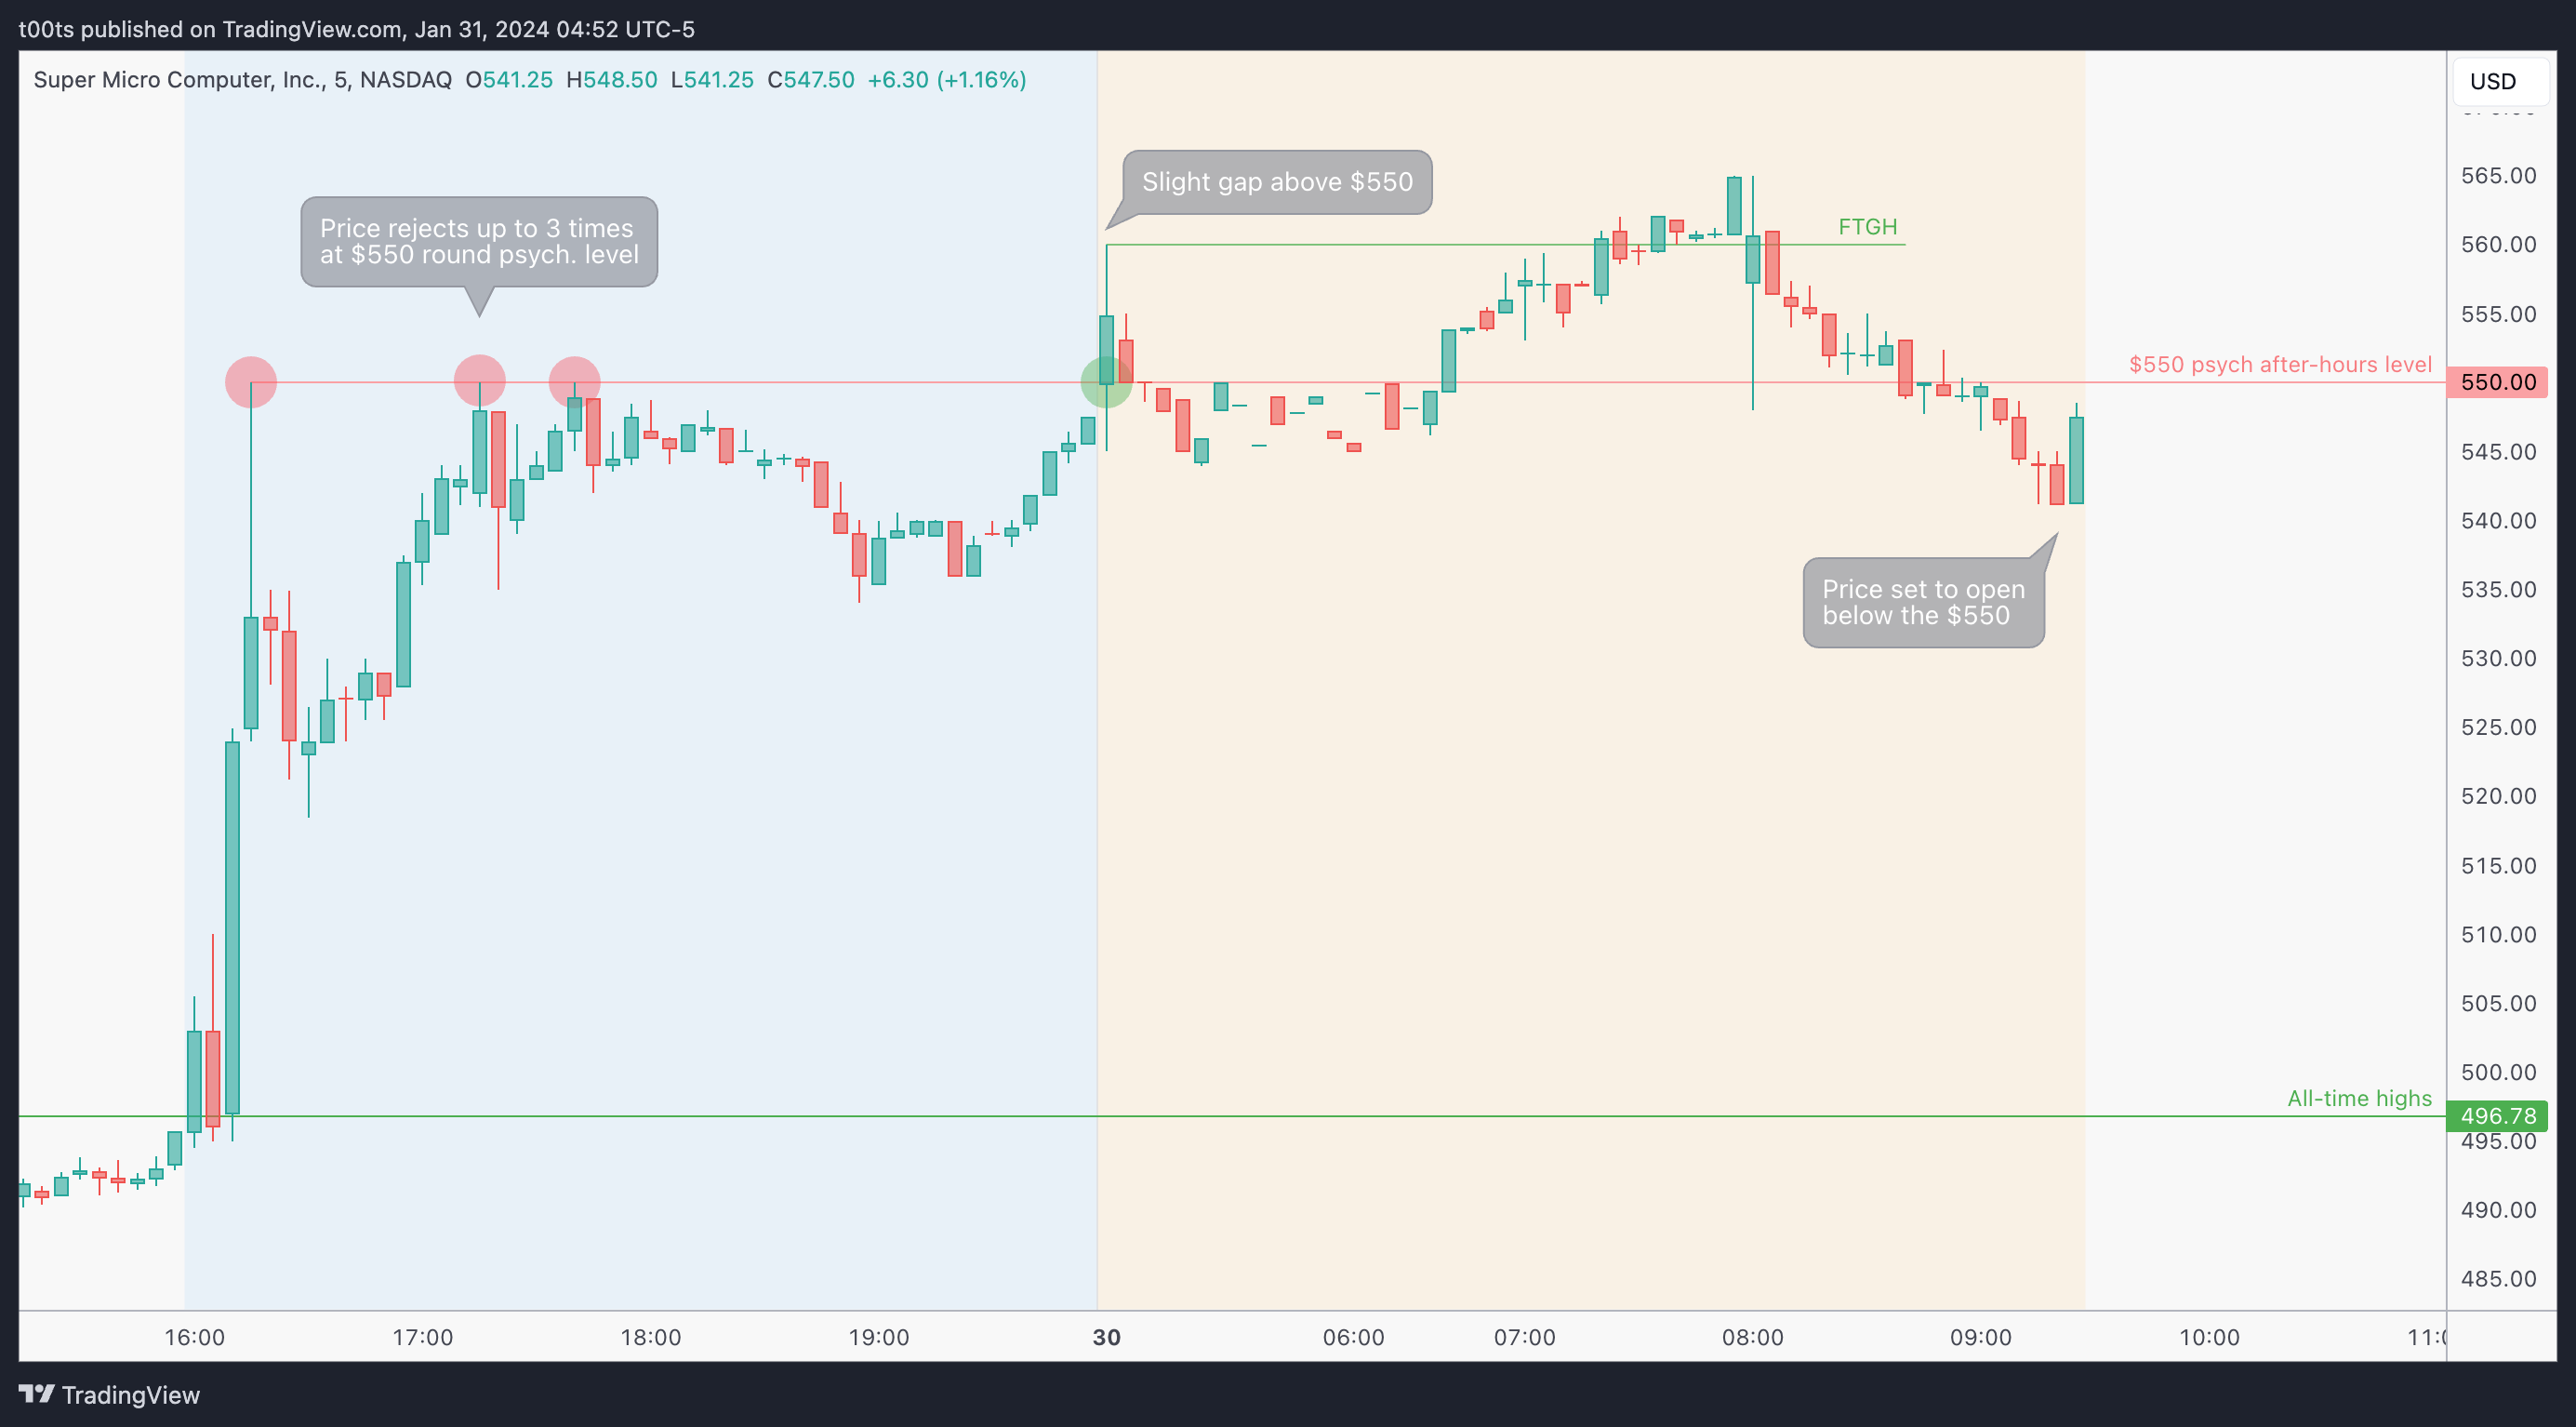
Pre-market action
This is the most important chart we'll look at today. It's the chart that most active US-market traders on the planet are looking at heading into the trading day. And it is offering a lot of information that we can use to prepare.
First thing we see is that pop after-hours, showing that the first reaction was positive. We also see how price closed the day near the highs, so without knowing what the company said on their earnings call, we can assume things went smooth. Notice how the $550 level hit to the tick, and rejected -again, to the tick- up to 3 times. It's so clean it stands out. And if it stands out to you, guess what? It stands out to a lot of other traders as well.
Onto the pre-market session. First thing we see is how price opens right at $550! In the absence of hourly levels, this level is just screaming at us traders as we get ready for the day. Right now it's surely our best reference to gauge where the stock will head next. SMCI climbs up during the pre-market session until it eventually tops around $565 and the trend turns enough for price to lose the $550 completely, as it sets to open below this key level.
The trade
When these big moves happen on catalysts like earnings, I like to stop and think for a second about investor positioning, just like we did with 3M. When I see this chart, most of my thoughts revolve around one concept: overextension.
2021 taught us that there's no such thing as overextension, and while I would agree that my view is subjective and can't be taken seriously unless I provide a quantitative measure, I do believe that at this point traders and investors who are long will most likely want to collect profits after such a move. On the other hand, you have all the shorts eagerly waiting to slam the bid and take this down.
Using our CPT Framework:
Cue(s)
Stock is gapping up almost 2 ATR's on strong earnings
Weekly chart is arguably overextended, increasing the chances of a pullback
The $550 psych. level is acting as the main line in the sand headed into the open
Plan
The plan of course revolves around the $550 level. This is our key reference for the open.
This is a setup we've seen a lot, both to the long and the short side. As we're set to open below, I'm more inclined to look for shorts that head us into the gap fill. We are looking for price to test the $550 and expecting a rejection. If price does reject, we want to get involved only if price trades below the opening print, risking the high of the day.
If price were to break the $550, I'd personally only get involved in longs if we were to retest it and hold. I'd never buy the breakout!
Trigger(s)
Price trading below the opening print after rejecting $550
5m chart
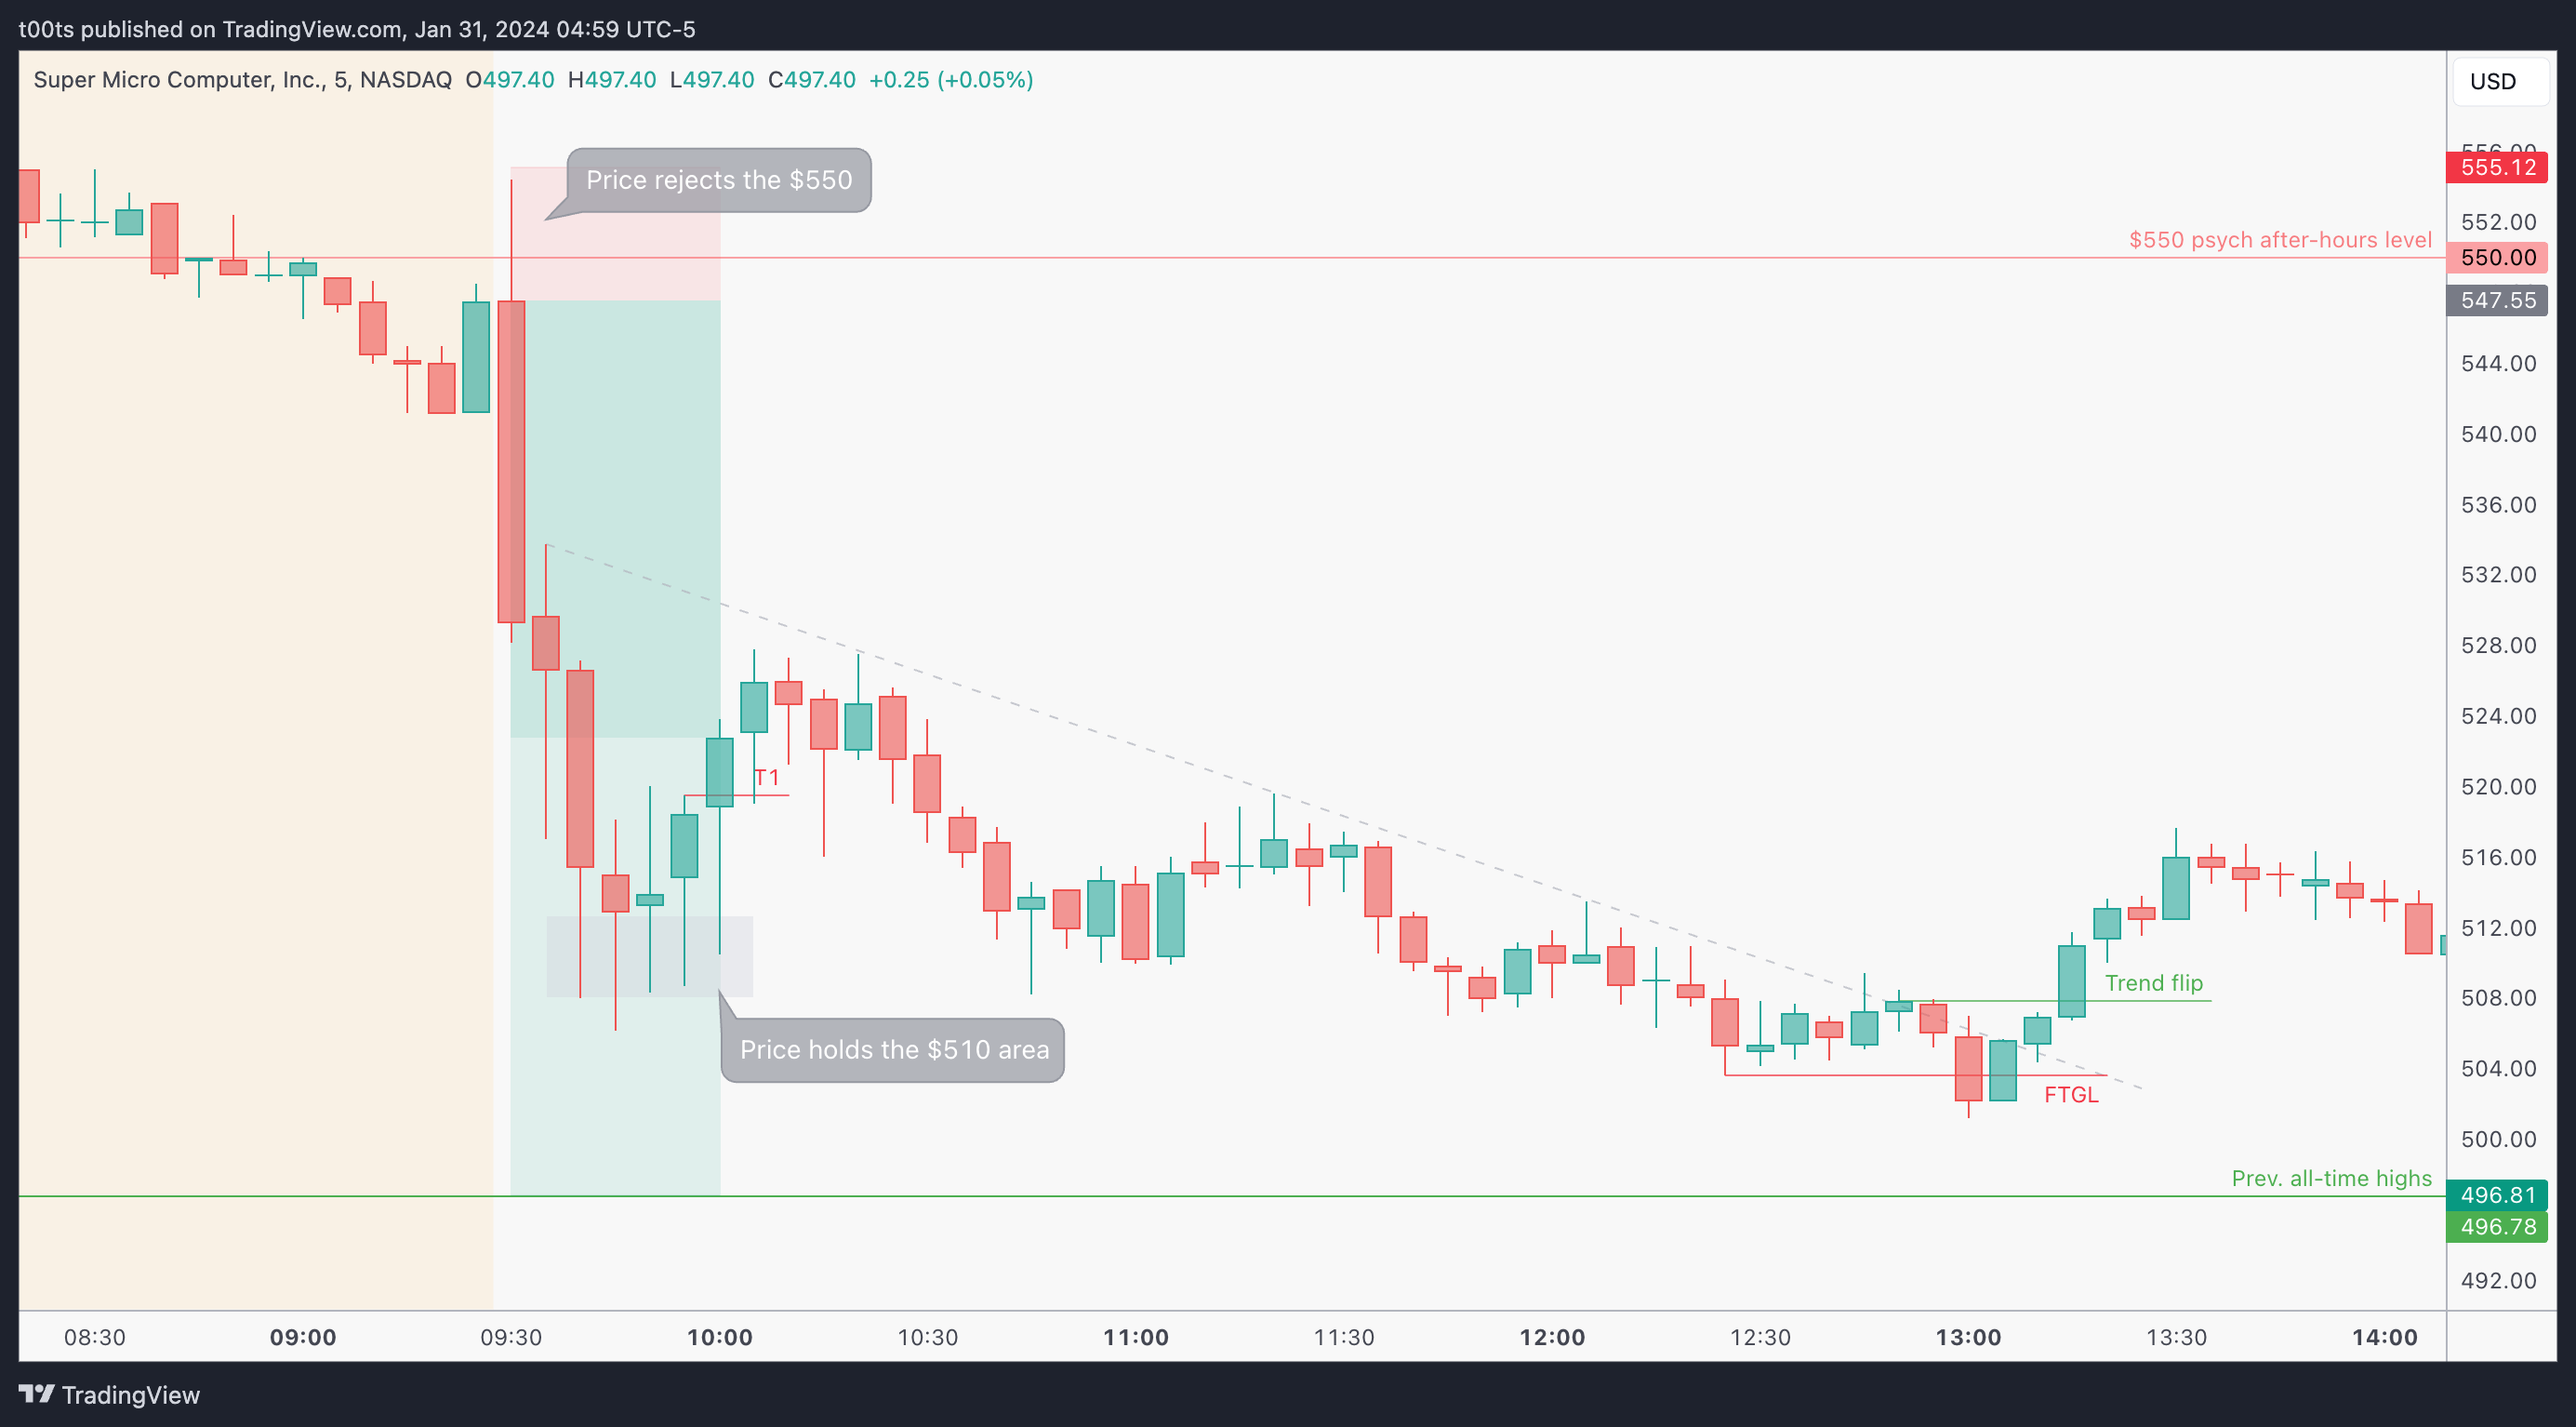
Just as we saw with 3M, these are trades you have to plan for and be quick in execution. If you think this is hindsight analysis, add it to your playbook and start watching for it.
The rejection and trigger happened during the first 30s of the day. Some people prefer to wait. As I've said many times, I like trading the open, especially if there's a catalyst and there's a solid plan that backs up your trade idea. We had both.
Accounting for slippage and a tidbit of human slowness, let's say you caught a fill around the $545 mark. The trade worked immediately. You experienced zero drawdown, and it was just a matter of holding. If that hadn't been the case and price still chopped around for a few minutes, I'd be looking for rejections around the opening print to add to my position trail my stop further.
The stock finds support around the $510 area, which means you're up roughly $35 points, while risking between $5 and $8. That's a good trade so far. In terms of targets, the obvious first target would be the $500 psych. level, which is consistent with our previous all-time high level of $496.78.
As I see all these wicks holding, I'd probably trail my stop to protect my profits. T1 is placed at the highs of an inside bar where sellers tried to bring price to the lows of the range and potentially break down, but bulls took over and the candle closes with an arguably bullish look. In the following bar, sellers manage to take price back down but again bulls hold the $510 area and trigger the stop.
My brother Charls specializes in shorting small-caps. He's a lot more used to holding these pullbacks than I am, and although he missed the initial entry, his trade proves that my suggested stop wasn't necessarily the best option. Instead, he stuck with the trade and patiently waited for the first real sign of the a trend flip before giving up on his short. In hindsight, I think he absolutely nailed the exit. Big props to him.
2m chart
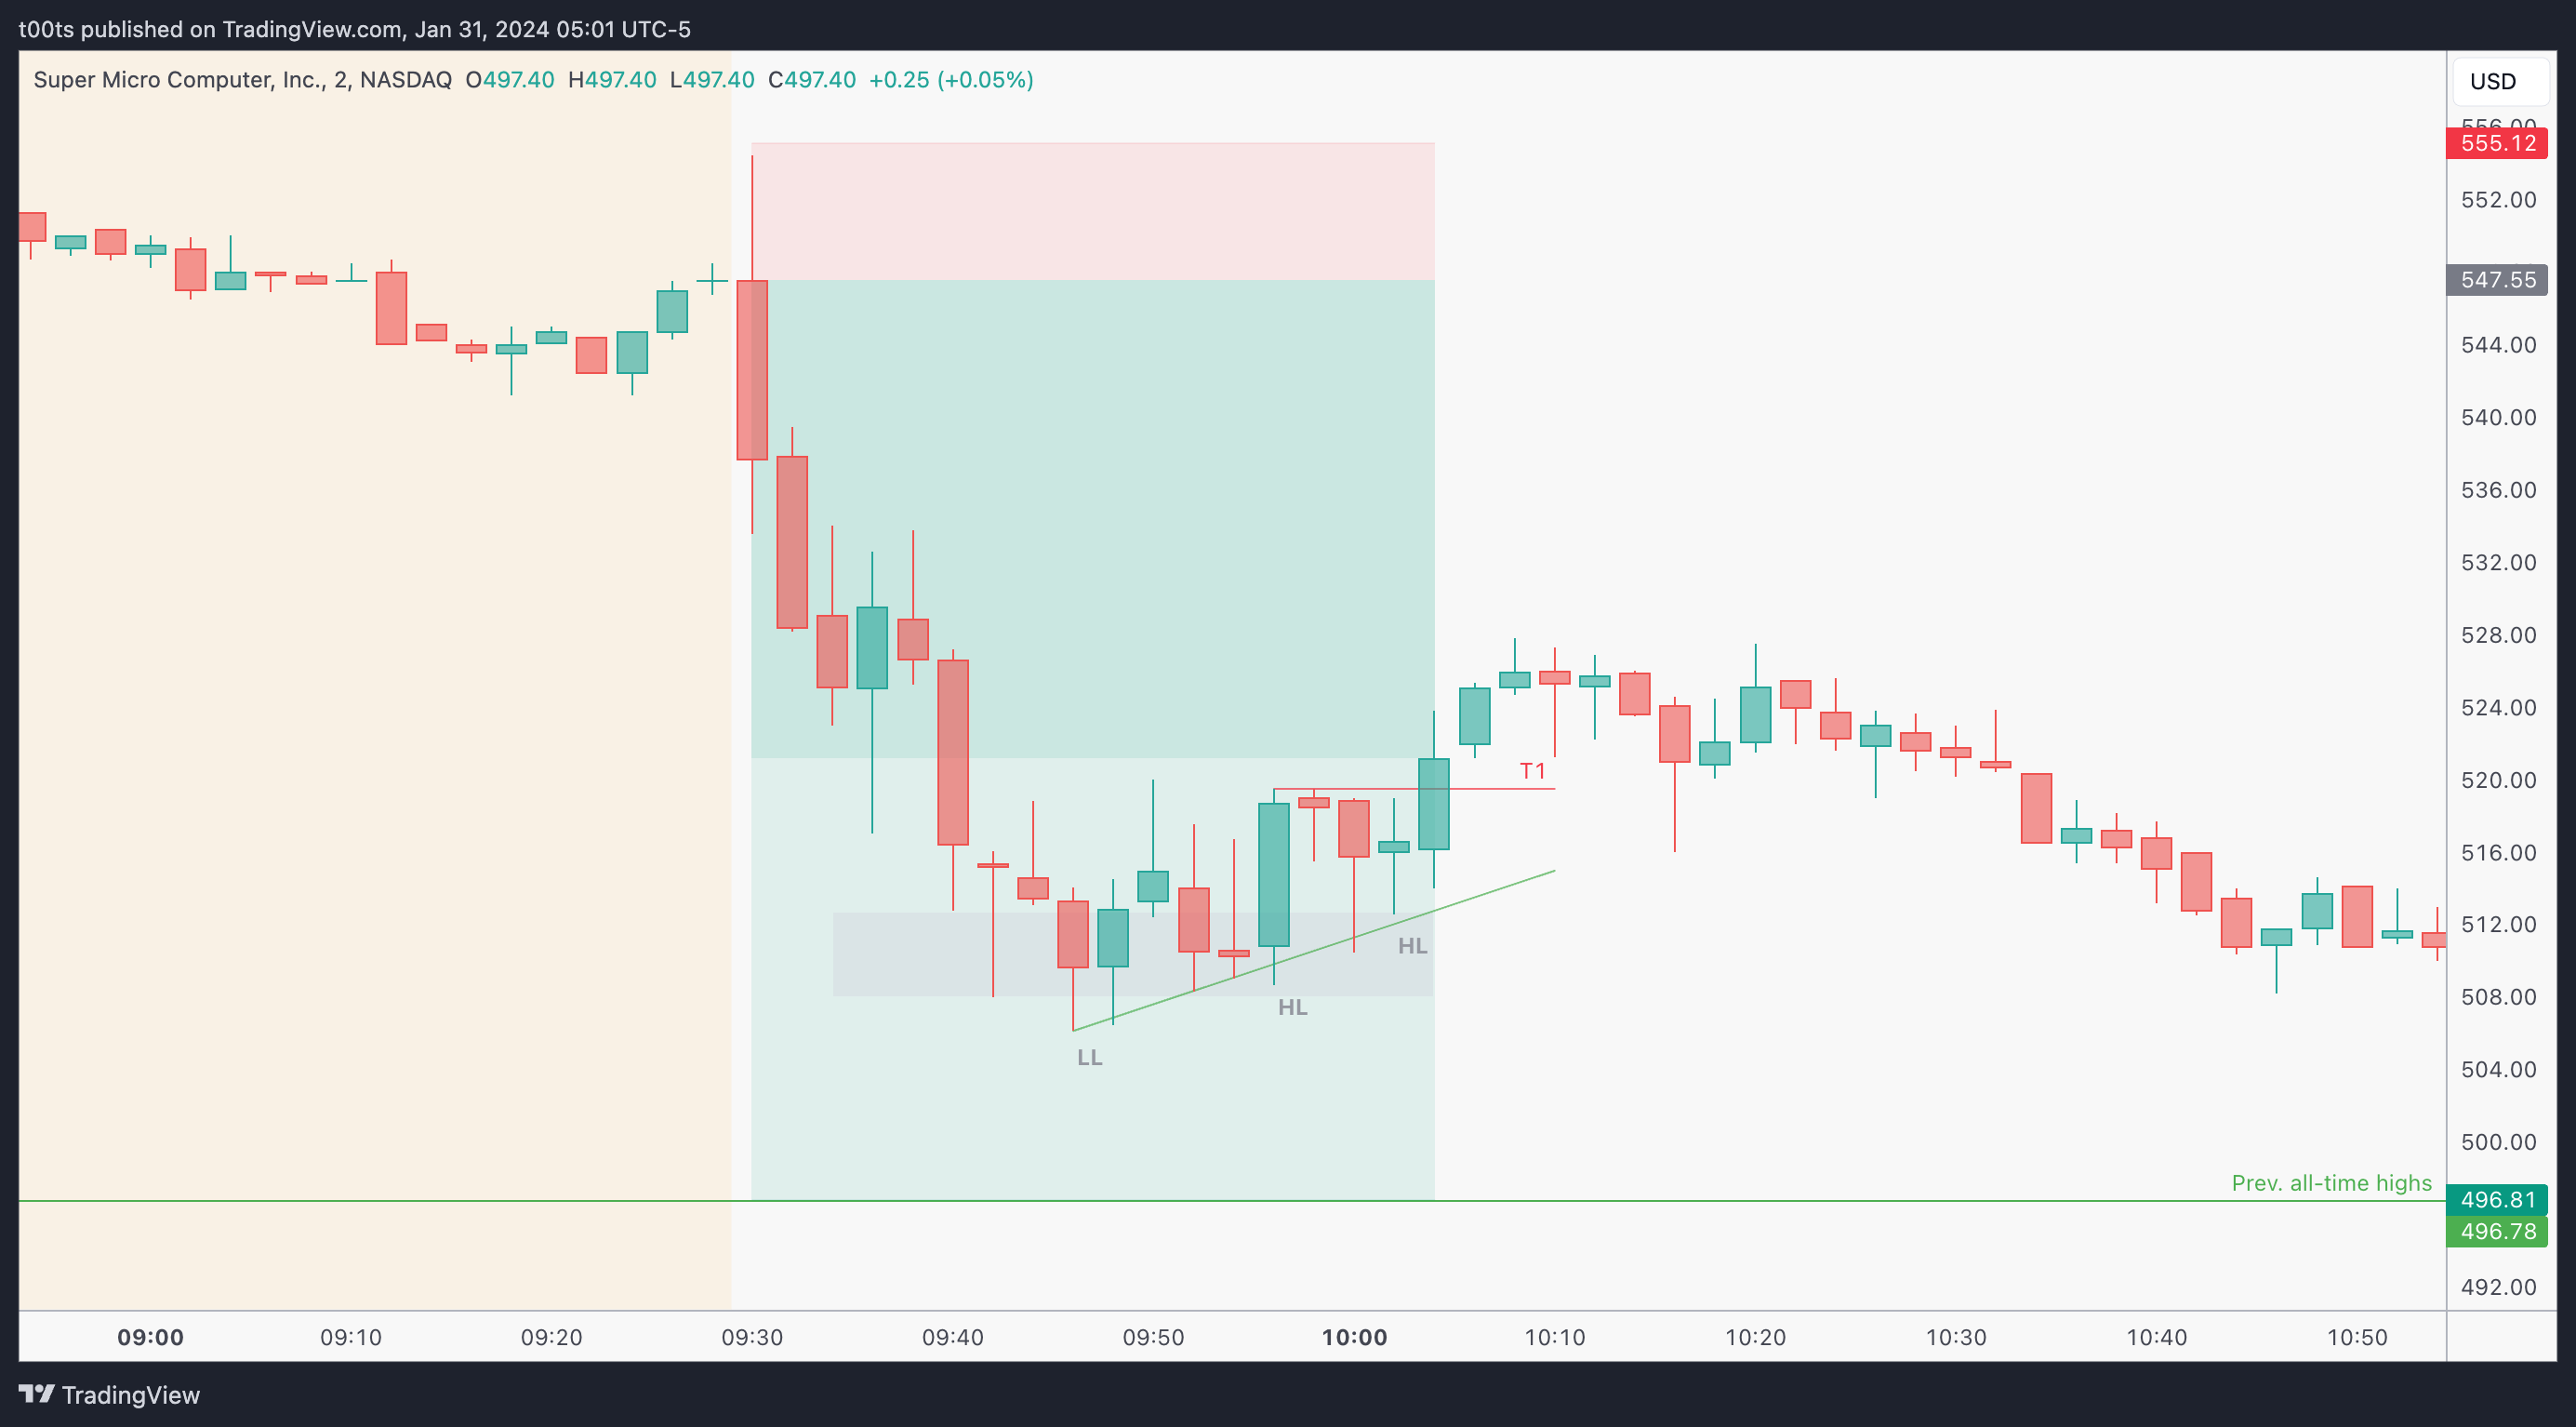
If you look at my stop on this 2m chart, it's really the first sign of a potential short-term trend flip. I'm pretty certain that if I was trading this name in real-time I would've surely sold most of my remaining position there. Not saying it’s ideal, that’s just my system.
15s chart
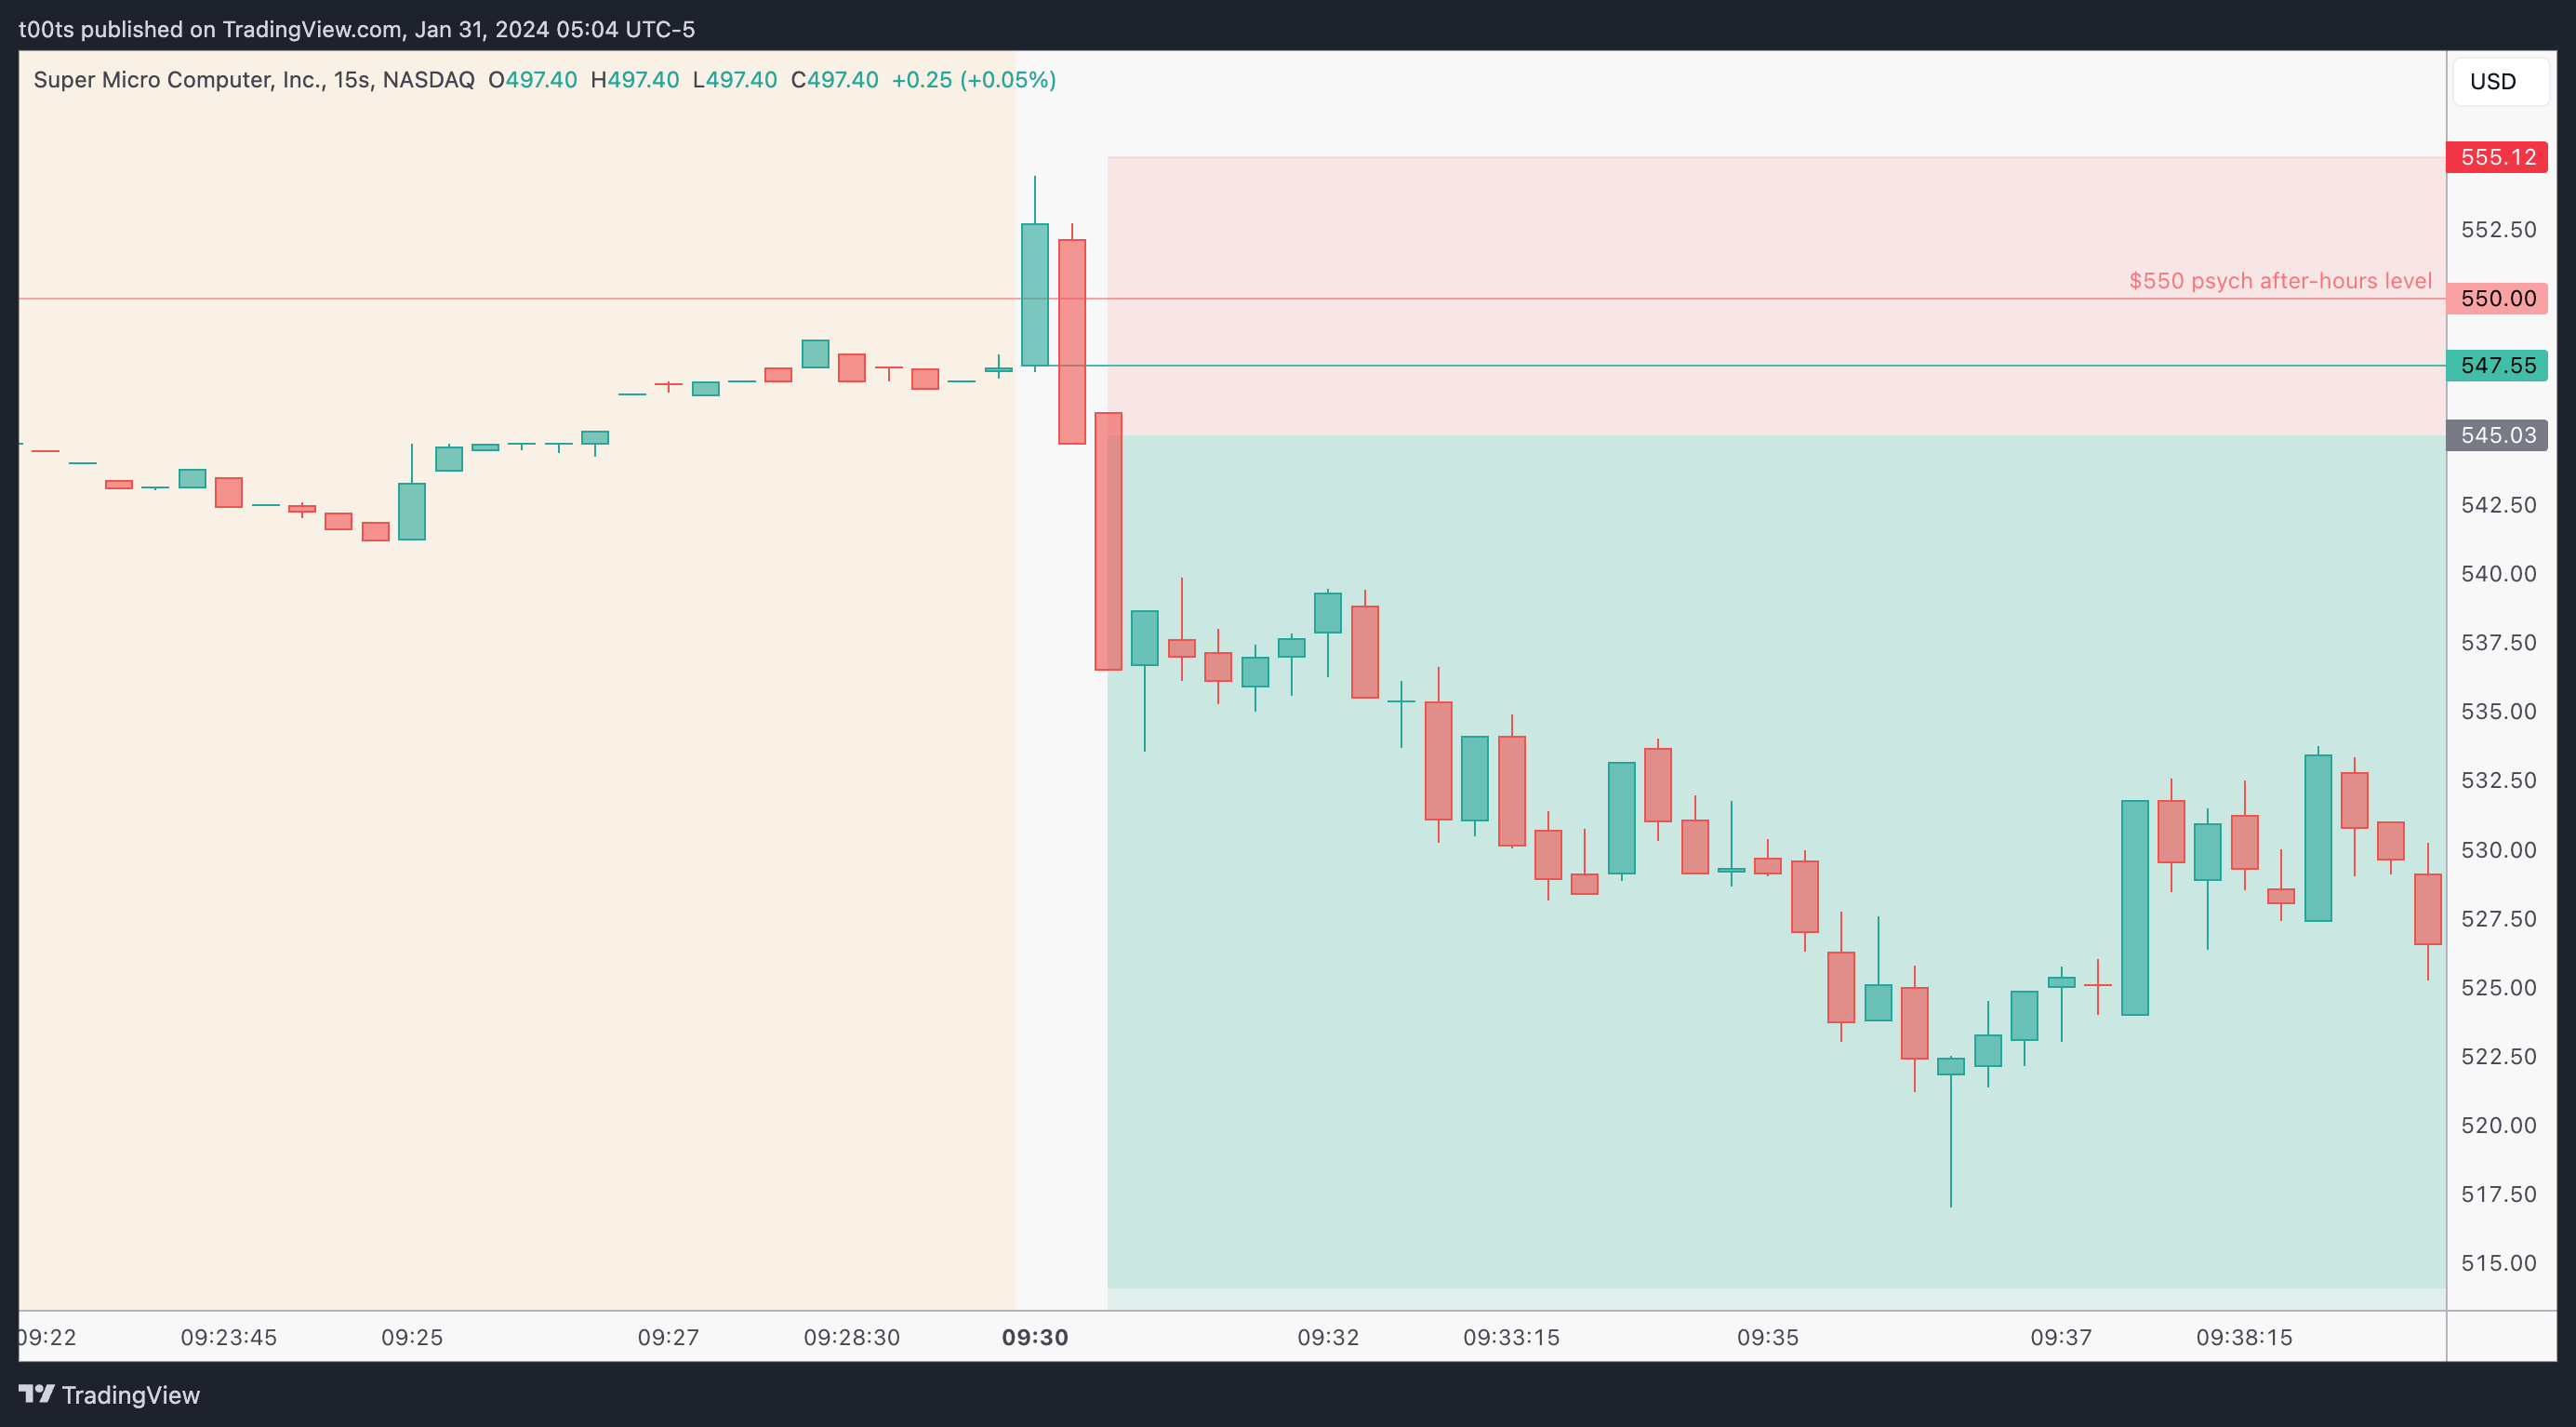
Disclaimer: Do NOT trade using second charts. I'm just using this to dissect what was happening in real-time. Please don't use them to trade unless it's part of a system with proven edge.
I like to bring these charts up when the action is quick on the open just so the reader can get a feel of what happened. Again, I come from a scalping background, where 15s plenty of time. Those first 15s of the day are where price attempted the reclaim of $550, and then failed.
Try counting to 15 right now. It's plenty of time!
Closing notes
I believe this pullback was expected by many, and price gave us enough cues to participate in it. I also believe this was more suited for stock traders than it was for option traders.
Implied volatility was probably still settling just 30s after the bell considering how large the overnight move was. With high IV, your option's Vega is jacked, which results in an increased premium. Right after earnings, options experience what's commonly referred to as “IV crush”. You don't want to get caught in that quick IV depreciation, as your contract will lose value regardless of what happens to the stock. It's better to wait or use shares.
This has been my attempt to give you insights into how I prepare and look for these opening drive trades where you have to be quick. Do these fail? Of course. But again, if you have your stop in place the market can't hurt you.
I am posting one trade writeup every day throughout 2024. I focus on large caps using levels and price action. The subscription is absolutely free and will always be. I will strive to provide value by offering clues and ideas for you to enhance your edge. Let’s grow together!