
3M (MMM) - Jan 23rd 2024
Capitalizing on earnings surprises by analyzing investor positioning

Higher timeframe context
While studying a chart ahead of an earnings release may seem somewhat irrelevant, it does help us frame the current situation from an investor standpoint.
Weekly chart
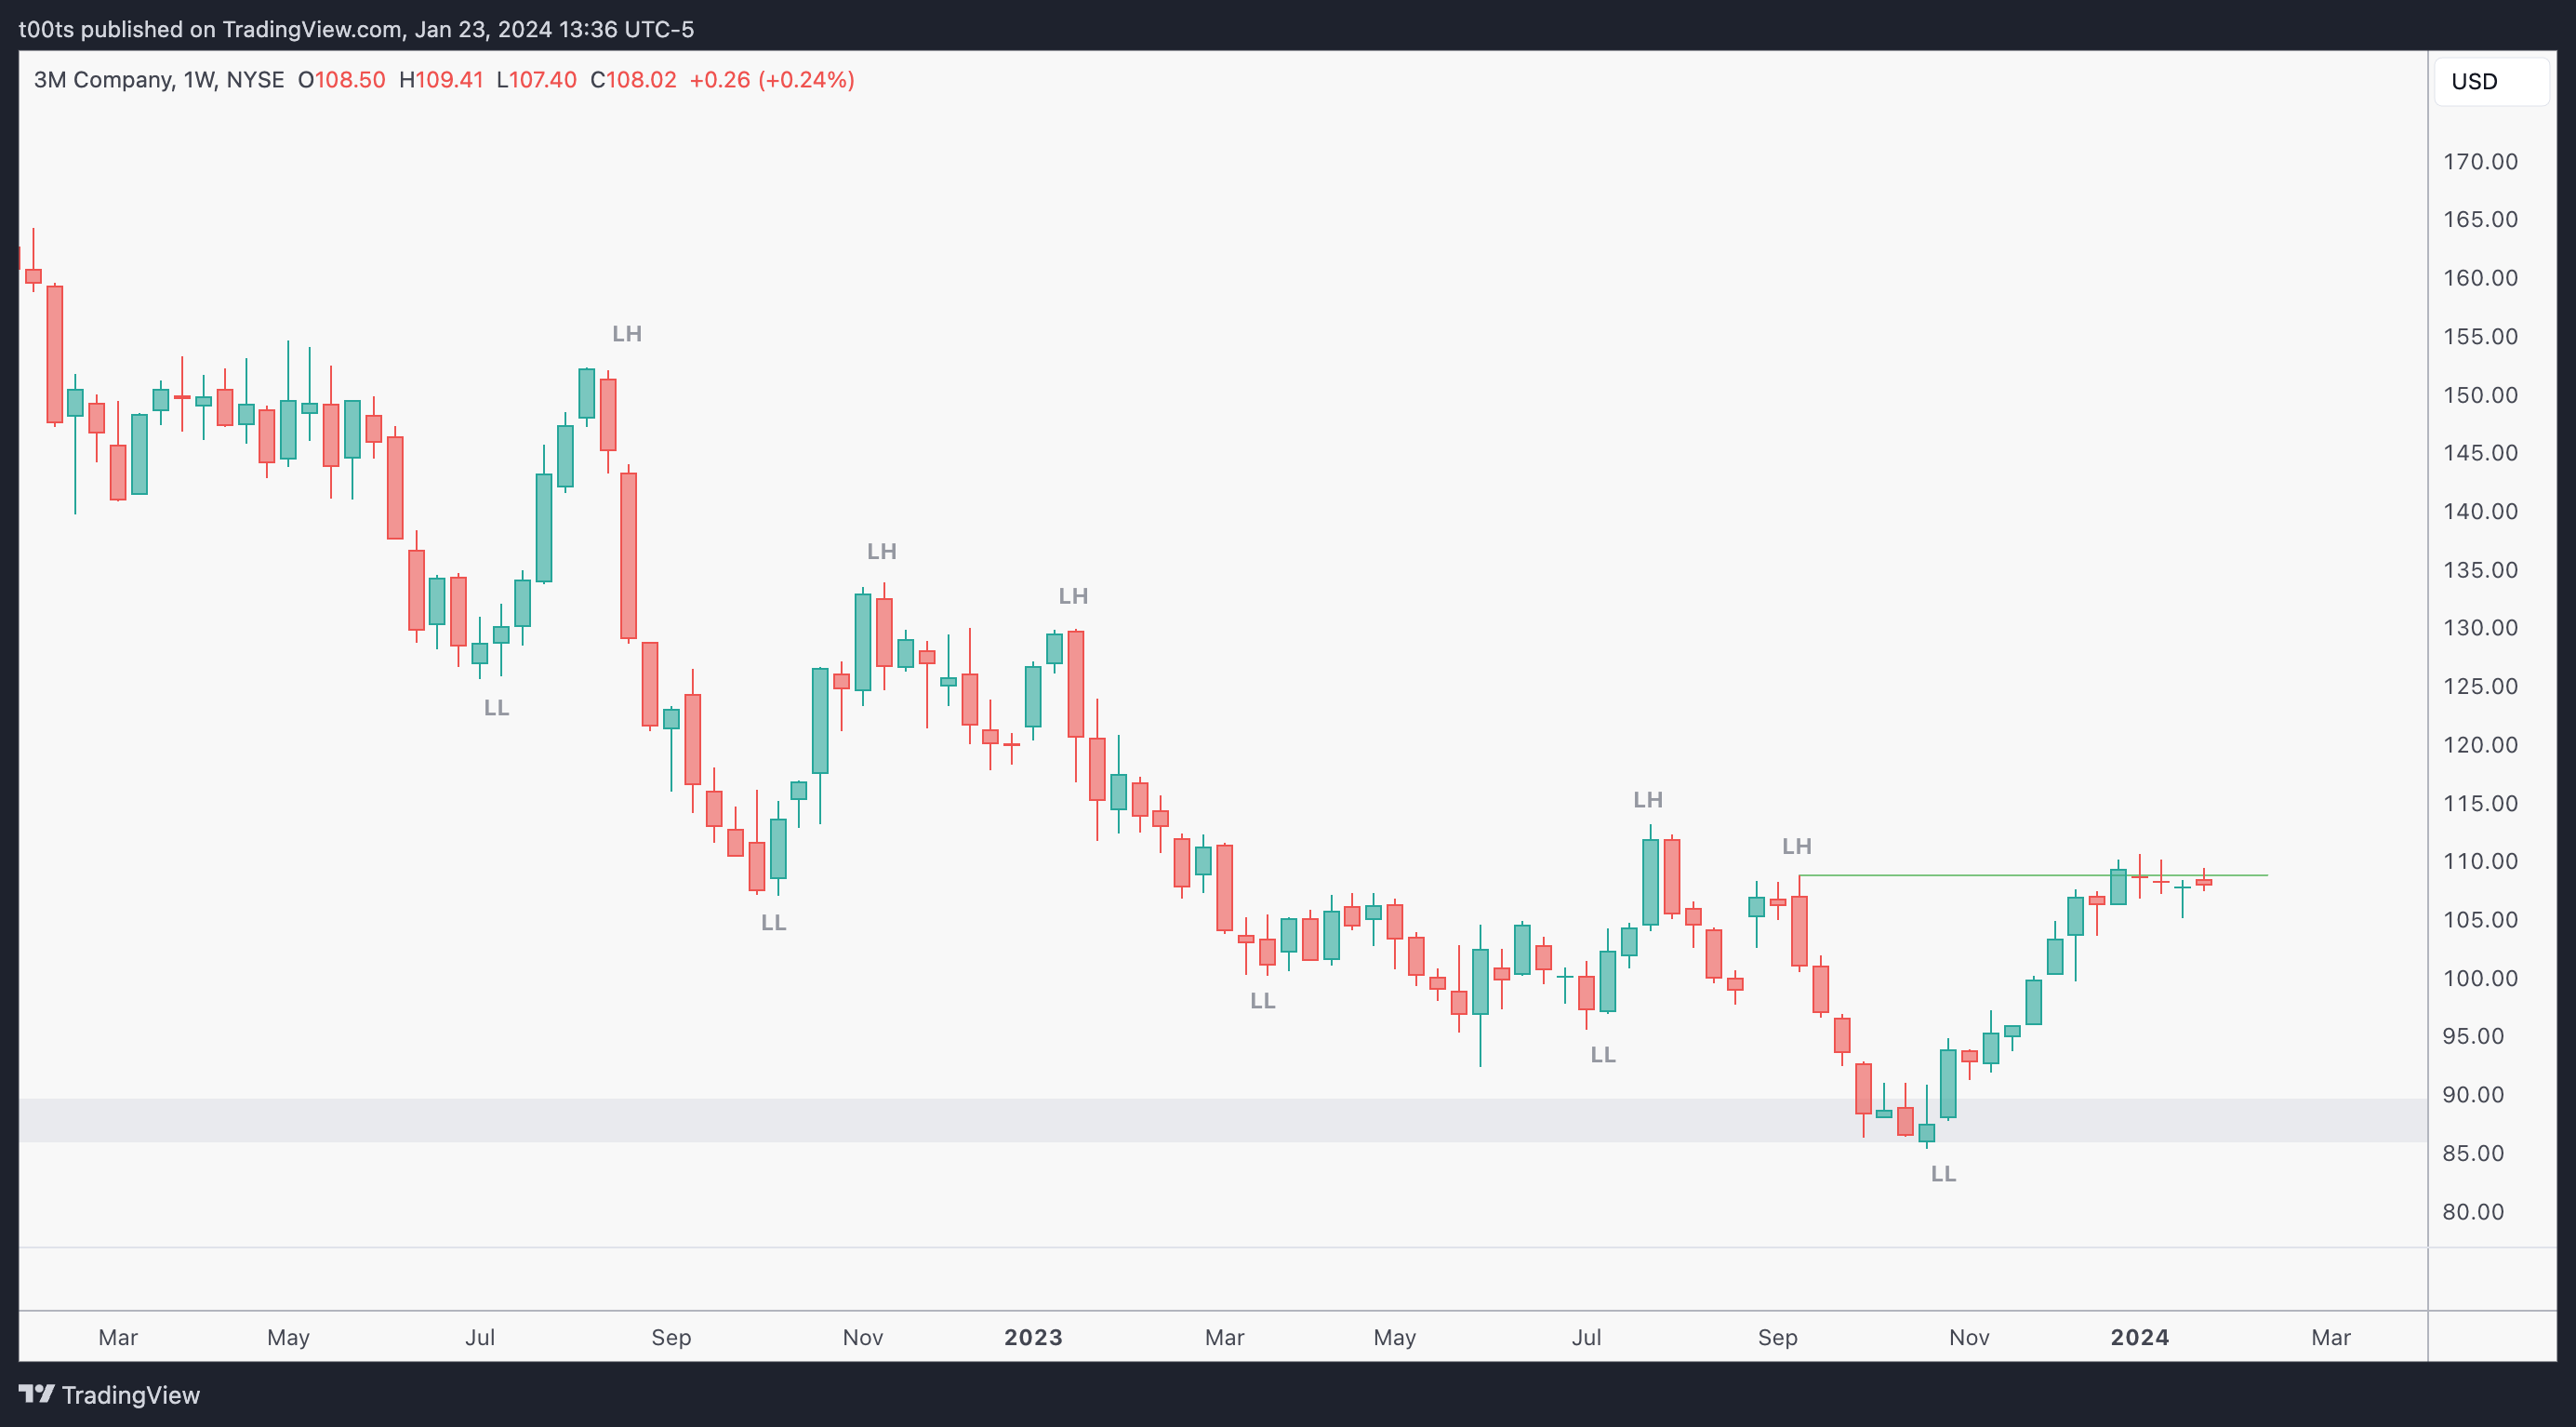
The weekly chart on MMM has been in a steady downtrend for a couple years (not shown). However, it’s worth pointing out how more recently bulls are actually very close to flipping the trend.
The $90 area held well and lead to a rally that took price back to the previous lower high pivot. Price has been consolidating in a super tight range for the past 5 weeks, and surely looks like it's setting up for a breakout to the upside.
Think about how excited everyone that bought under $100 is right now.
Daily chart
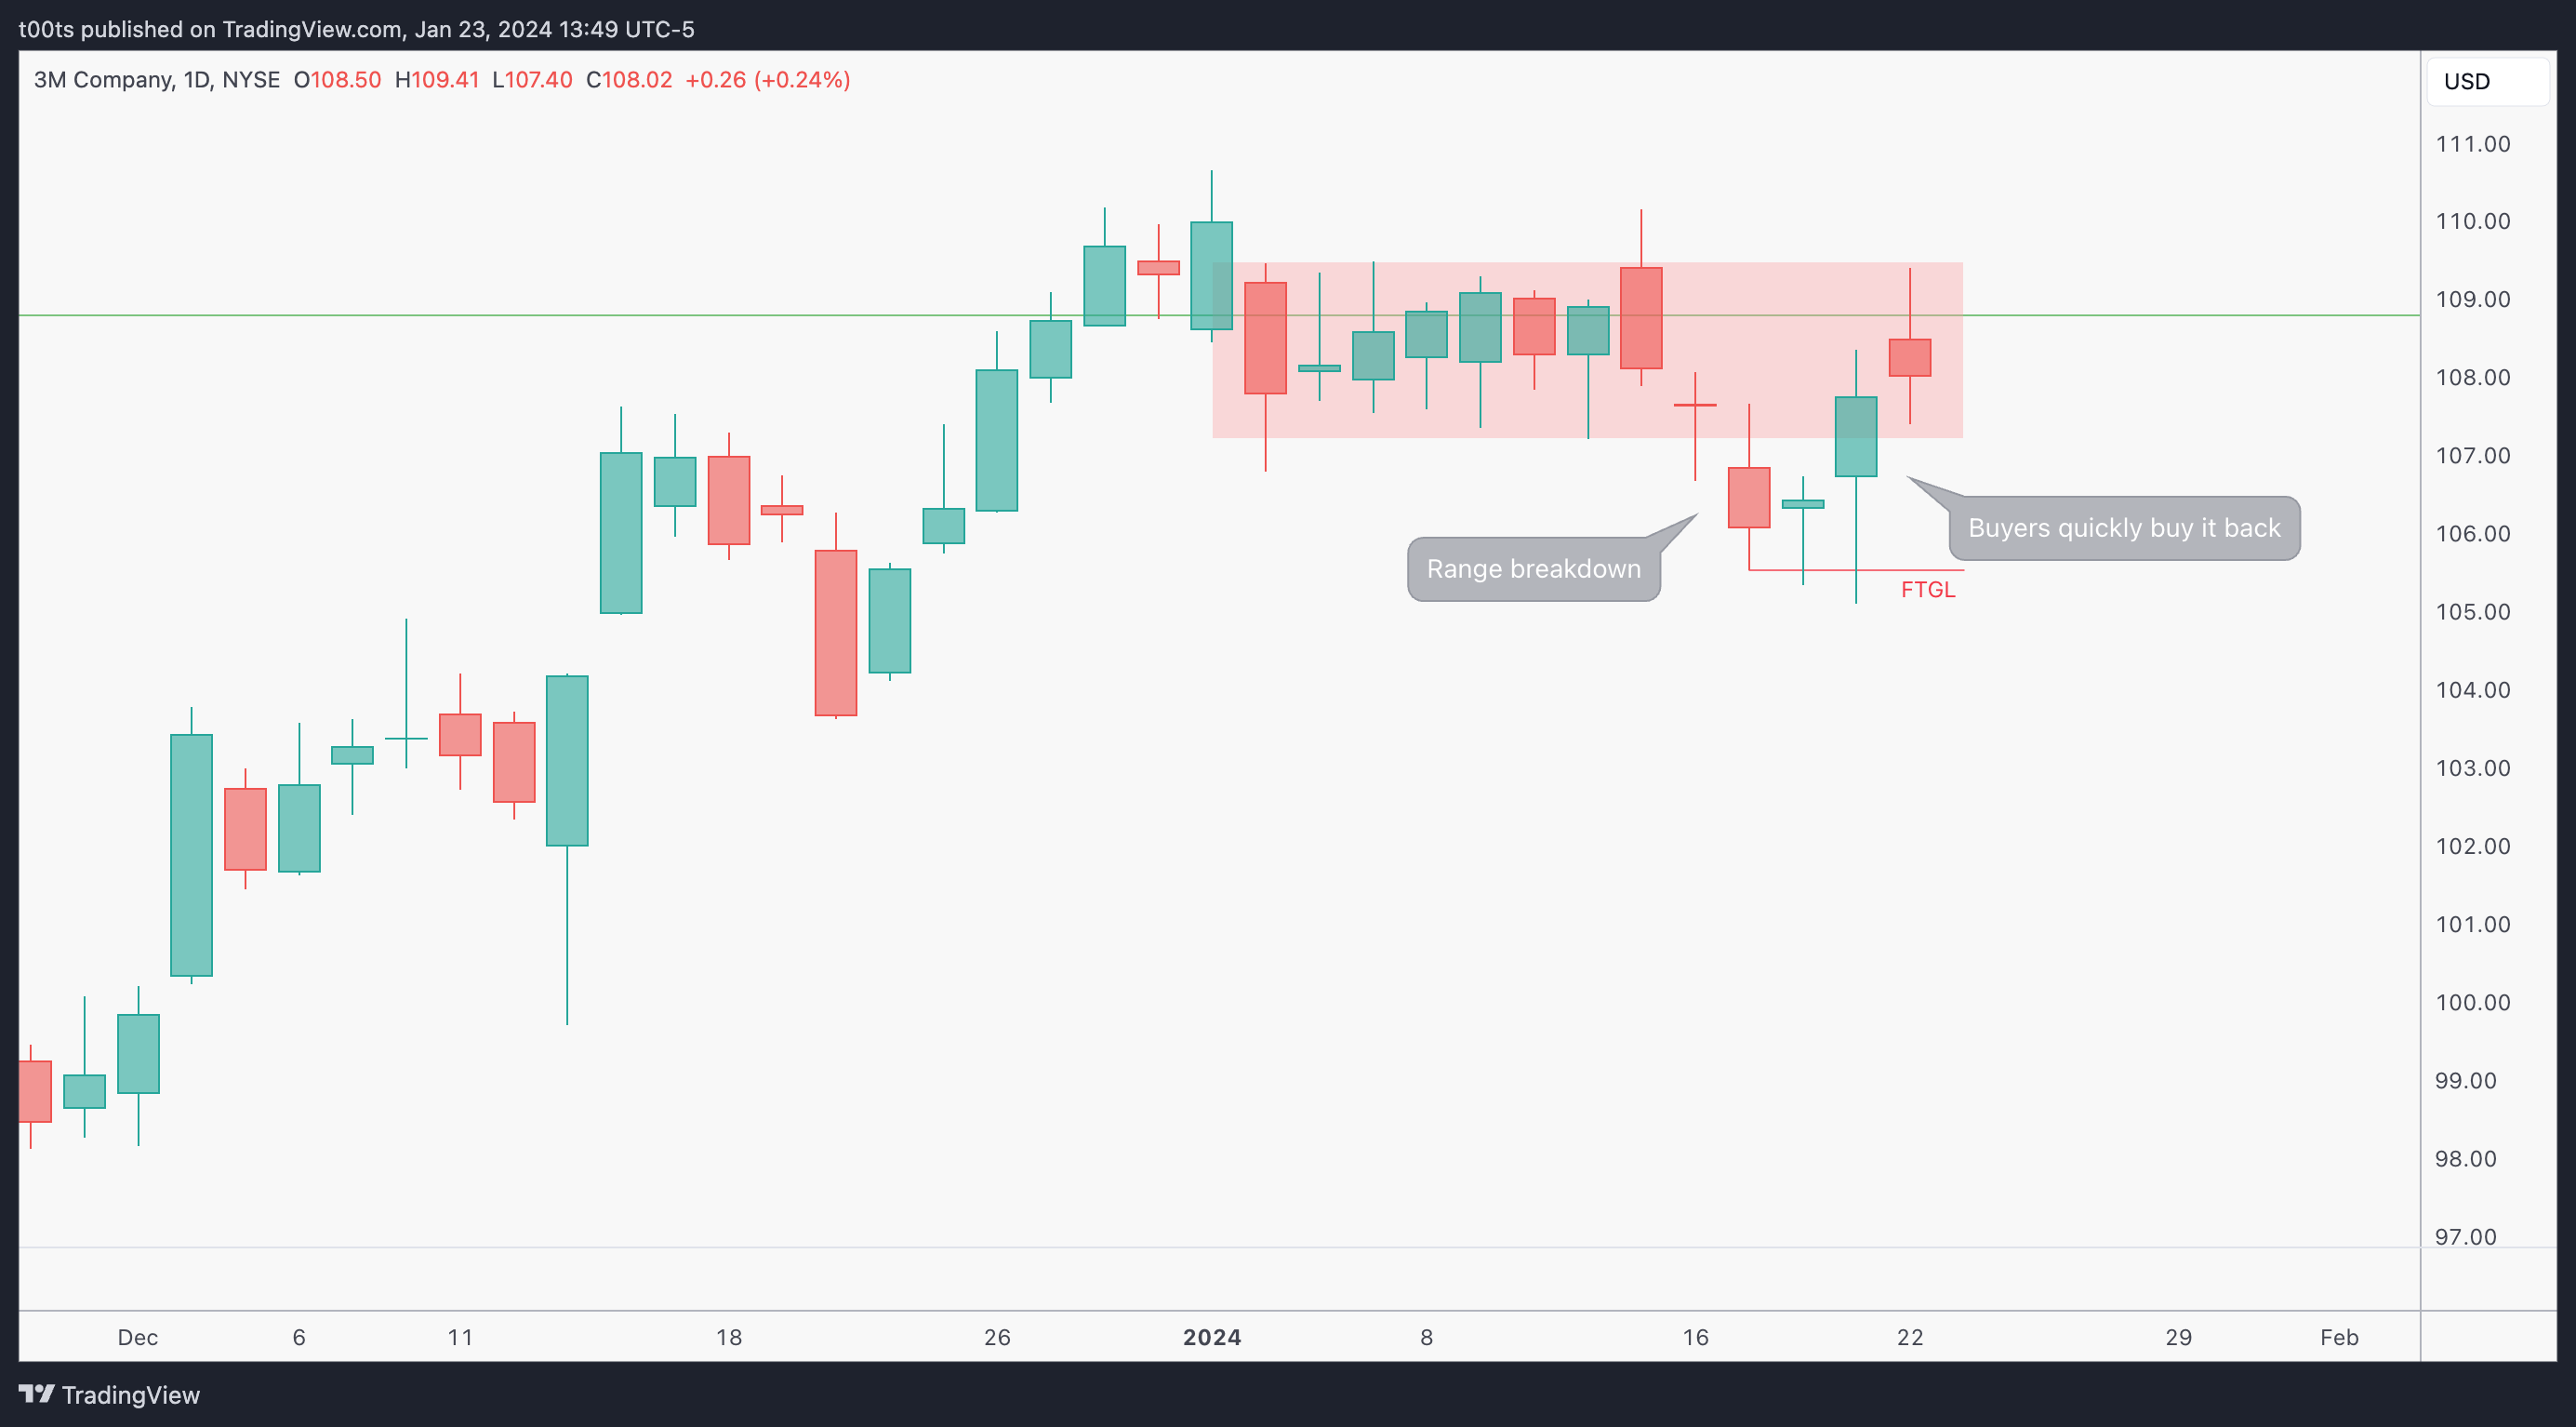
Notice how quickly bulls reclaim that range after the breakdown happens. Looking at the weekly chart at that point you'd expect a bit of a larger pullback, but buyers bid the stock back up immediately.
Hourly chart
Skipping the hourly chart today because the stock is gapping down over 7% after their earnings report, so there's nothing relevant to guide us here.
Pre-market action
3M actually beat expectations for the fourth quarter, but their management outlook for 2024 fell below expectations. Guidance is usually what drives the markets. For most investors, future outlooks have a superior weight than a quarter's performance. Which makes total sense.
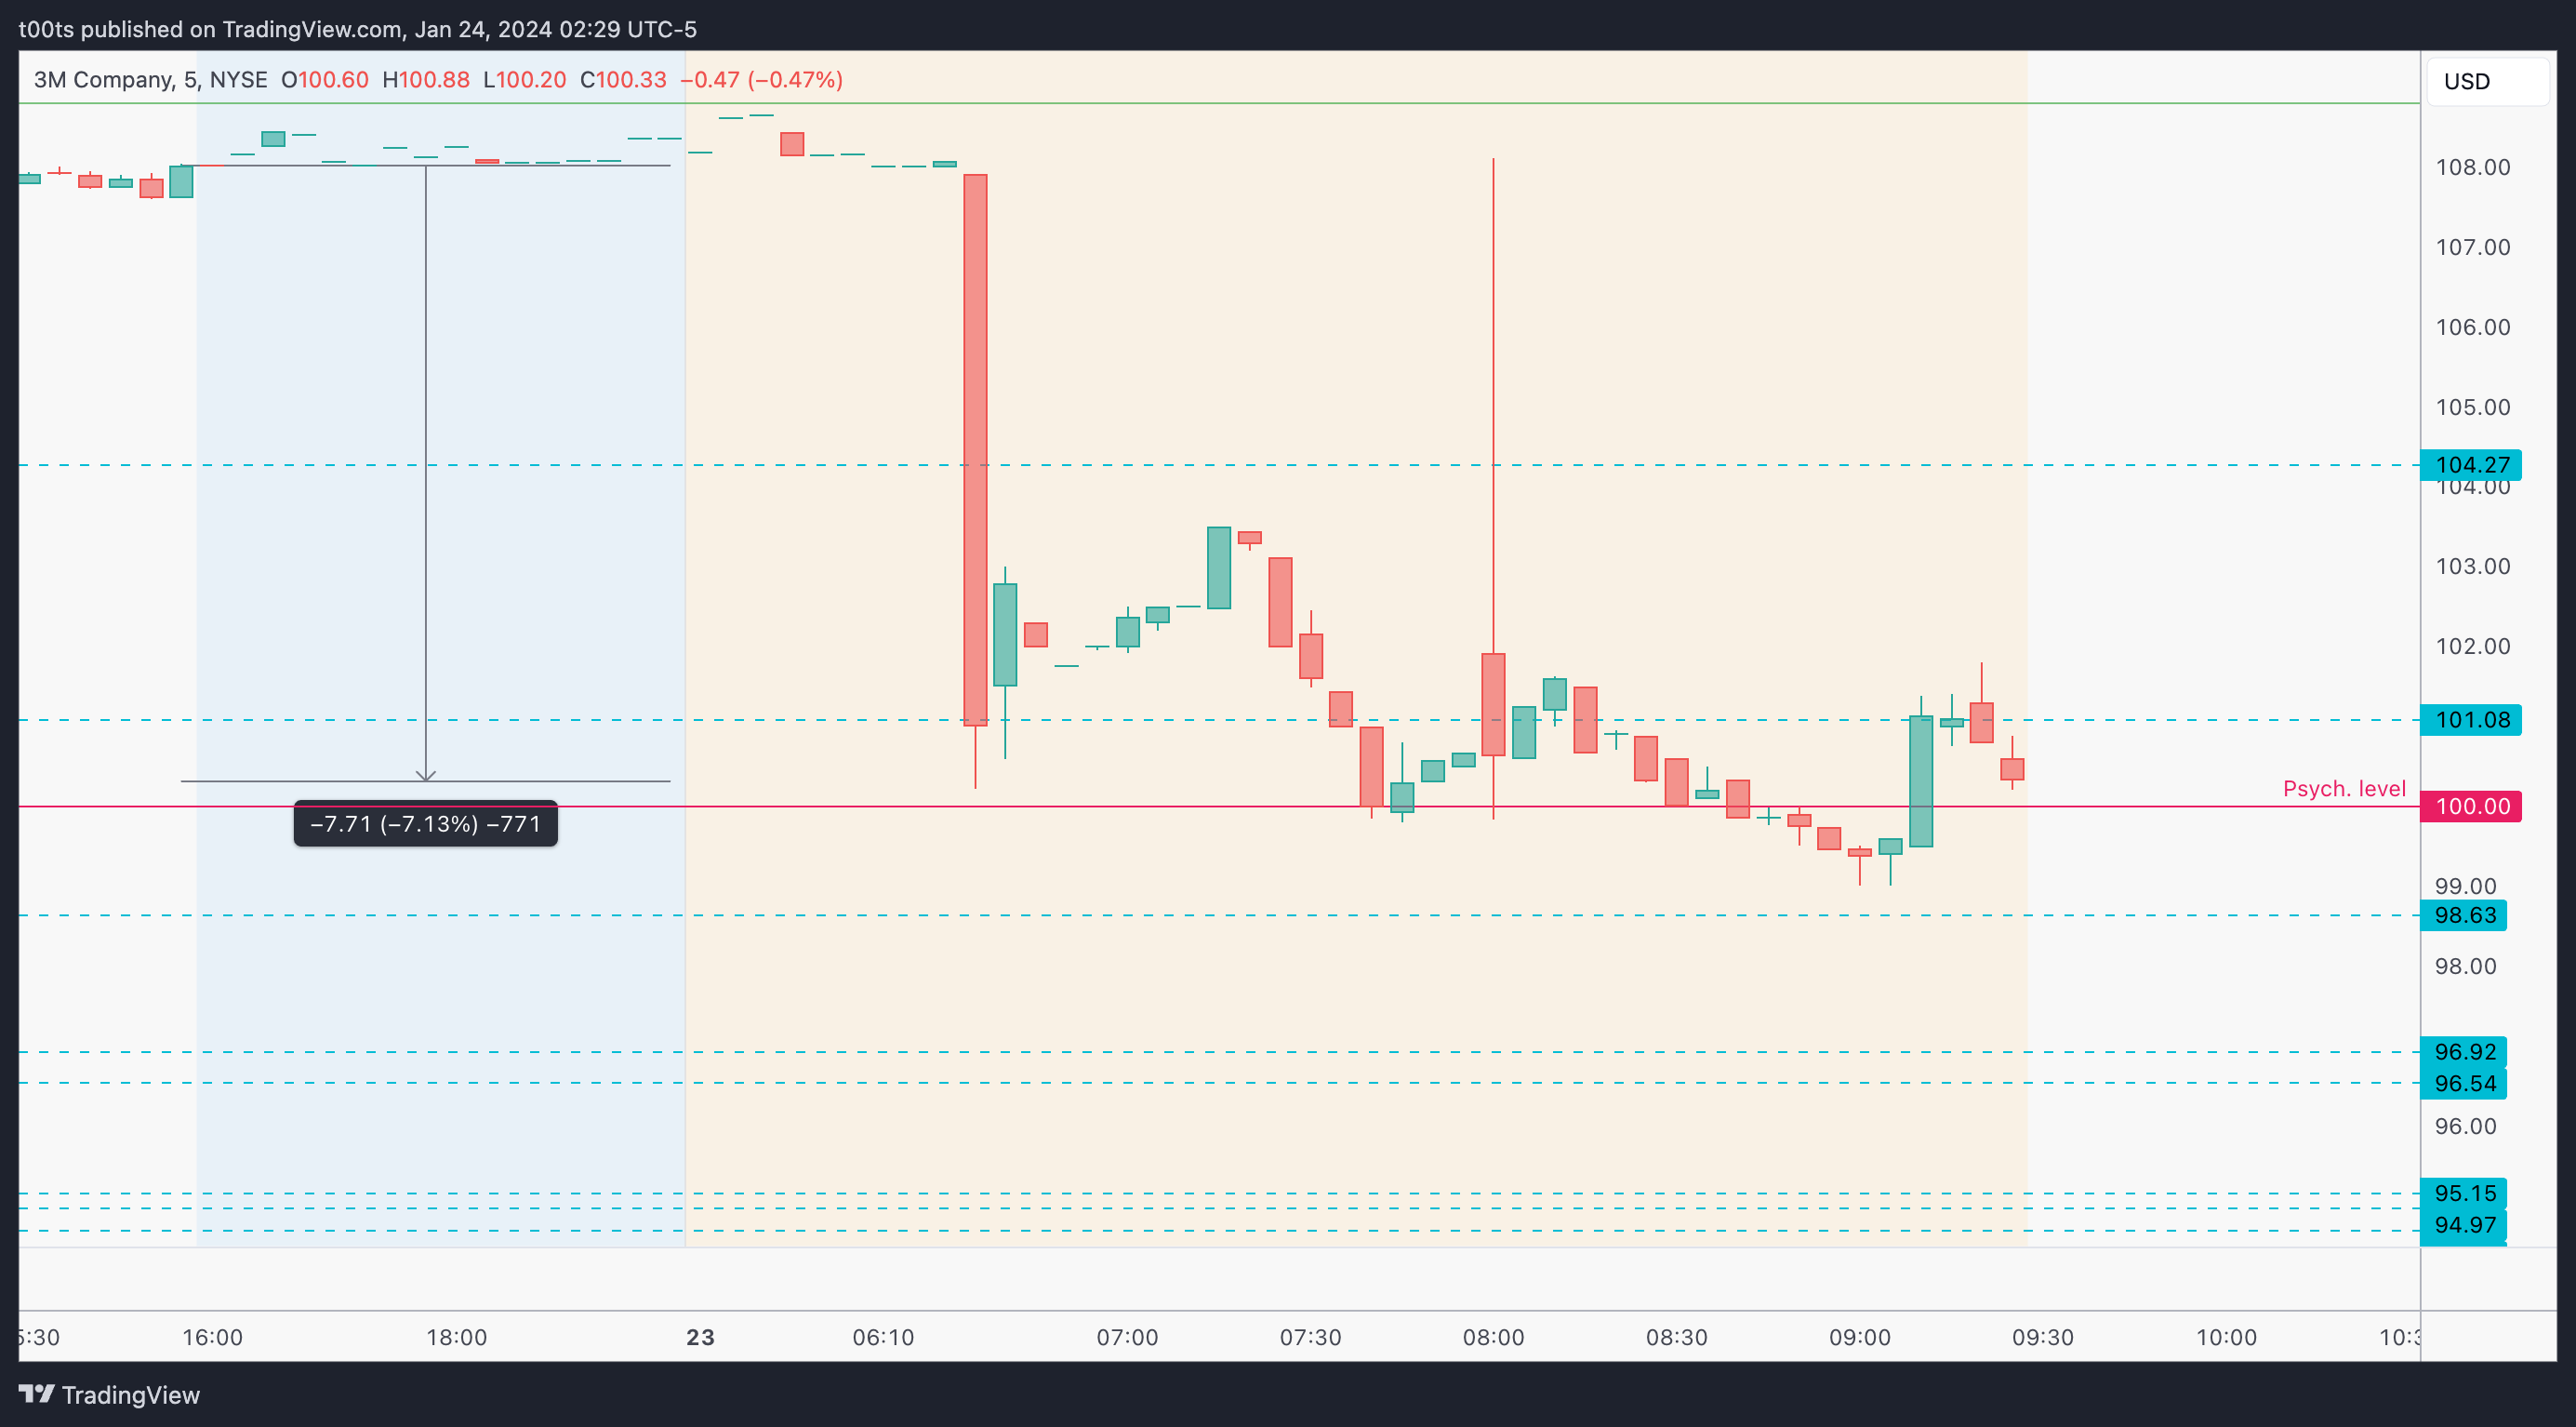
When a company reports weak (or strong) guidance, that becomes a very powerful cue in itself. In this case, we can see how the stock is down significantly after the announcement, and set to open around 7% lower than the previous close.
So far the $100 psychological level is holding.
The trade
Using our CPT Framework:
Cue(s)
Stock has been on a multi-year downtrend
Company has reported weak guidance and dropped 7% in the pre-market
A lot of participants are sitting long since this last rally and consolidation
Many of these longs will probably get nervous if price loses the $100 mark
Plan
There's probably many longs watching the $100 level and hoping for a bounce. Some of them may even have stops below that level. We're interested in watching how price reacts there and of course we need a plan for both sides:
$100 bounces: No longs unless $101.08 is reclaimed. Also, we're not really interested in longs at all. Remember the weak guidance?
$100 breaks down: Investors in pain. If $101.08 is tested and rejected, short on the break of $100. Otherwise, look for a lower high on the 2m.
Trigger(s)
Price trading below $100 if $101.08 was tested and rejected, otherwise, a sell setup triggering on the 2m chart.
5m chart
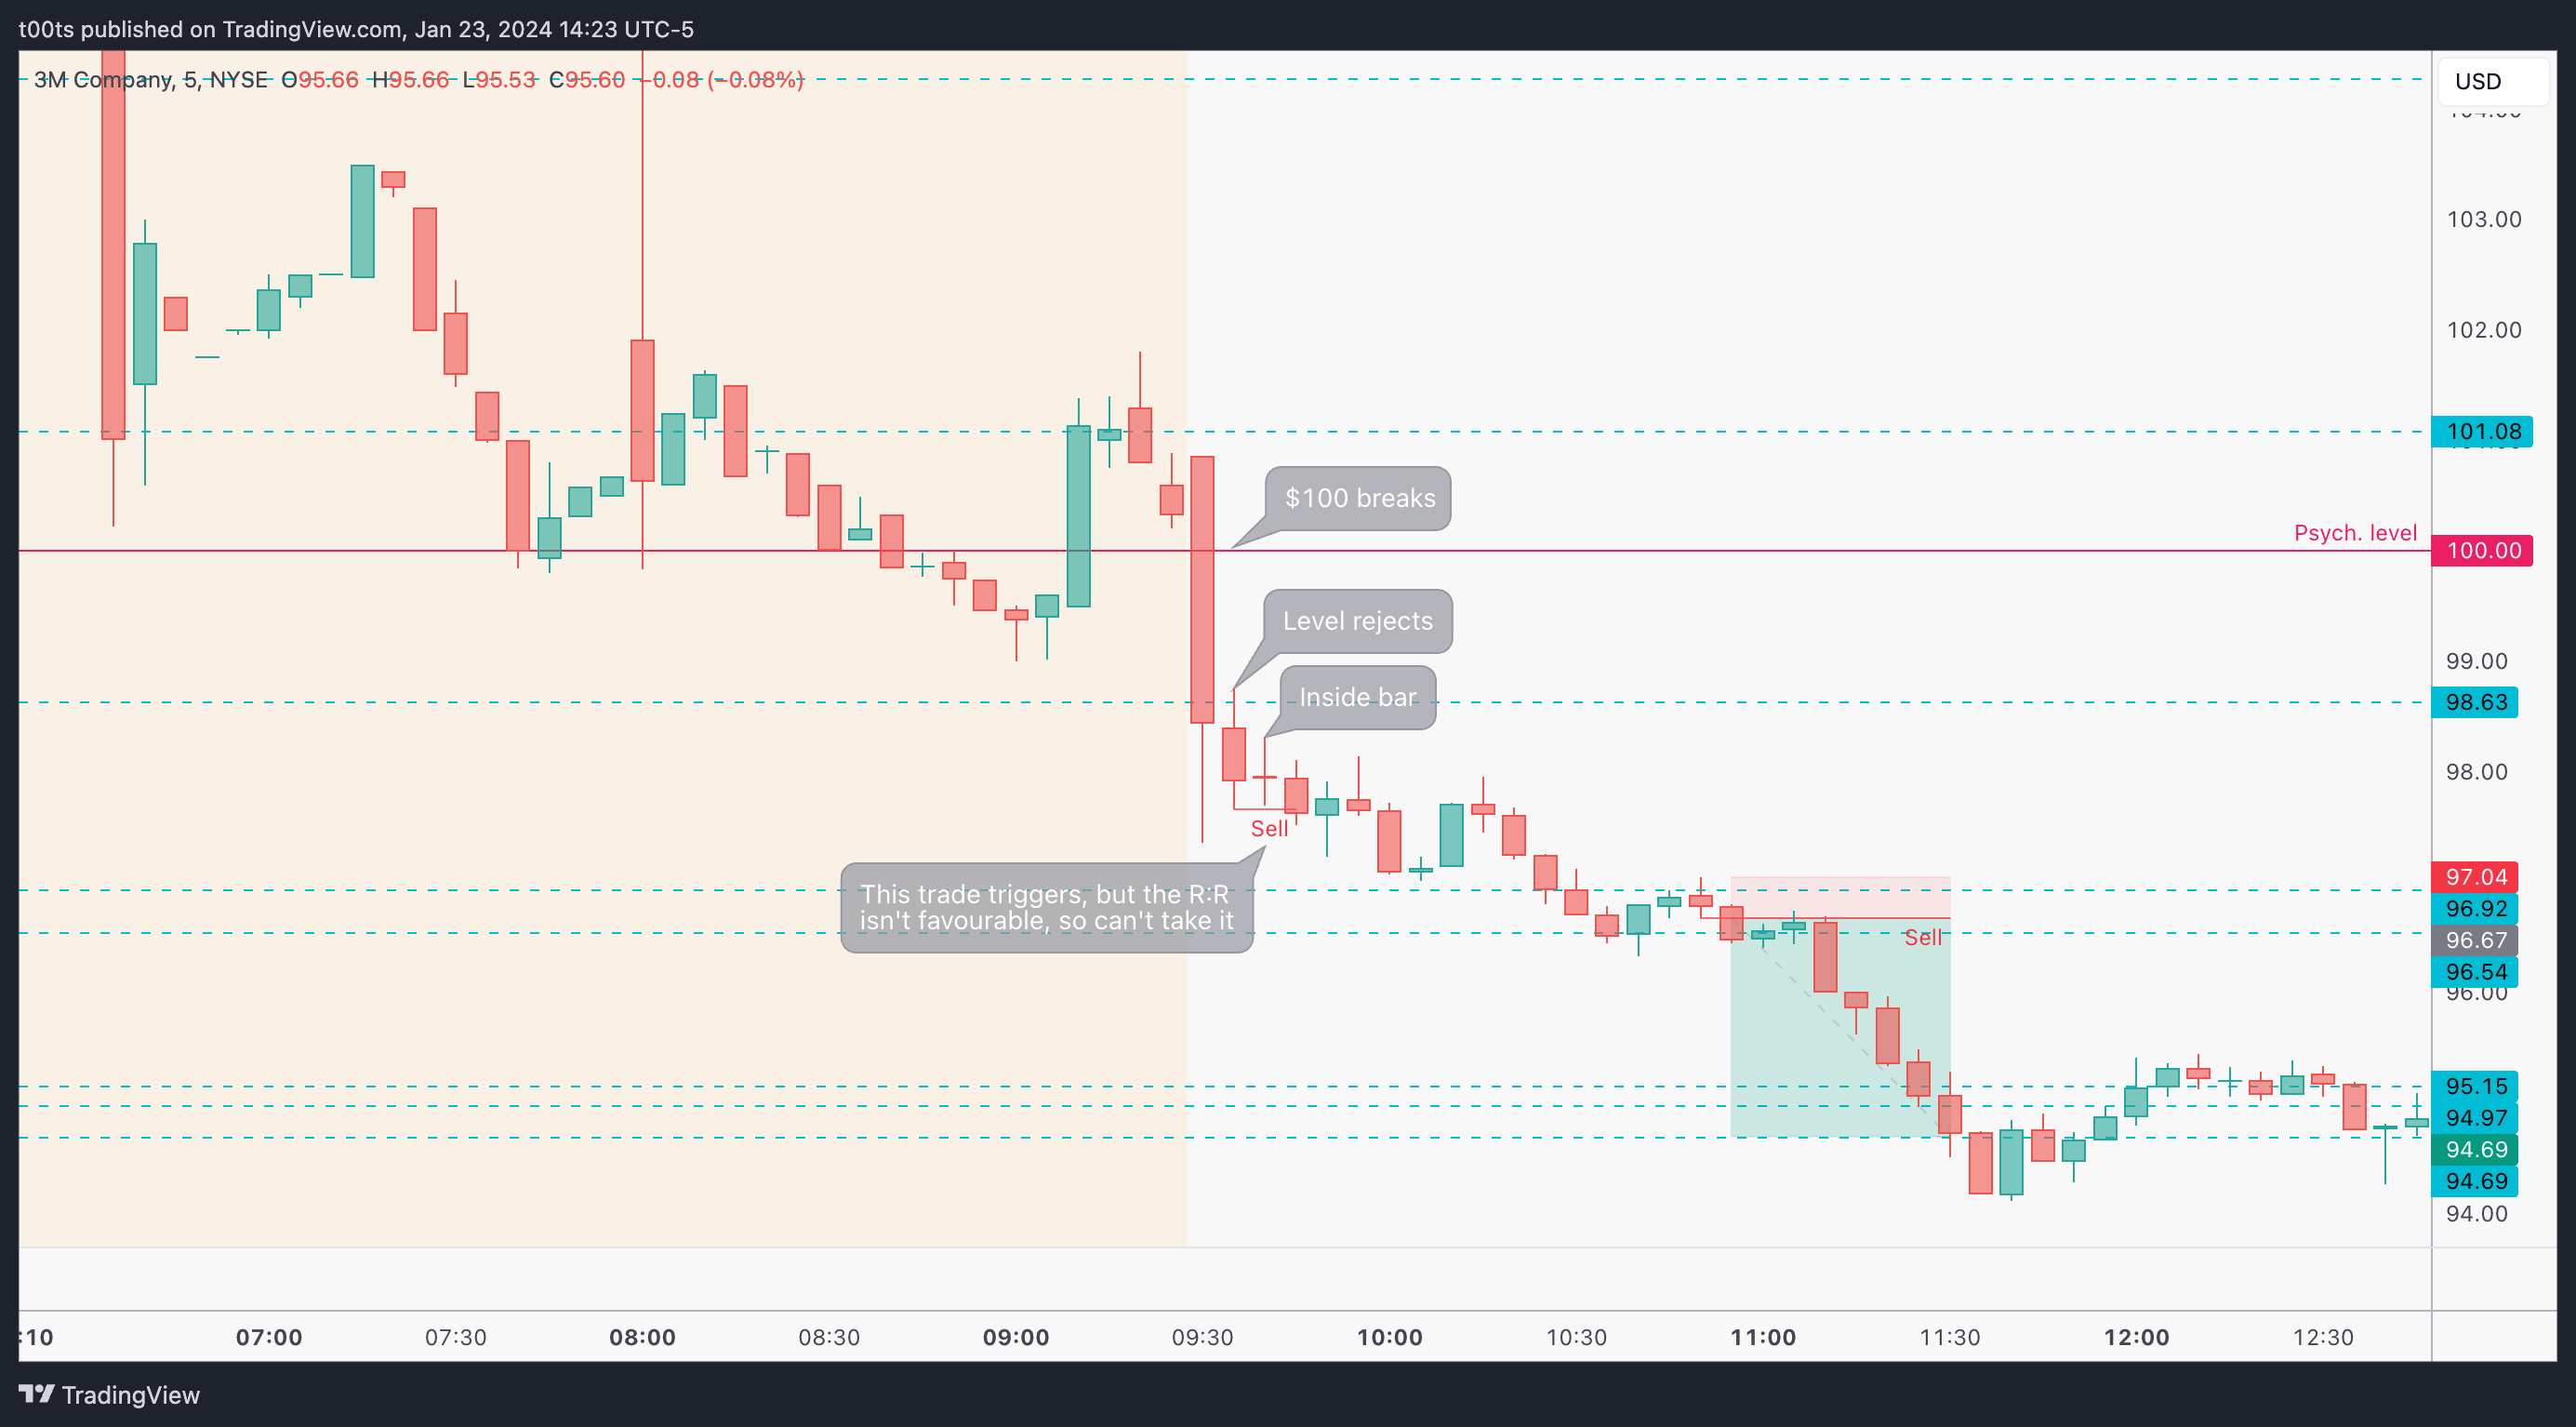
Unless you're aggressive with your entries there was little room to get involved in this 5m chart until later in the day. When I say aggressive, I mean shorting straight off the open the moment that $100 level breaks down, which would make sense because you can either risk against it, or use the opening print or the $101.08 level above to place your stop.
We mentioned we wanted to see the reactions to the $100, and honestly, for some people this drop may have been quick, so it's a lot more realistic to say that you could start looking to get involved after the breakdown and retest of the $98.63 level. On this 5m chart, price very conveniently puts in an inside bar after the rejection, which we can use for entries. The problem was that the R:R was not favorable on this trade, so even if it triggered, it didn't make sense from a risk-to-reward perspective when you're trading exclusively off the 5m chart.
The trend continues as investors unload shares at a loss, and eventually there's a point where we get a small bearish doji rejecting off the $96.92 level, which offers a decent trade opportunity if we assume the lows of the day break and we get to the next crowded area.
To capture this trade you had to wait a little too long though. Let's see how we could've been involved earlier.
2m chart
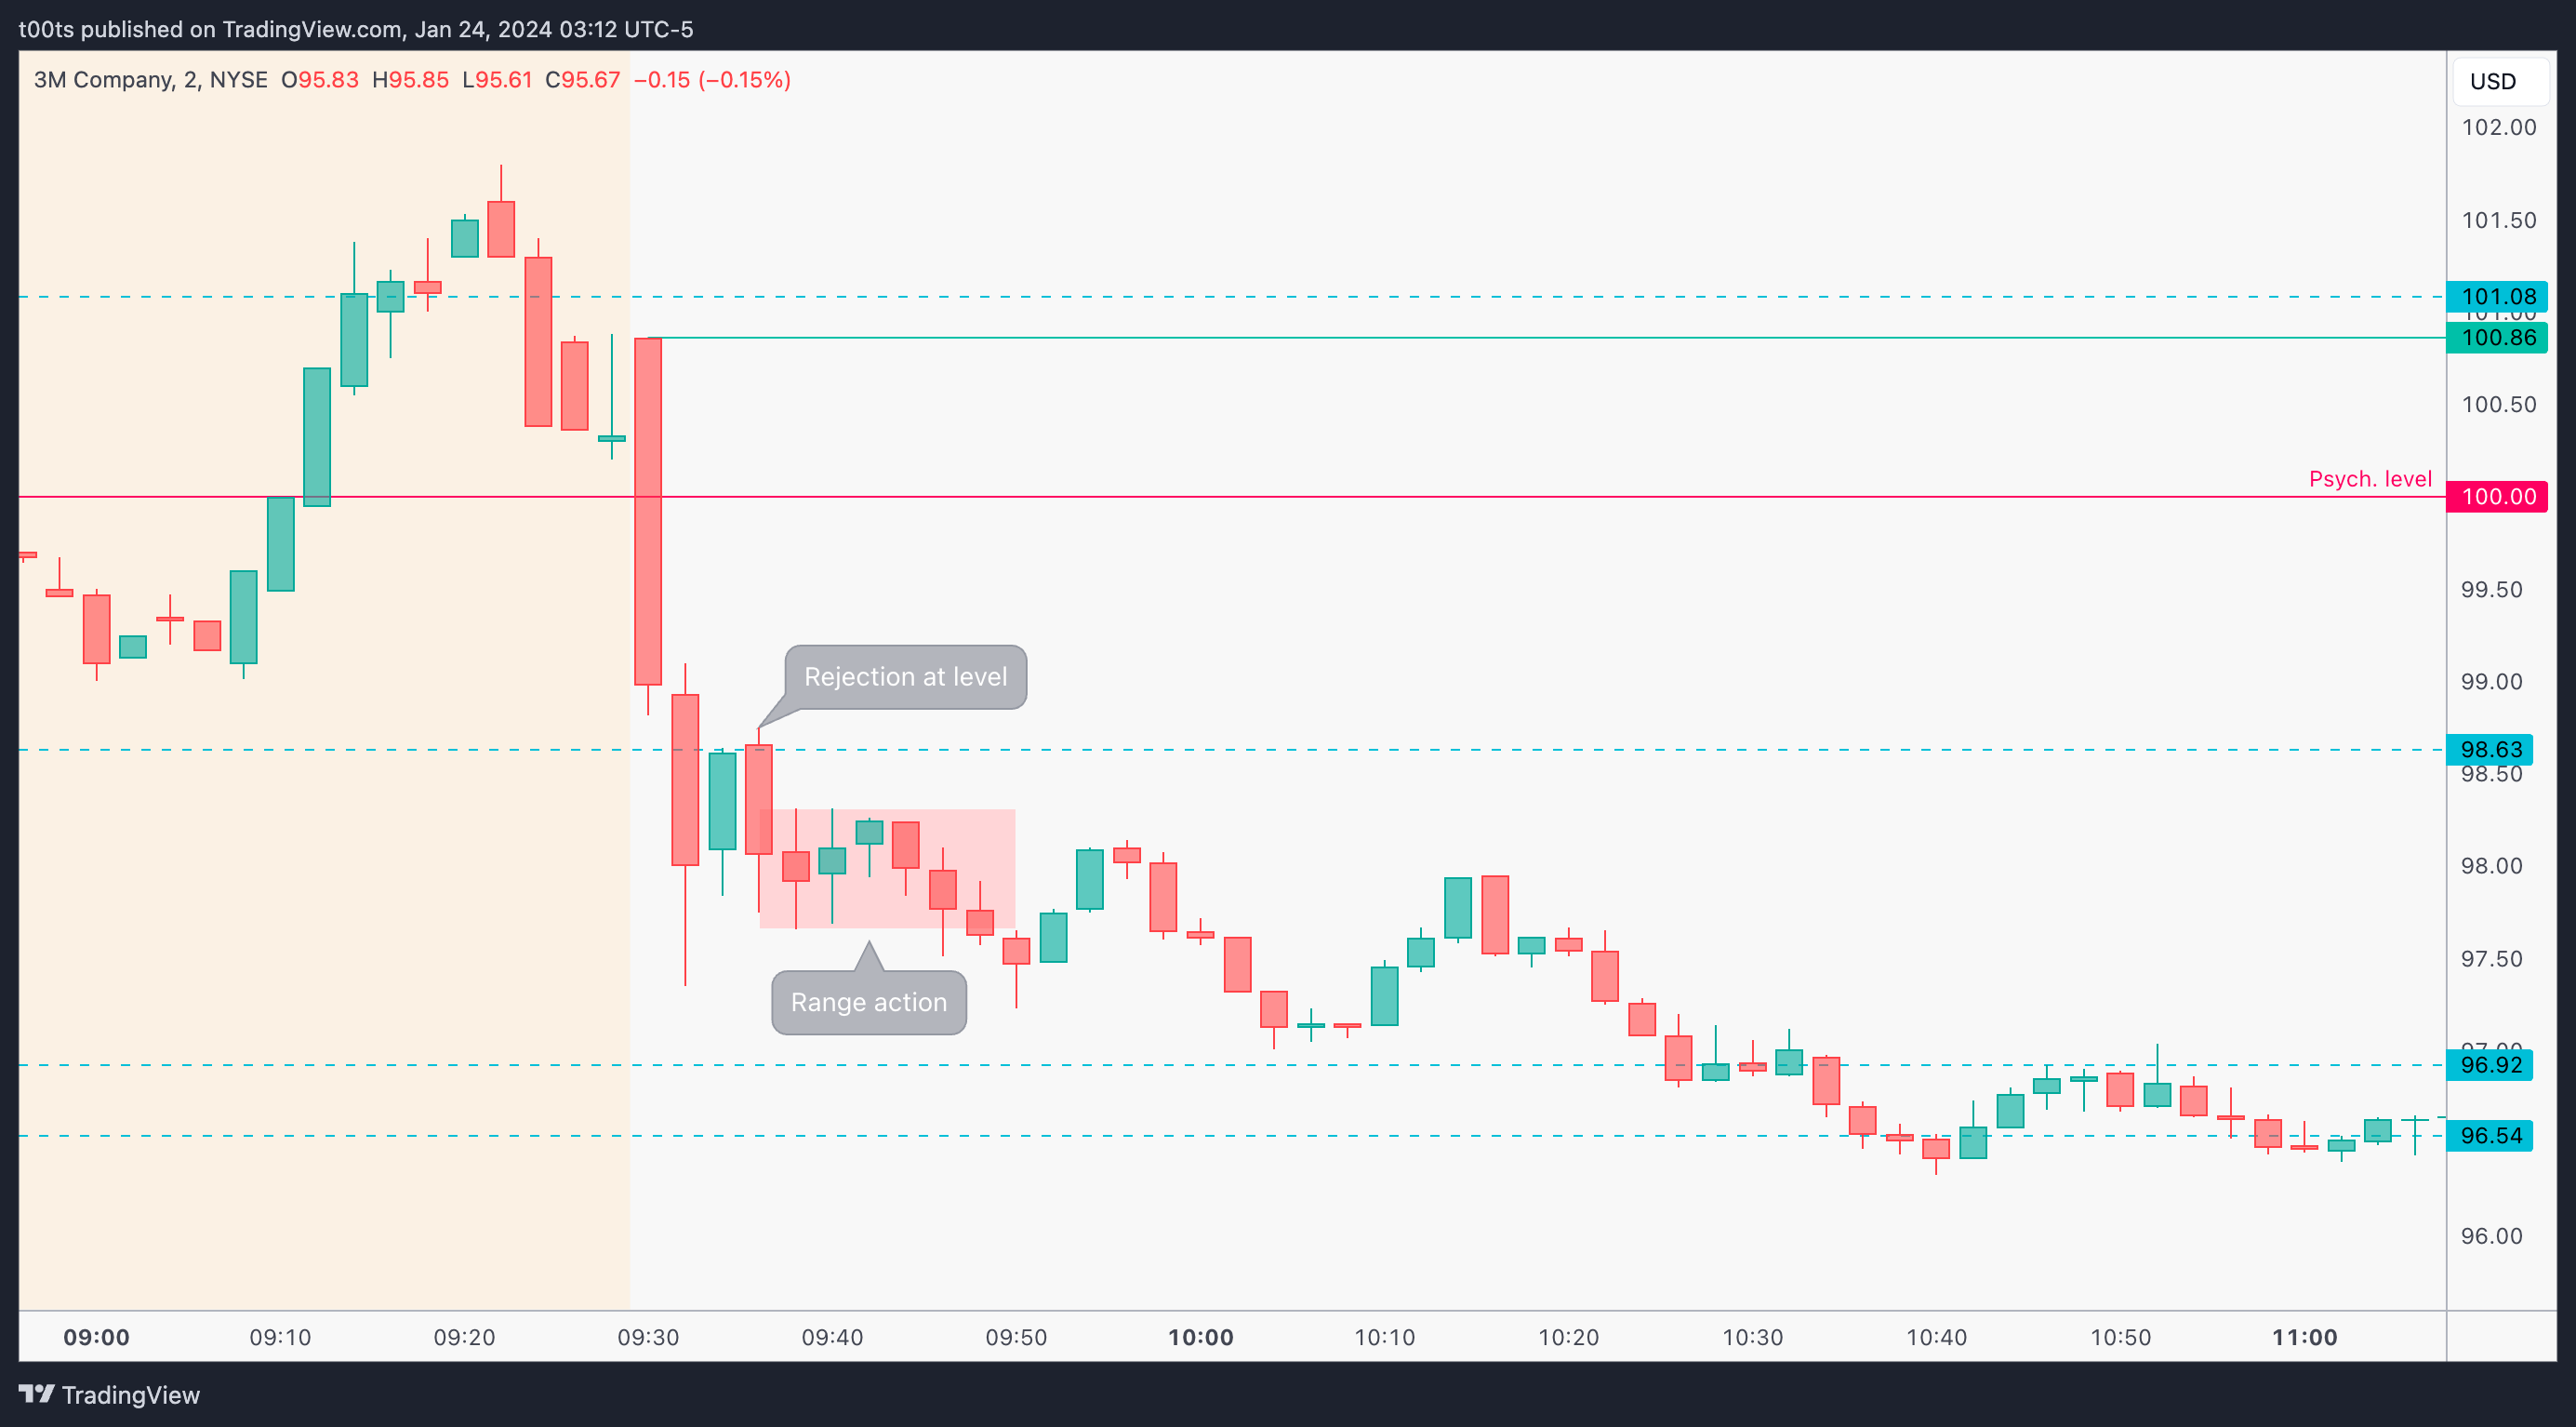
When we're looking to get involved near the opening bell, it's never a bad idea to zoom in. We obviously get more detail on what's going on and can be quicker in reacting to potential opportunities that set up, often offering better, earlier entries with tighter risk.
If we adhere to our strict systematic system, there's really not much we can do with this 2m chart either to be honest.
Of course it would be easy for me to come in and say: “Sort the $98.63 retest and hold”, but that's not really part of the system. So how does one attack something like this?
15s chart
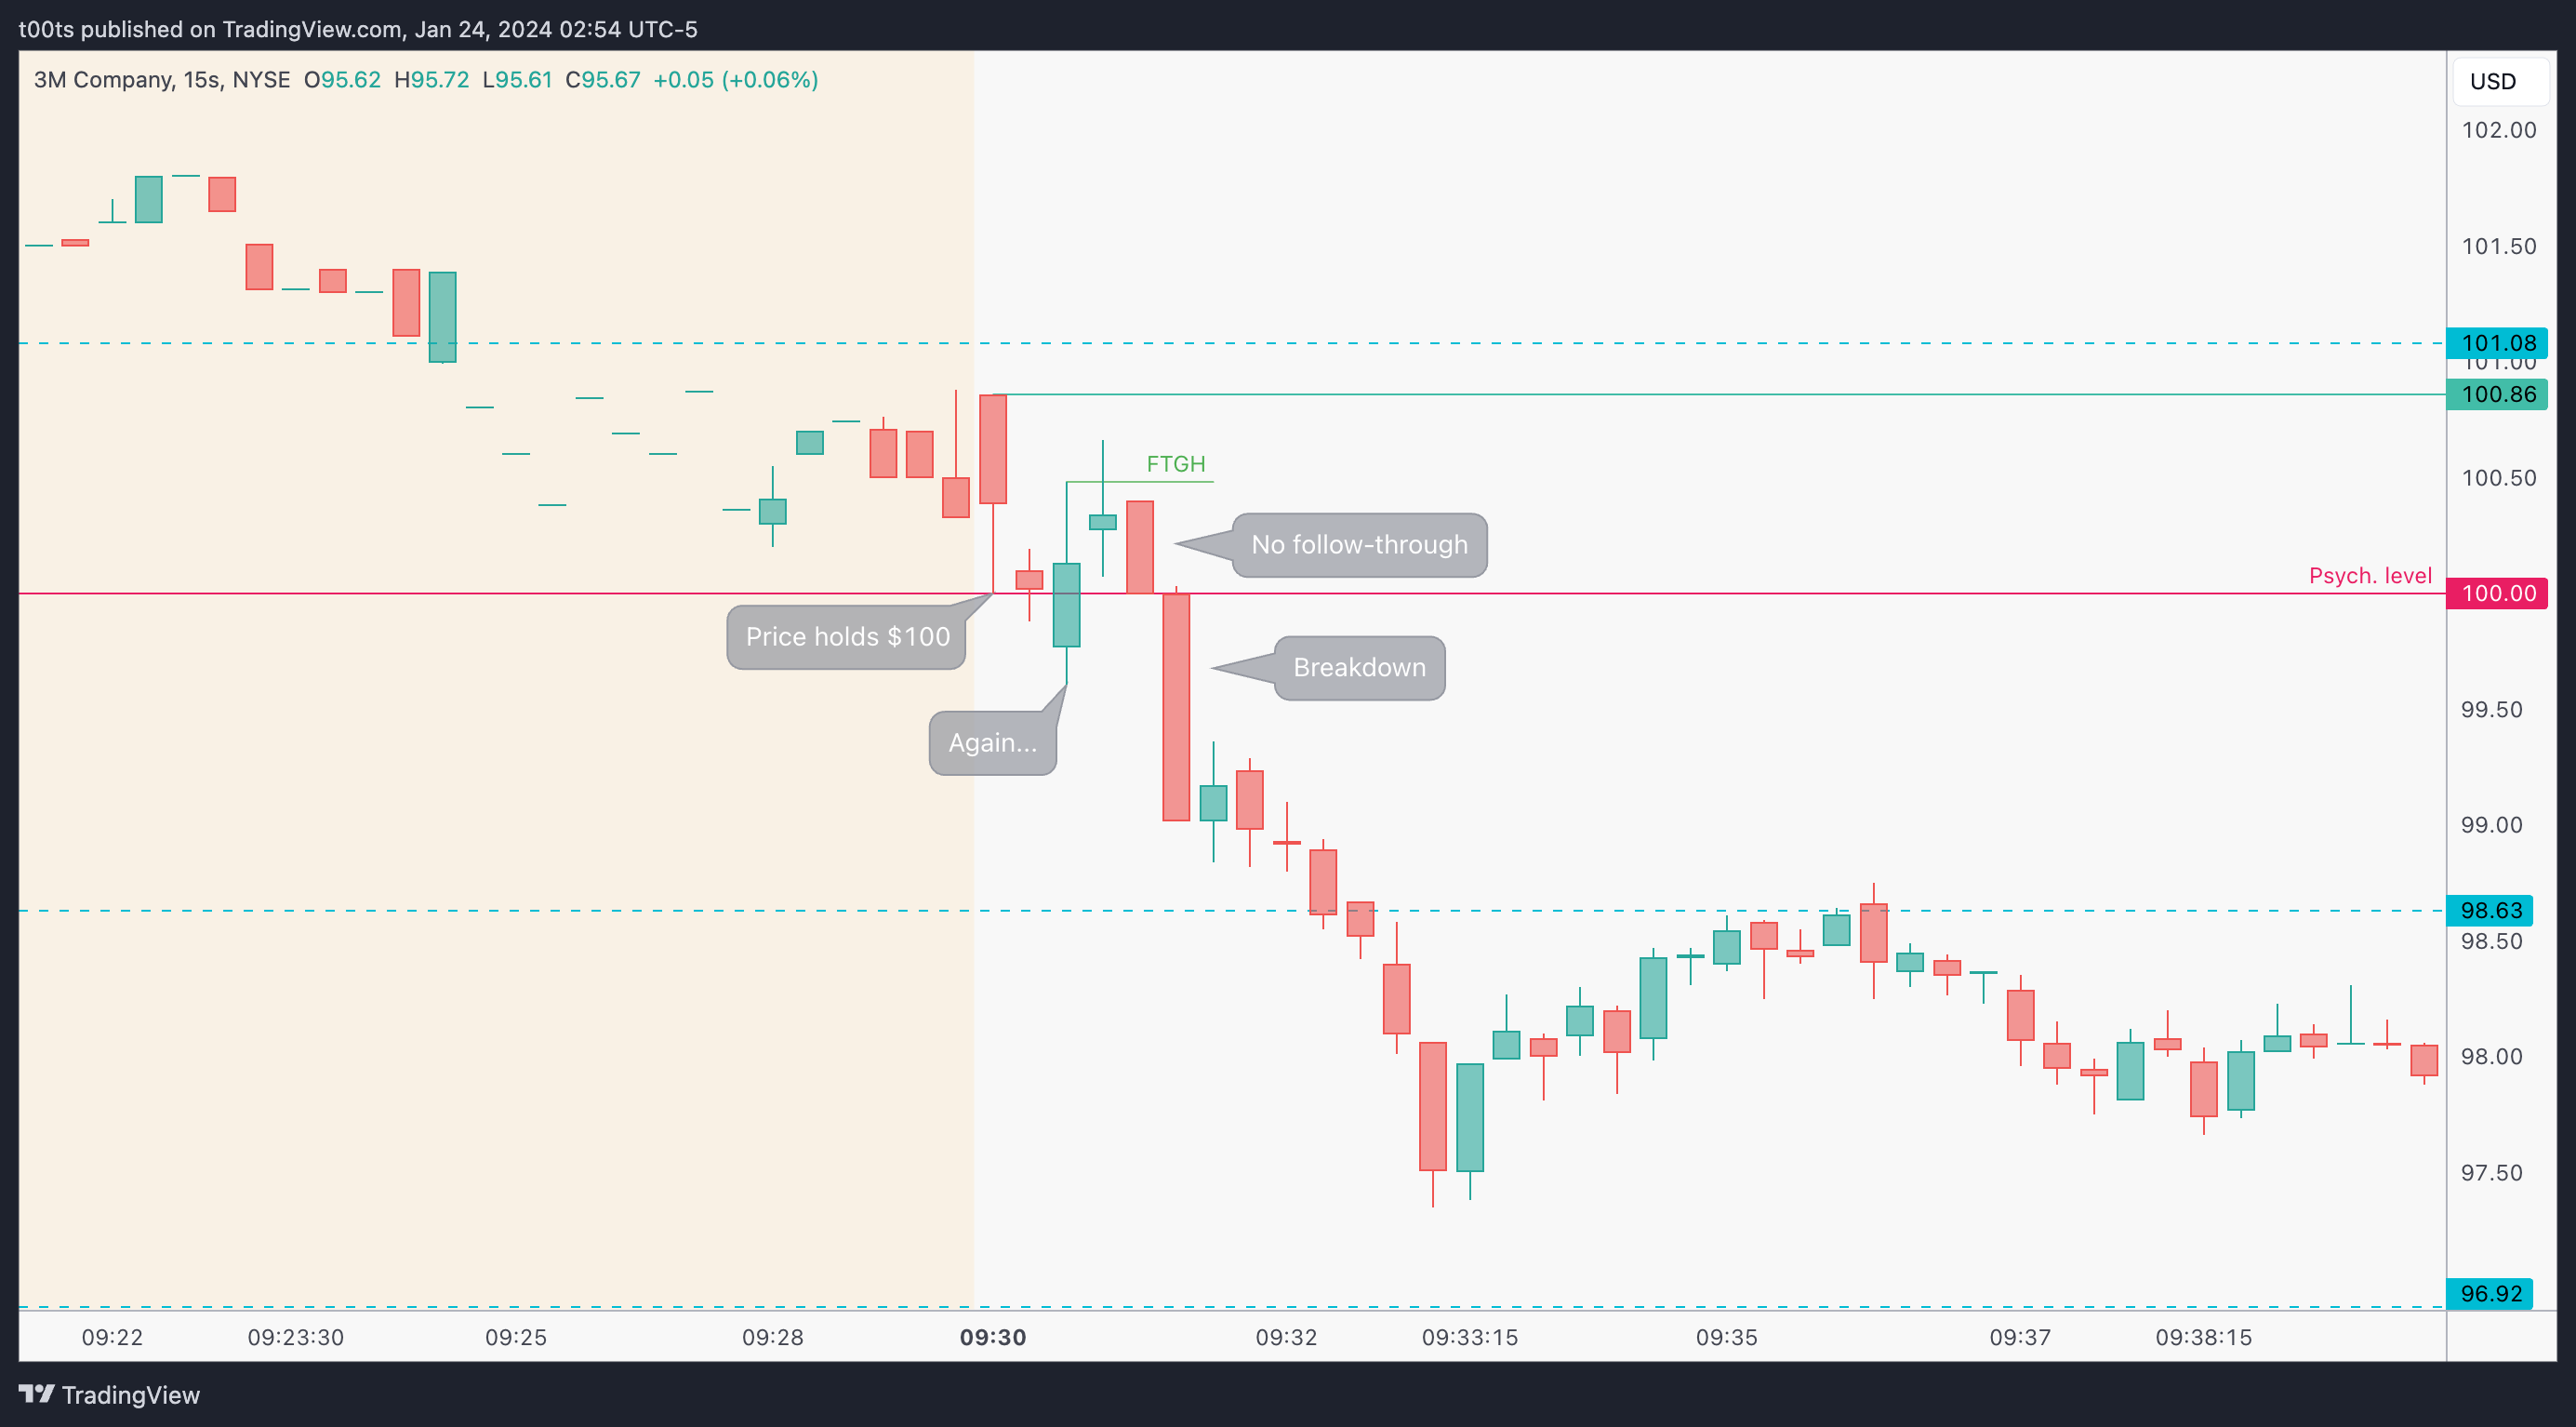
Disclaimer: Do NOT trade using second charts. I'm just using this to dissect what was happening in real-time. Please don't use them to trade unless it's part of a system with proven edge.
If you were actually onto this name and looking to get involved, there is a high chance that you could've caught pretty much the whole move. If we look at the open, price actually holds the $100 mark for a minute, but fails to reclaim the opening print and comes straight back down. If you were watching this in real time, that's plenty of time to take action. I come from a scalping background, and would consider this slow taking into account it's right after the bell.
The signal here is that buyers fail to follow-through on their hold of the $100 mark. There's just no reason to buy this name and many reasons to get rid of it.
Closing notes
Someone I hugely respect advised me to stay away from trading stocks the days before and after their earnings reports. While I strongly agree to sit out the day before, as it's usually choppy action and expensive premiums due to the high IV going into earnings; I've found the day after earnings to be filled with opportunities. As always, it's just a matter of being prepared, having your risk in check and not doing anything stupid. Market is not going anywhere, and every listed company has to report to the public every quarter.
If you trade stocks and are not excited about earnings season, I would suggest to go back and make an effort to gain some edge from these days. Not all stocks will offer great plays, but those that do will offset all the rest.
I am posting one trade writeup every day throughout 2024. I focus on large caps using levels and price action. The subscription is absolutely free and will always be. I will strive to provide value by offering clues and ideas for you to enhance your edge. Let’s grow together!