

Higher timeframe context
I must admit SMCI is one of those stocks I had never heard about until this day. Thousands of stocks trade on the US Stock Market. Stocks are listed and delisted almost every day. You can't “catch ‘em all”, but as we'll see, even if you had no clue about this company, if your preparation routine is thorough enough there was enough time to plan for this trade.
This is my hindsight review of a monster opportunity I wish I had been involved in.
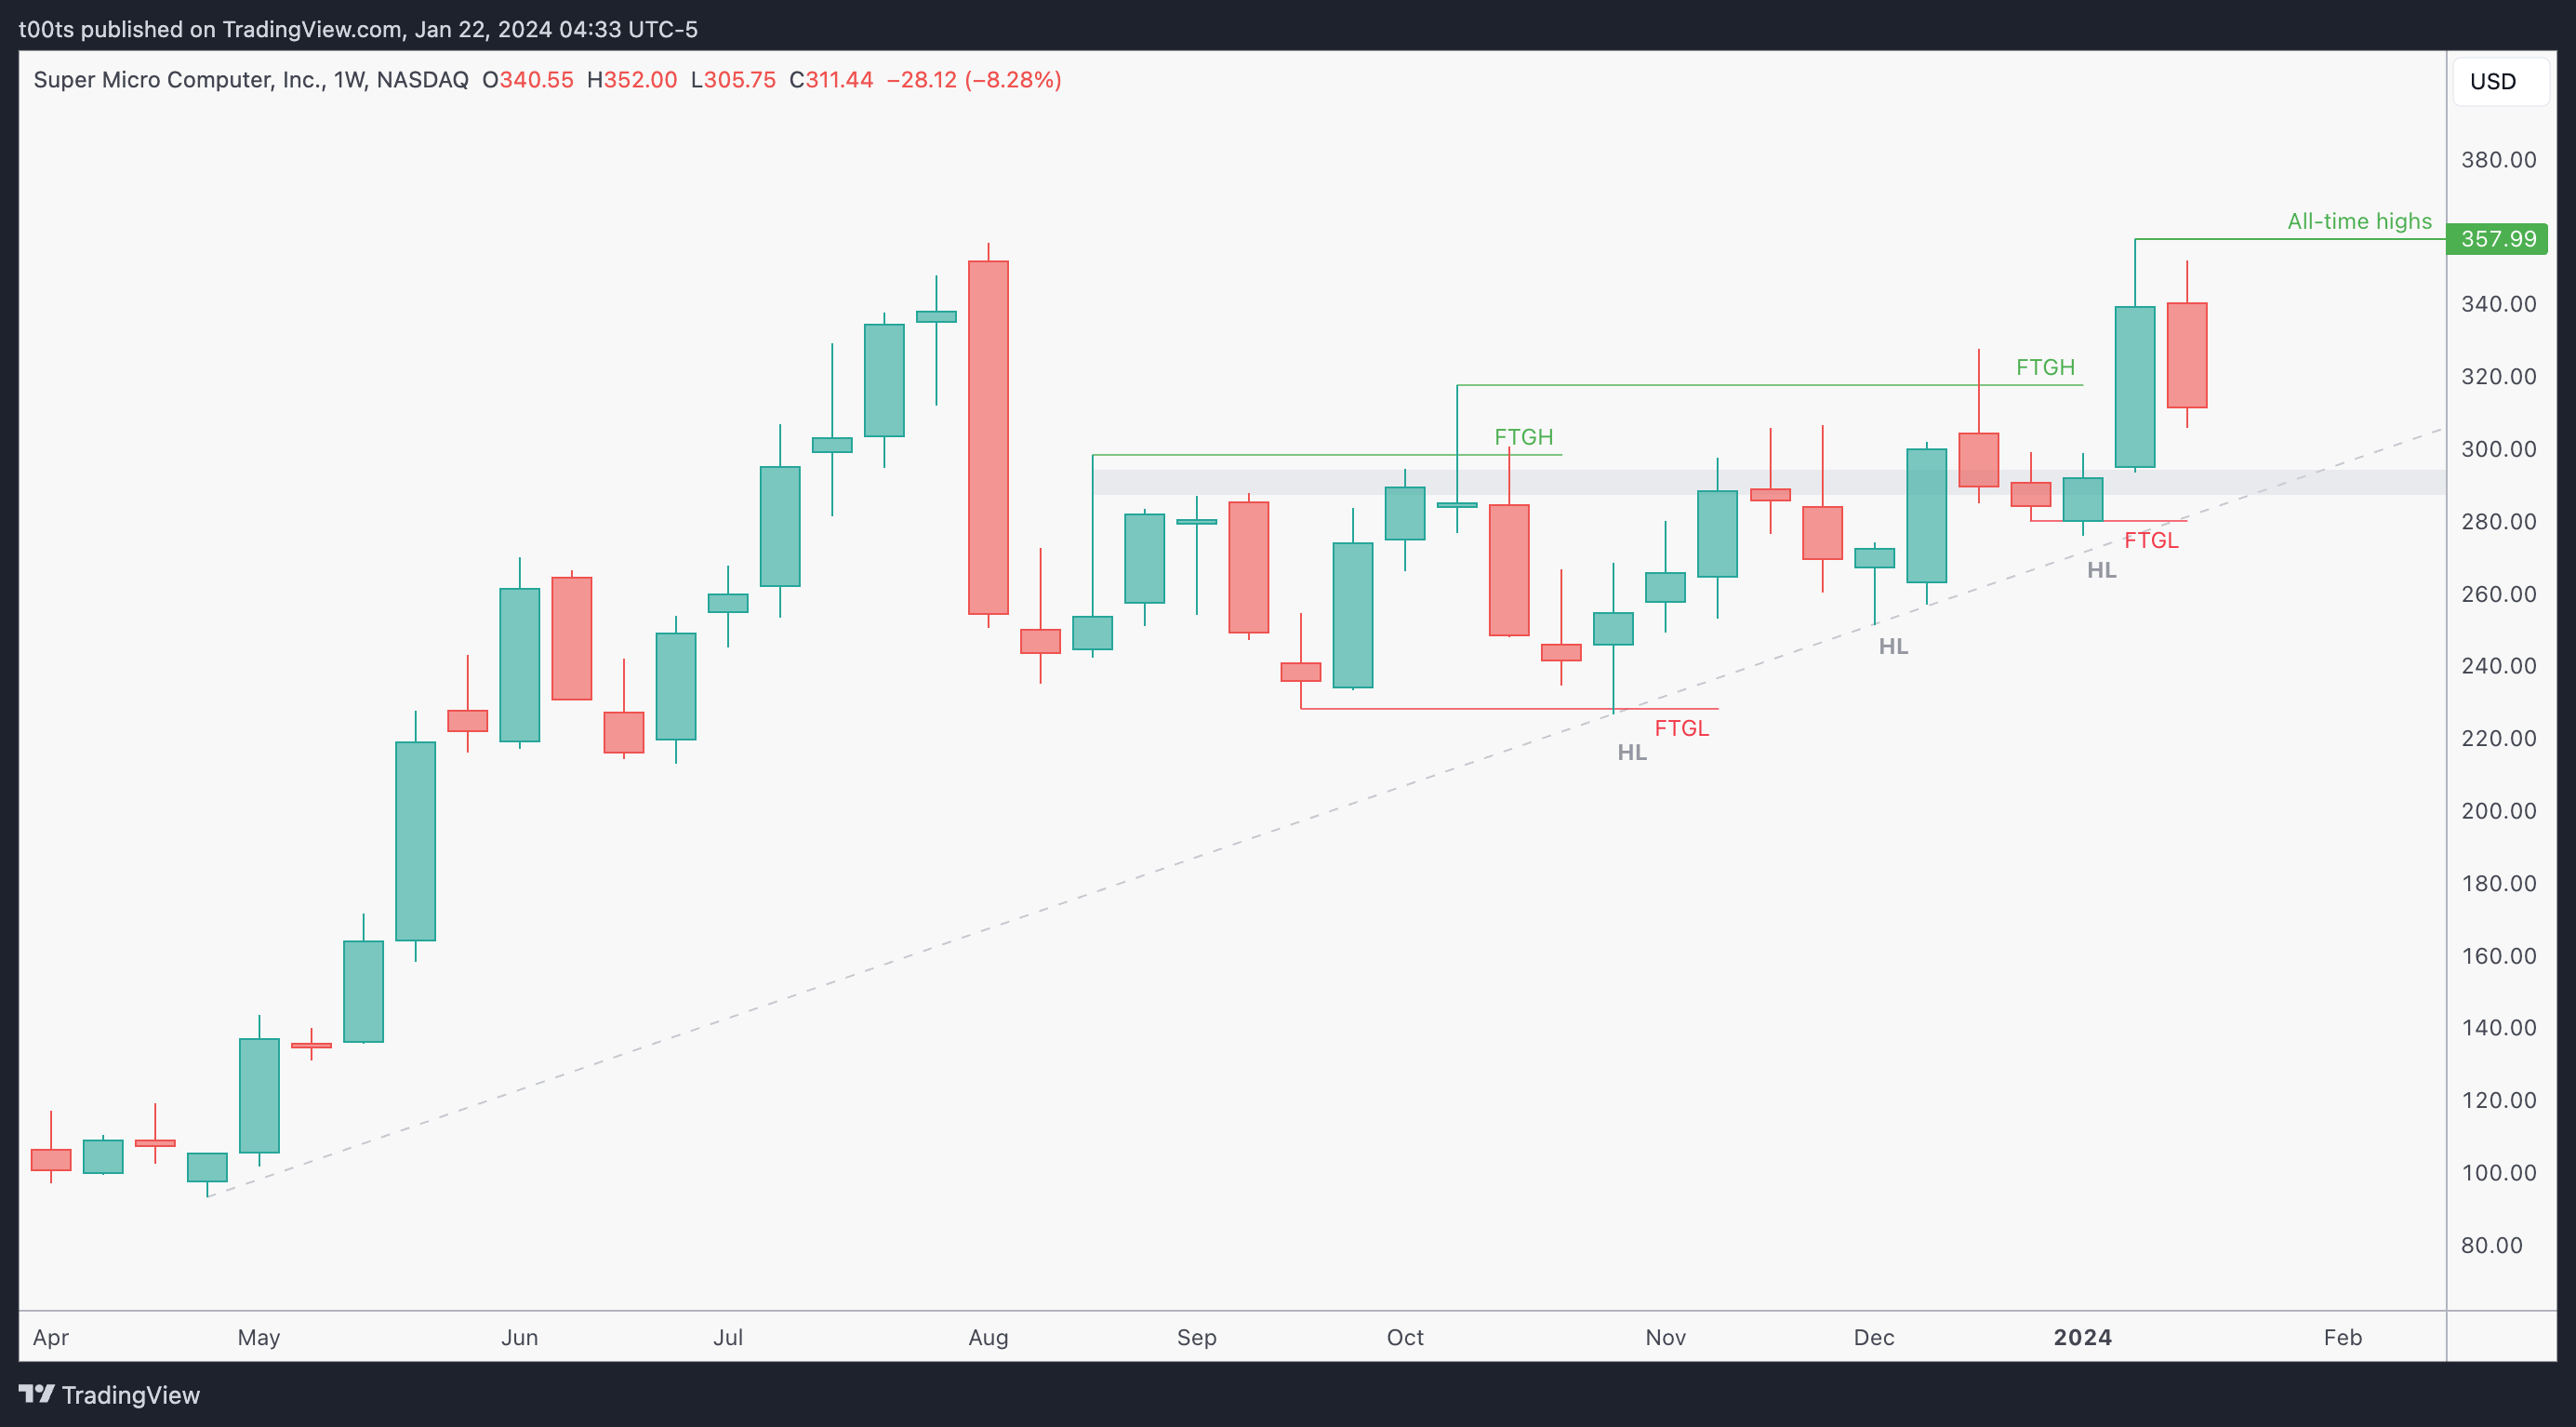
Weekly chart
After that -25% drop back in August, stock has been consolidating for a few months. It tried to move lower back in late October, but got picked up quickly and went back to the top of the range. It's essentially been bouncing around from top to bottom, however, on these past 3 months the stock has been putting in clear higher lows. Right before Christmas it tried to break out and failed. But still, buyers managed to hold that area of previous resistance and push back up, completing the previously failed breakout at the start of this year.
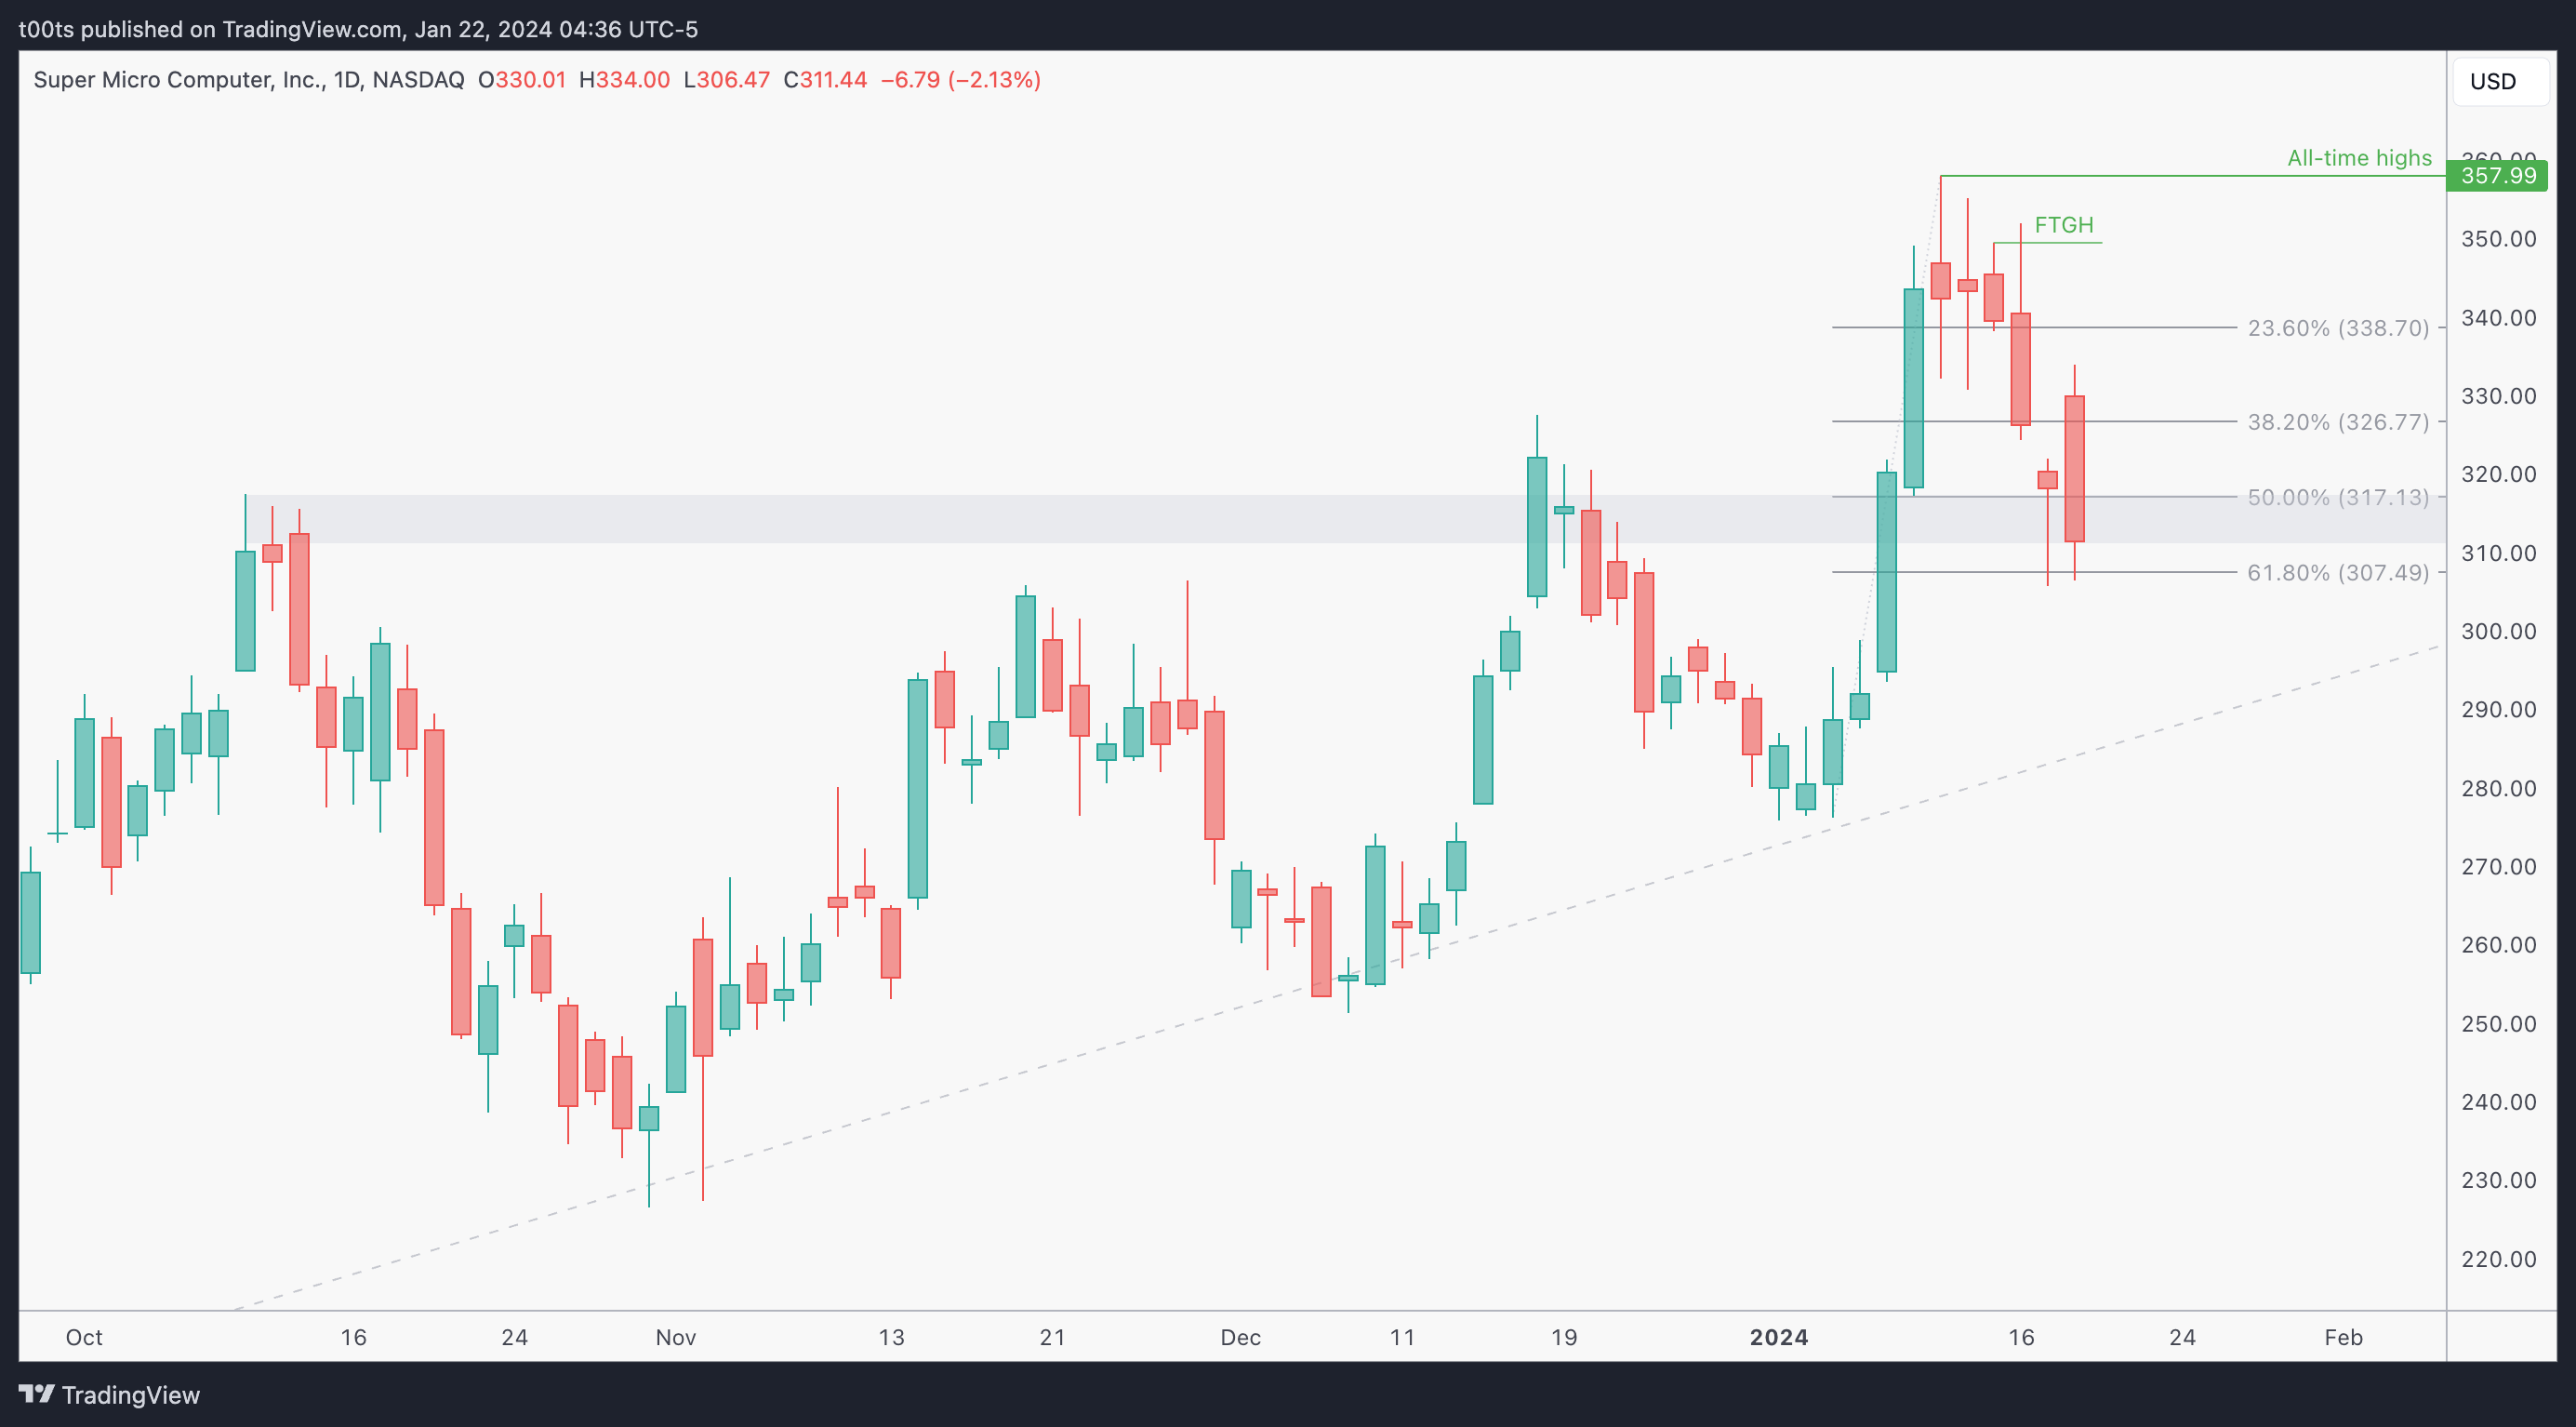
Daily chart
Structurally, price is in an overall uptrend, however that's quite a steep pullback on the daily chart after price tried to keep up with the momentum and failed. On this previous day price gapped up but ended putting in a bearish trend bar. While it never broke previous day lows, it's definitely not the action bulls want to see after they managed to close that daily hammer above the 50% FIB retracement level.
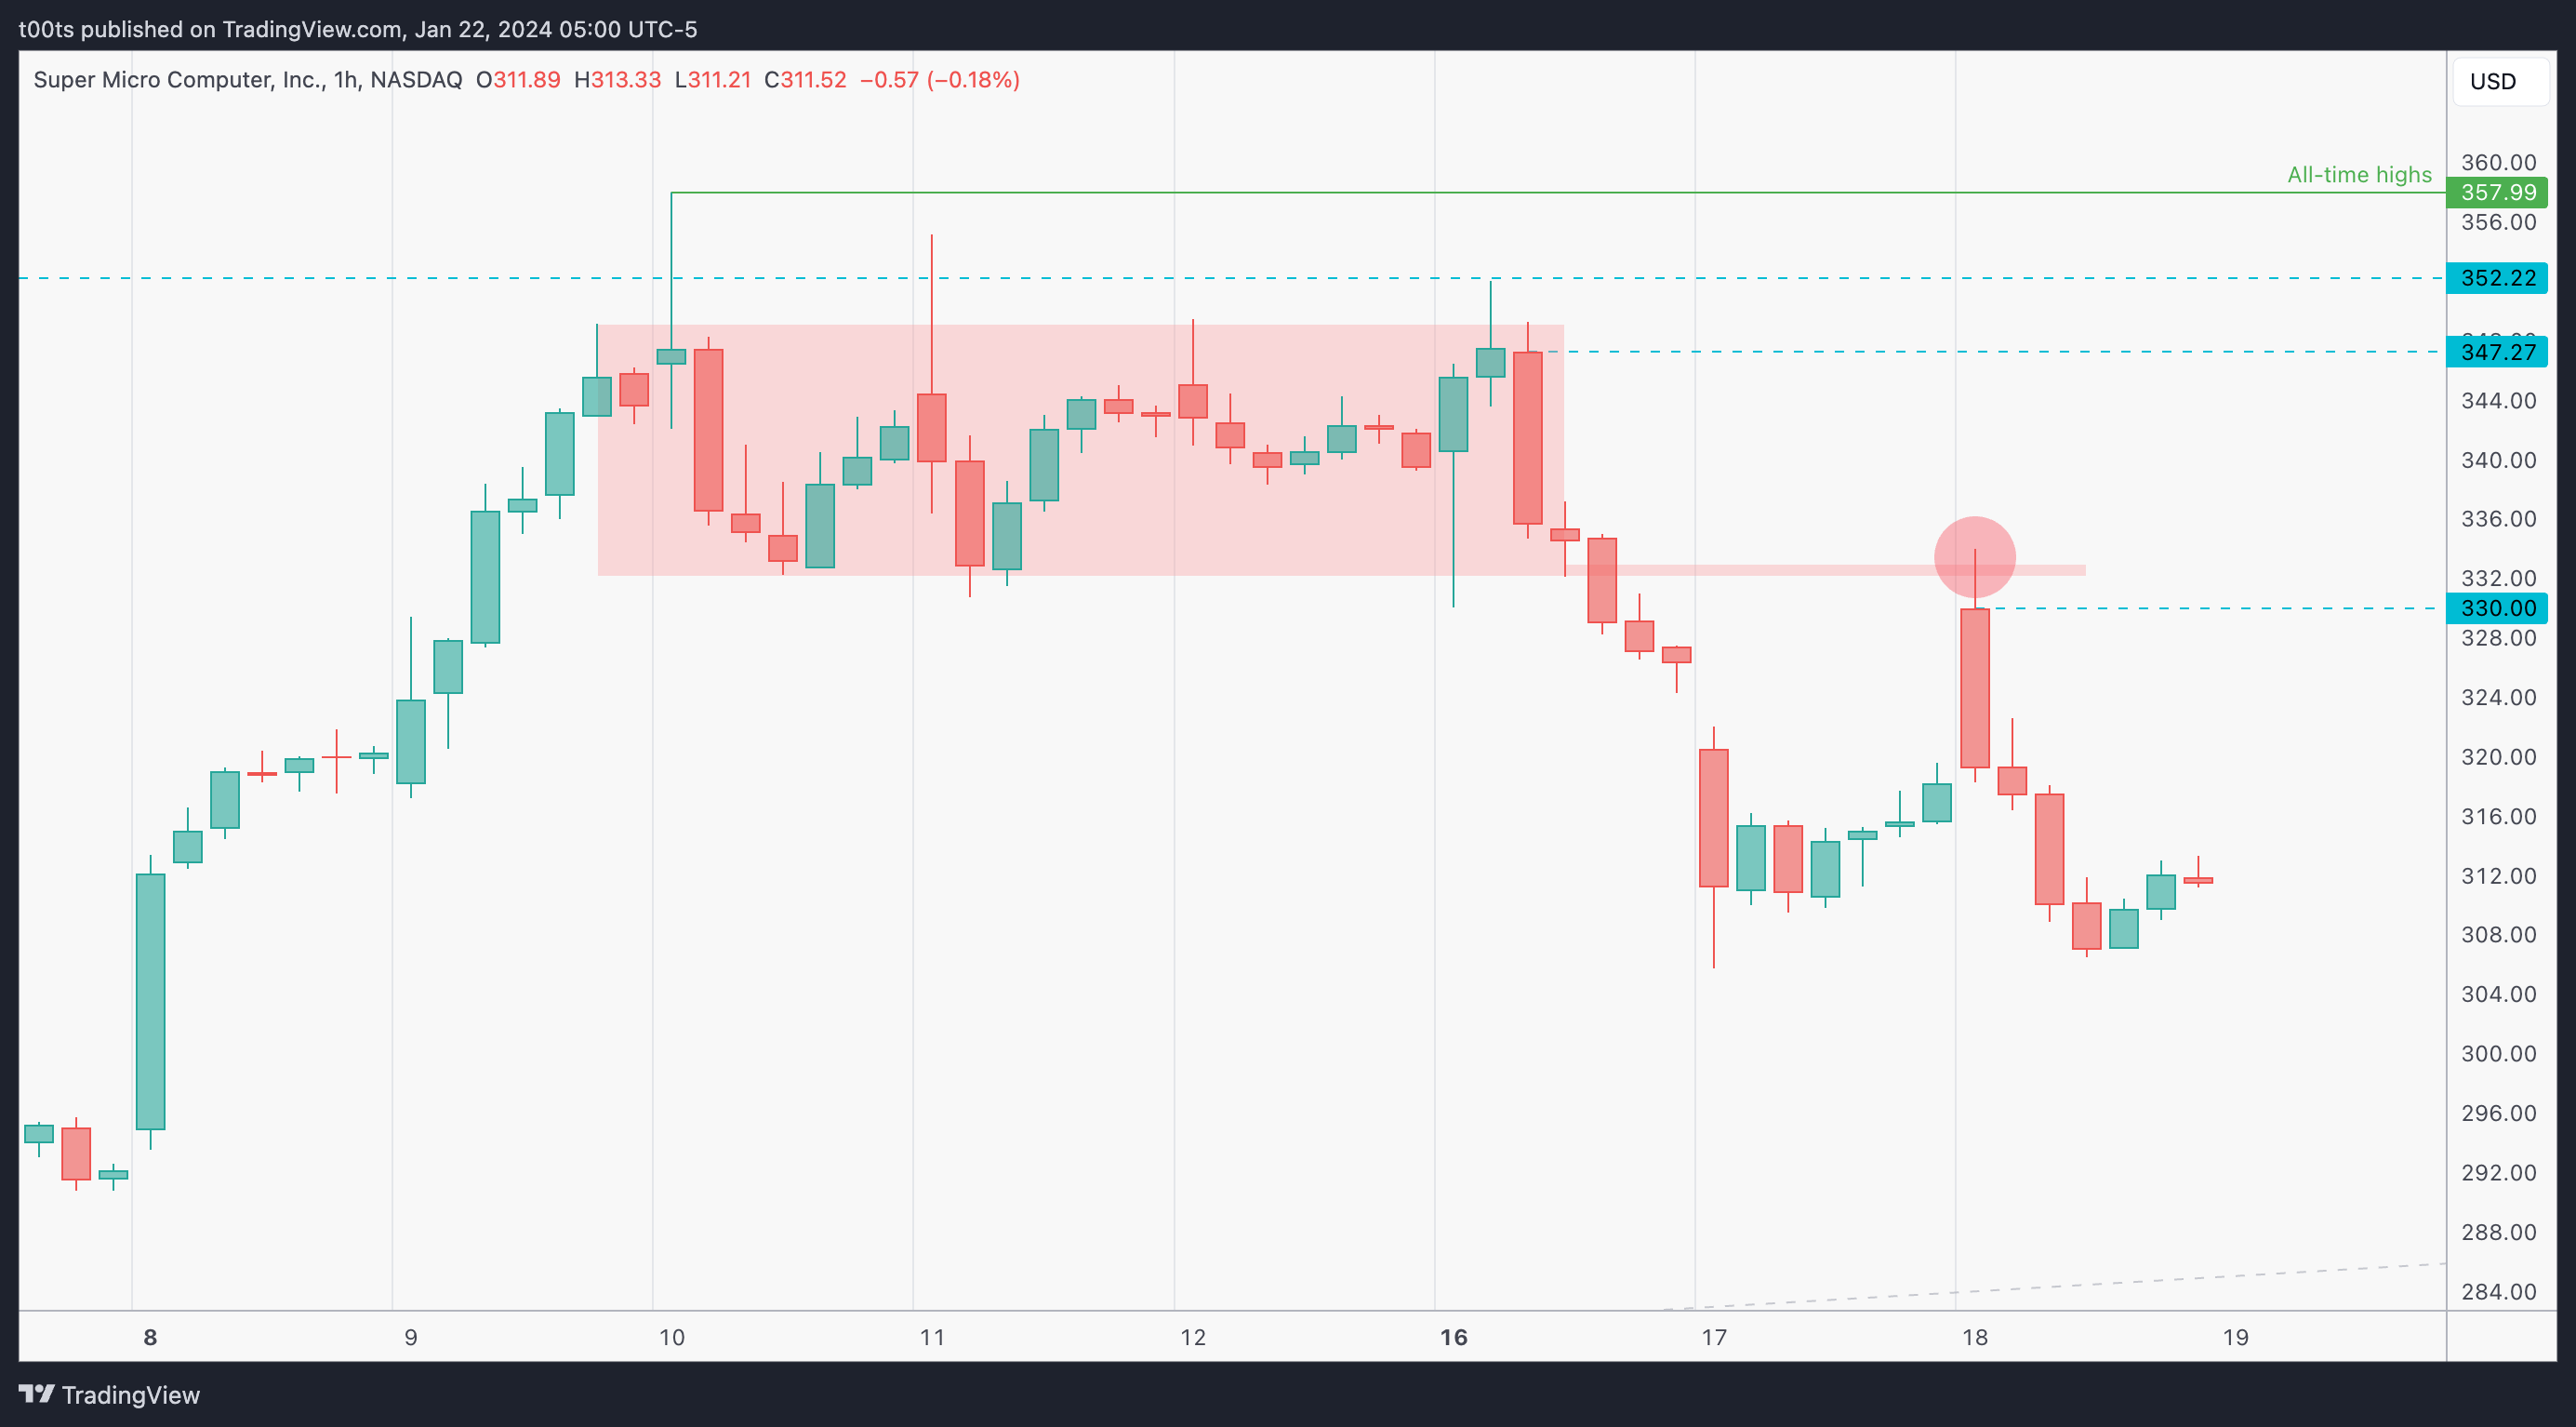
Hourly chart
Not much going on this hourly chart at the moment, although we get a bit more information on these past couple days.
First off, that daily hammer wasn't really that strong. Buyers saved the day towards the end, but it was pretty range bound after that initial gap down and further drop.
The following day, we get a sense of what caused that strong rejection after the gap up. Looks like that lower bound of the previous range is strong. We now have levels at the top ($247.27) and bottom ($330) of the range, as well as the $352.22 from the last weekly top before that large pullback we mentioned earlier.
Pre-market action
This is obviously what brought attention to the stock this day. Stock is set to gap up 11.43% higher than its previous day's close. That's a large gap for a $300 stock. This gap was due to the company hiking its Q2 forecast, rising both expected EPS and net sales by ~20% and ~30% respectively. That's huge, and explains the big gap. For context, they attributed this rise in forecast to a “strong demand for their rack-scale servers, AI and Total IT solutions”.
What's interesting here is that most of the move happened in the after-hours, which makes me feel absolutely stupid for not having this name on watch the following day. This was obviously popping up all over the news and in every possible mainstream scanner you could check during the pre-market. There was no excuse to missing this.
Frankly, this is not part of my routine. I usually go over my watchlist and check if there's anything I'm interested in. It was OPEX day so expectations were low, and while I'm still very happy with my PayPal trade, this was a tough miss.
The trade
Something very special happens when price gaps above a red day, or below a green day. Especially if these previous days are strong buying or selling days.
In this case, price is indeed set to gap above a bearish trend day, leaving many sellers trapped, at a loss. Go back and look for these days on your charts. There's a high chance of a trend day when this happens.
I learned this (and many other things) from RakeTrades. He’s a great trader and educator in my opinion.
Using our CPT Framework:
Cue(s)
Strong catalyst: Forecast rise numbers are extraordinary.
Stock belongs to the market-leading sector
Monster gap up over a red daily trend bar
Media had plenty of time to cover this, many eyes watching
Shorts in pain
Plan
We are expecting a trend day to the upside, so the idea is always to get involved as soon as possible, using the opening print as filter.
Price is set to open right at the $347.27 level, so we can definitely use that to establish our risk and if price does push and break the $350 psychological level and the $352.22 level from the past top, we can trail our stop and even consider adding to our position.
Again, we want to really keep in mind that +95% of shorts are at a loss right now, as price is set to open at the top of the hourly range we saw earlier and very close to all-time highs, so that's a big cue when approaching this trade.
Trigger(s)
Dip below the $347.27 level and back above the opening print
Price breaking the $350 psych. level
Price breaking the $352.22 level
Price breaking all-time highs
2m chart
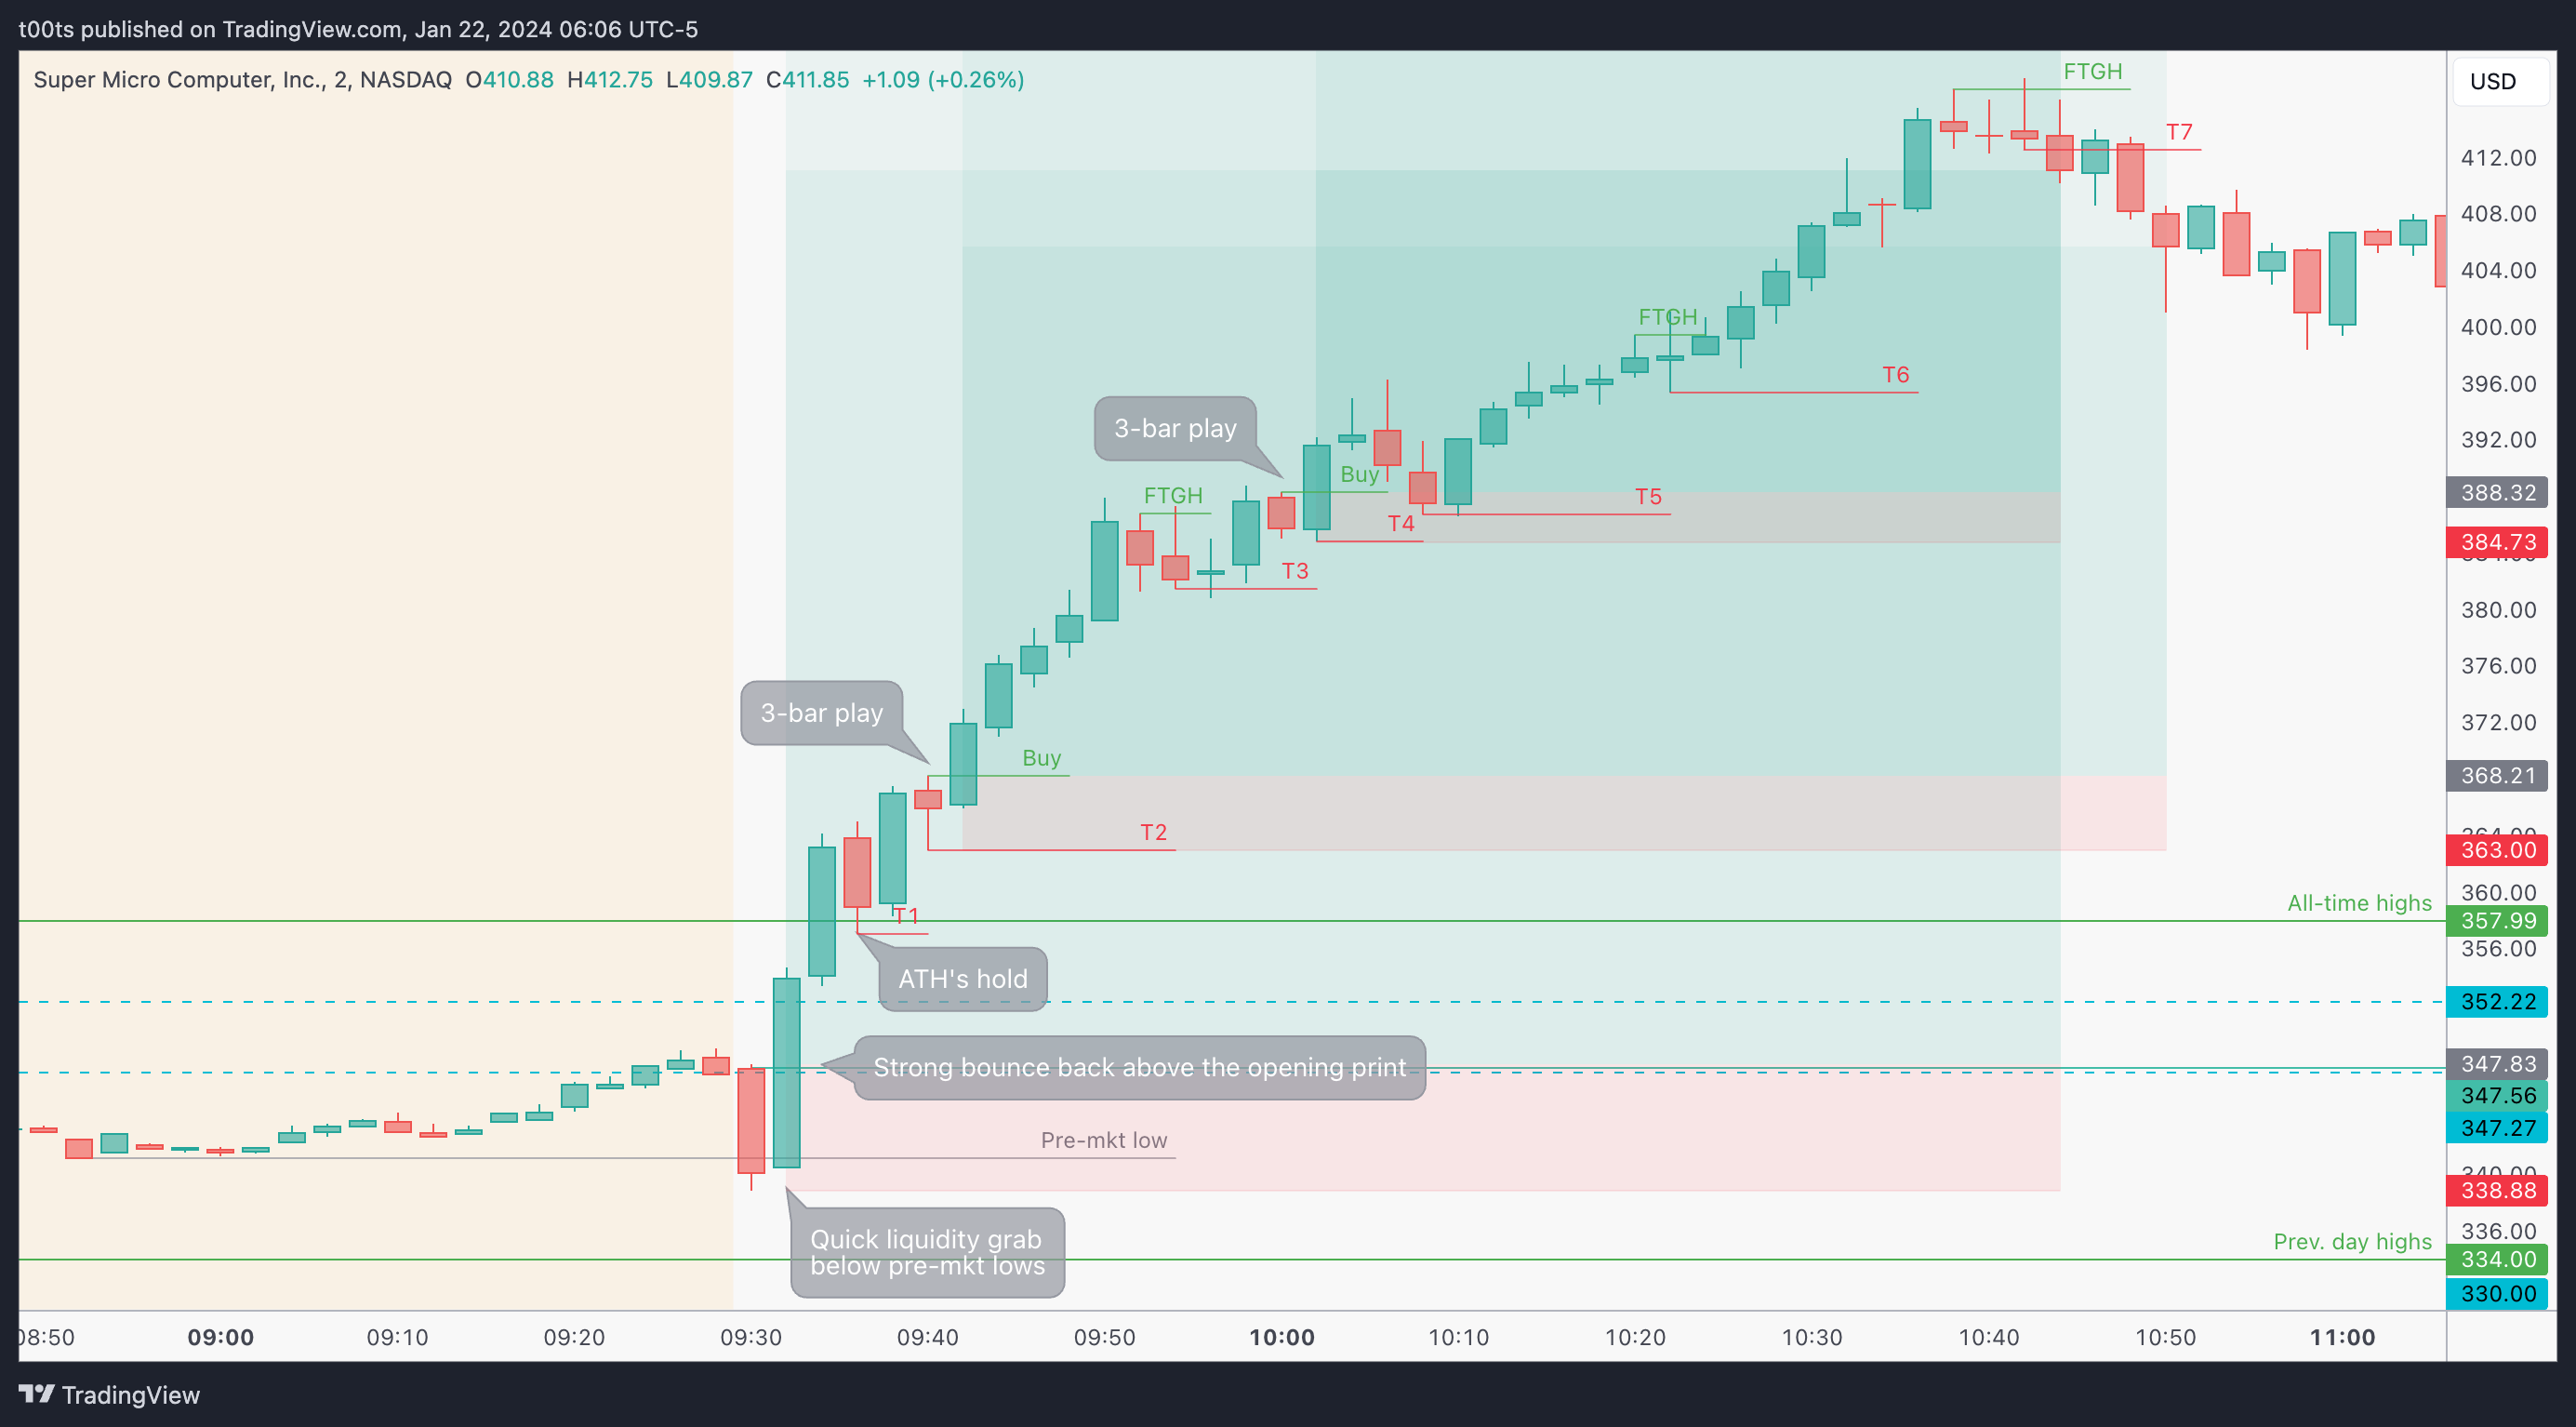
We'll be going over the 2m chart because the 5m is arguably kind of pointless given the strong push we got pretty much straight off the open.
I obviously missed this trade so this is all hindsight analysis, but I'd rather put in the work than just hope to magically catch the next one and know what to do when a stock is pushing this hard.
As per usual, we take things bar by bar. We let every bar tell its story and use the overall context to gauge risk, take entries, and eventually exit.
I've put everything I liked on the chart itself, but as a quick text rundown:
Price dips below the pre-market lows, grabbing liquidity and pushing back up above the opening print fairly quickly, giving us our first entry, risking off the lows of the day.
Price breaks all-time highs and offers a quick pullback that many traders bought. We can now move our stop to the lows of this pullback bar.
Even if you didn't buy the retest, price sets a convenient 3-bar play right after that you can comfortably trade off of and ratchet the overall position stop.
Price rallies and consolidates above the $380s. We get our first failure to go higher and again, we move our stop to the lows of that bar, which technically triggers but unless you have an algo executing for you it's likely you wouldn't have stopped yourself out.
Another 3-bar play sets up, giving again another opportunity to add and ratchet the stop even further.
There's a failure right after that entry and I'd probably would've taken some off due to the over extension and the potential 3-bar play failure, but if you look at the 5m chart at that point, our T4 aligns with the low of the previous 5m bar, so given the momentum you might want to hold your core position until that T4 breaks. (Again, this is all hindsight, goal is to learn)
Price soon enough catches a bid and buyers take it to the $400 psych level, where we get our next failure and can again ratchet our stop, which never hits.
Price keeps climbing higher and fins resistance around the $415s. It's fair to say that you could've trimmed or exited fully anywhere in this area and be content with the trade.
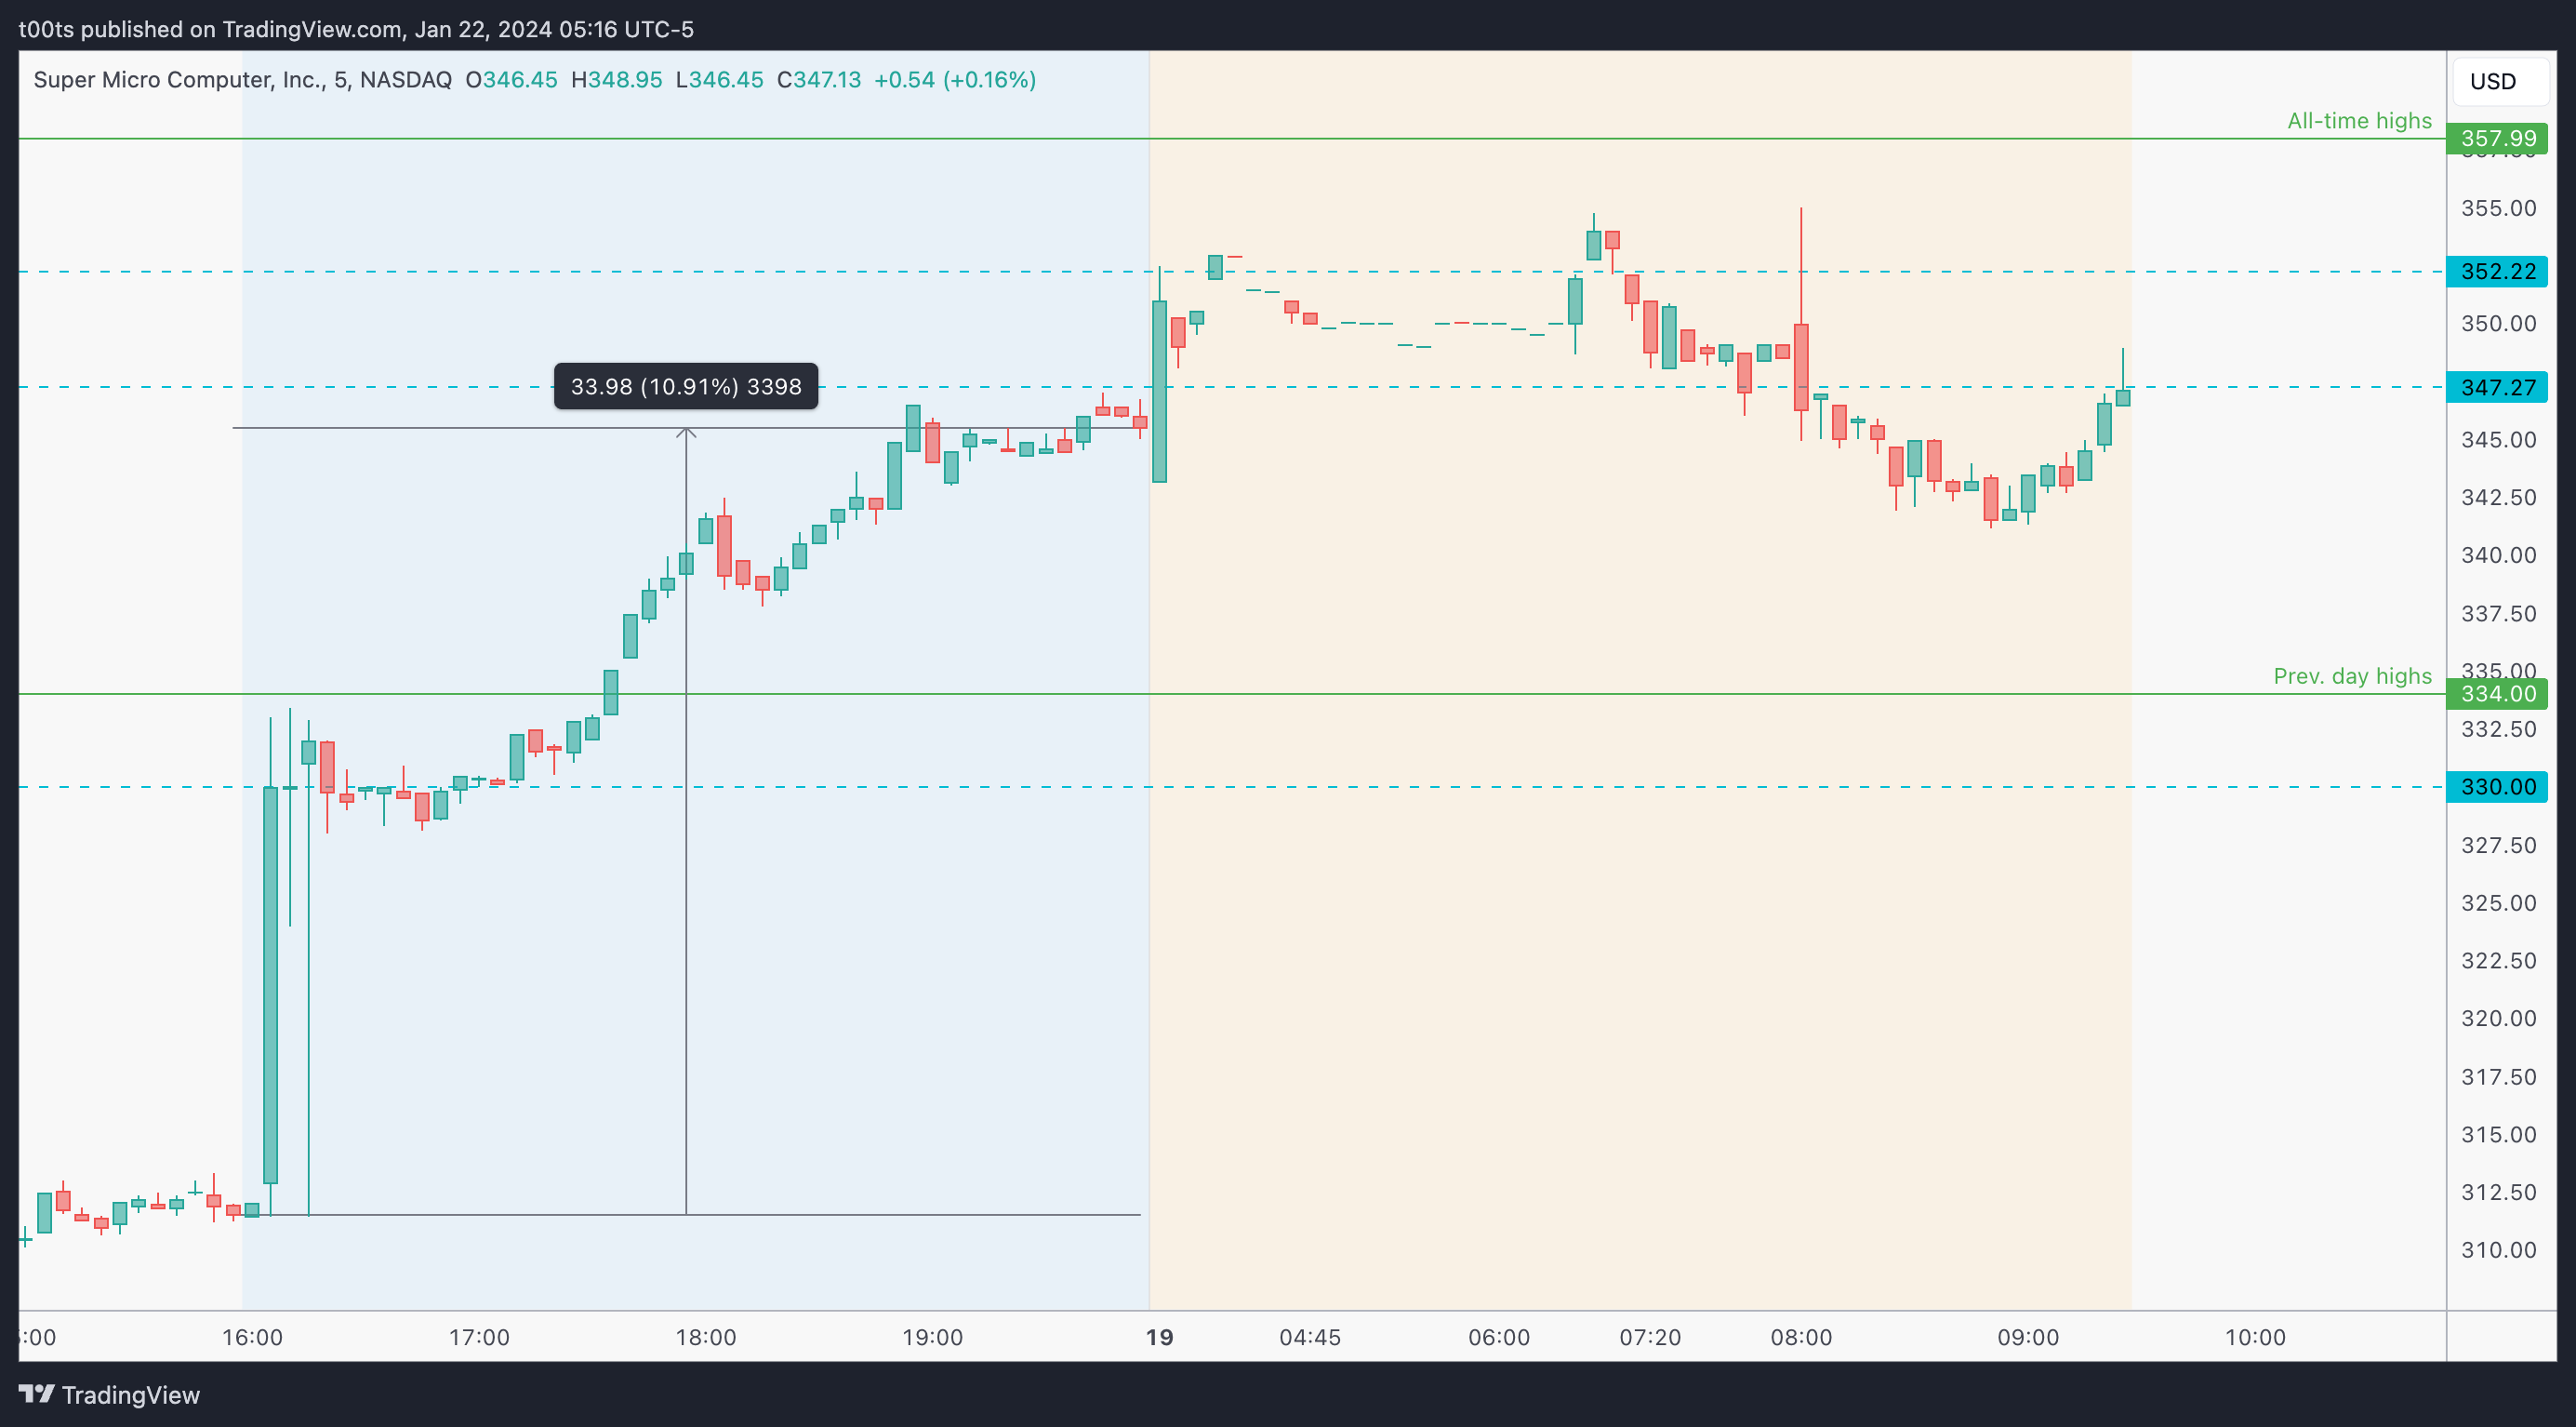
5m chart
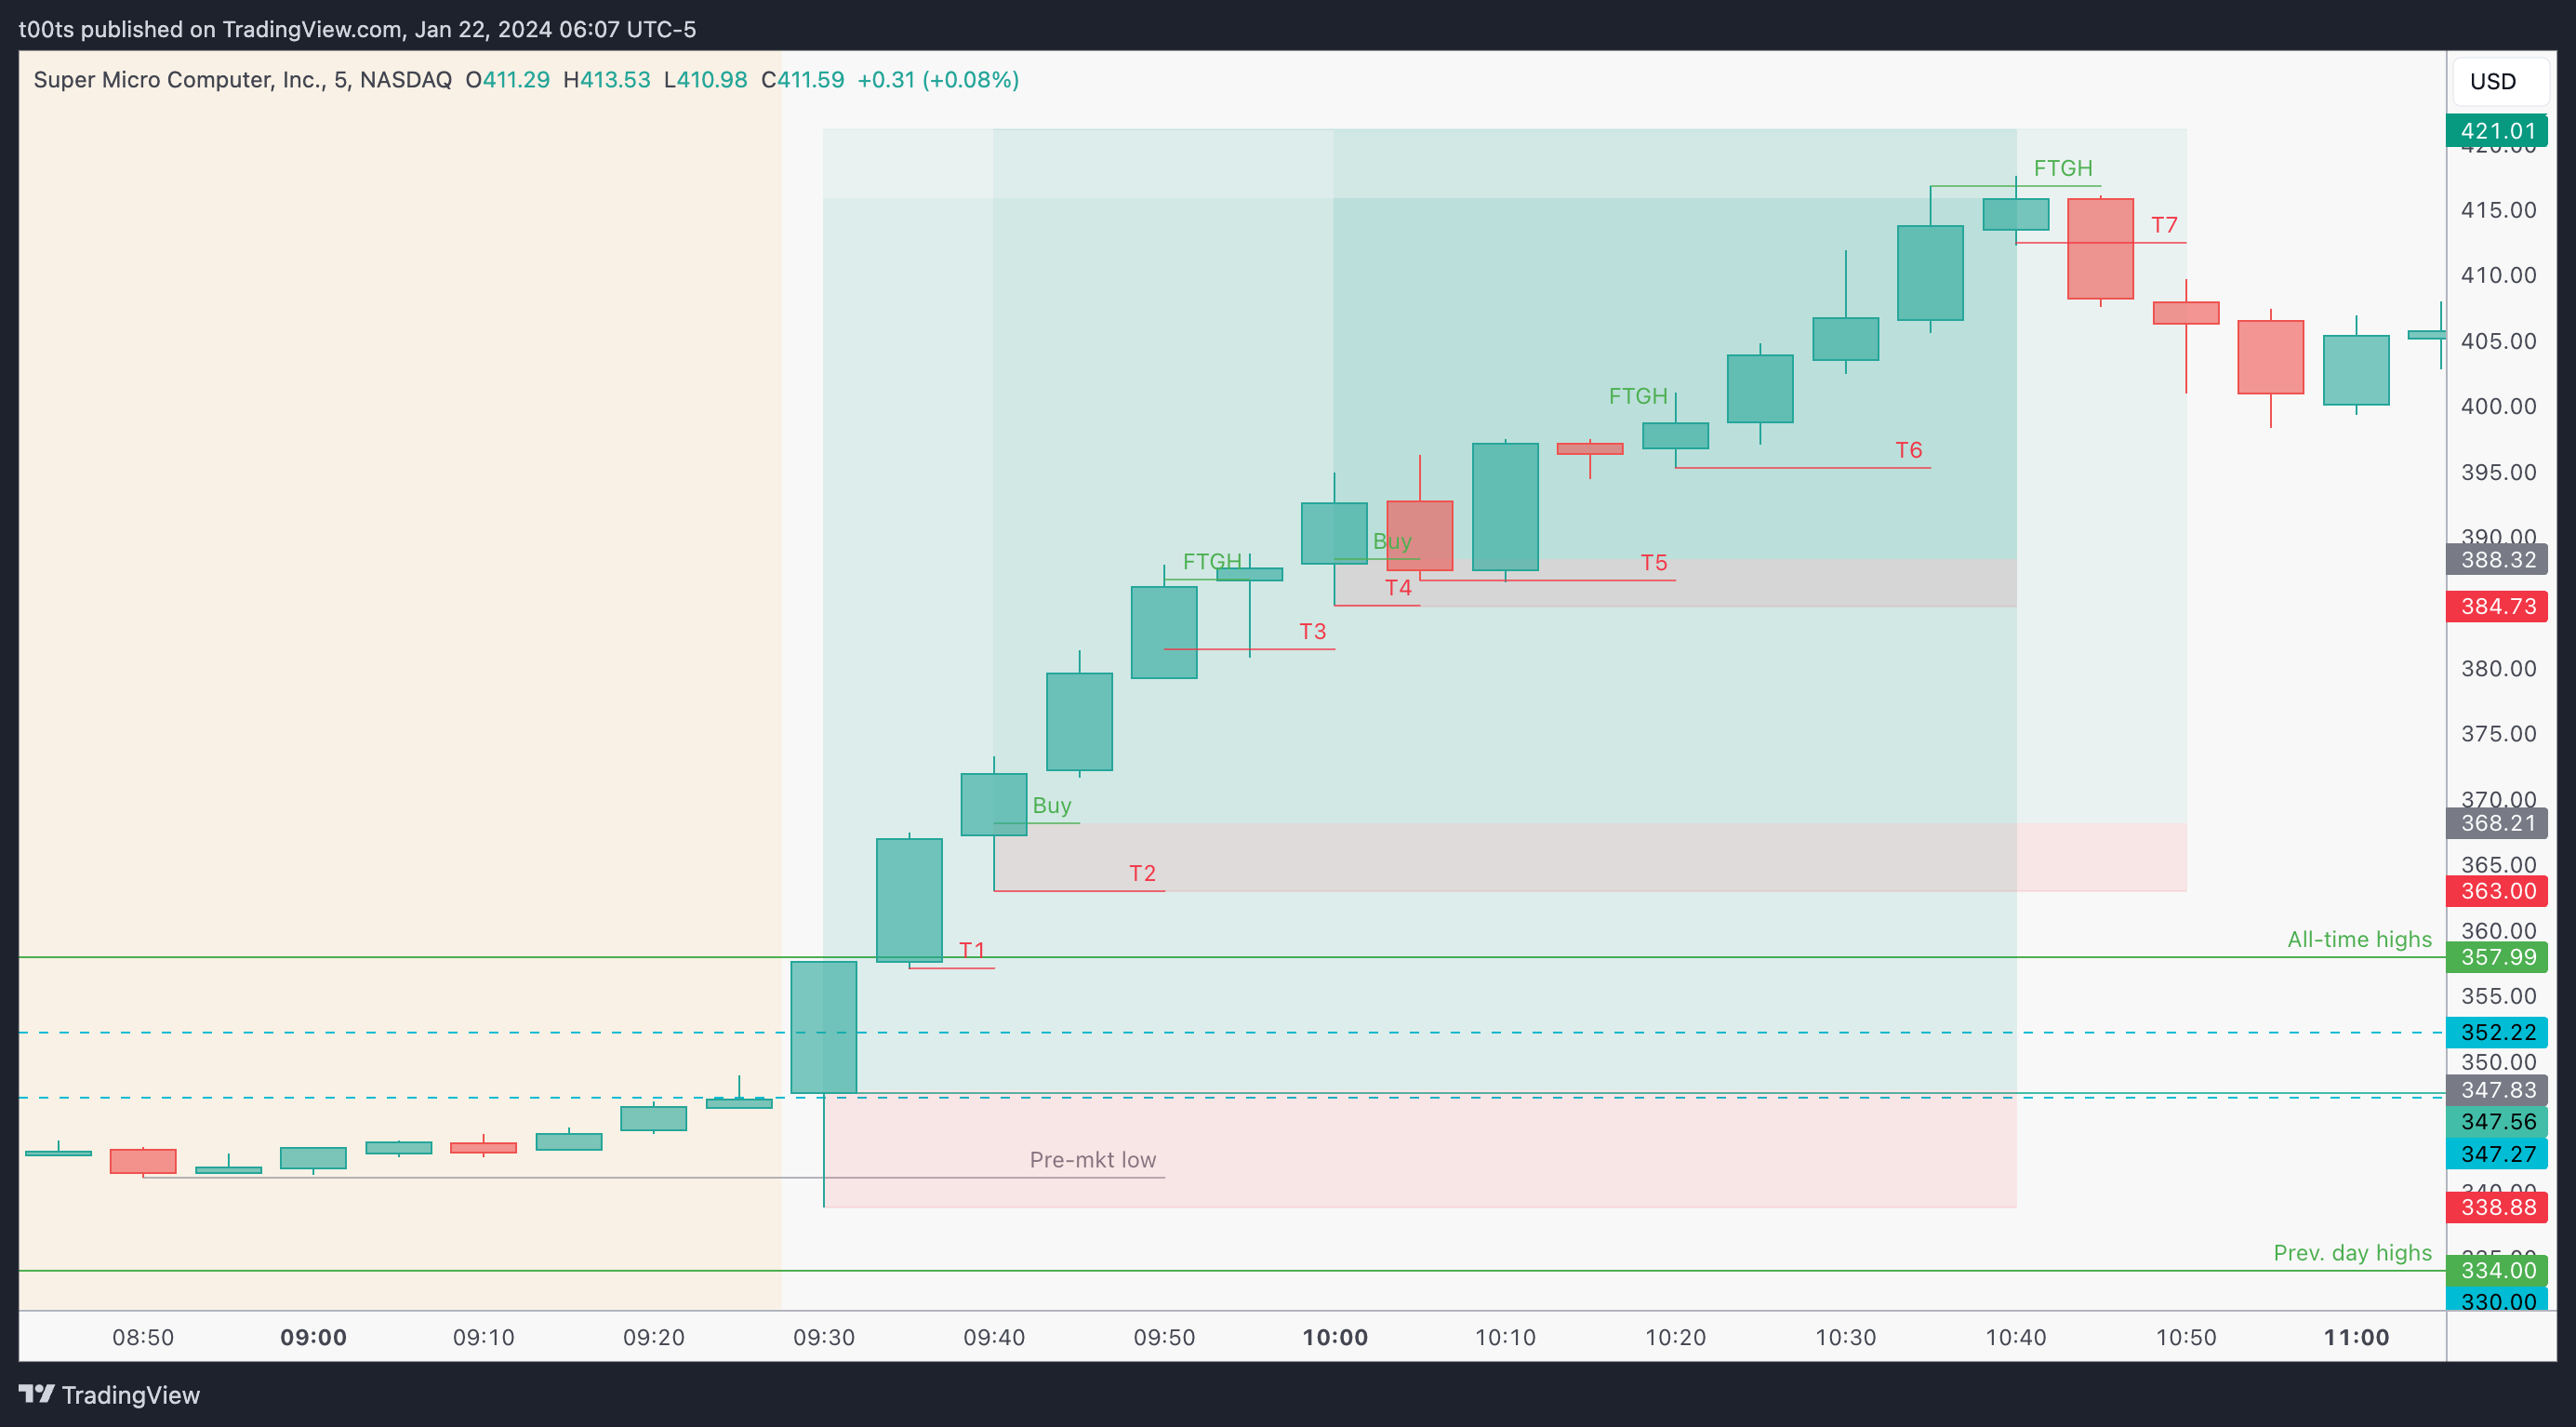
Here's a 5m chart with our previous annotations and entries for reference. As usual, when a trade is an opening drive play, most of the focus is naturally on the lower timeframes, hence why most of the analysis is done on the 2m chart above.
Closing notes
Some of the traders I follow on 𝕏 caught this (some with size) and I cannot be more happy for them. Trading is a game where you get rewarded for your work, especially outside of trading hours.
There are opportunities every day, yet you’re the one ultimately responsible for being prepared to capitalize on them.
In this case, you just had to glance over any market-focused news outlet and it would've probably brought SMCI to your attention. Definitely something I'll be adding to my morning routine from now on. Can't afford to miss these plays.
I am posting one trade writeup every day throughout 2024. I focus on large caps using levels and price action. The subscription is absolutely free and will always be. I will strive to provide value by offering clues and ideas for you to enhance your edge. Let’s grow together!