

Higher timeframe context
PayPal CEO recently came out on CNBC. After admitting there's been nothing to celebrate for a while, he goes on to state that they're about to “shock the world with new customer-oriented innovations targeted to consumers, merchants and partners”. The release date for this news is January 25th. After seeing this on 𝕏, I went on to check PayPal's chart and ended up setting some alerts. One of them triggered this day and may potentially lead to one of the best trades I’ve taken this year. Let's dive into it.
Weekly chart
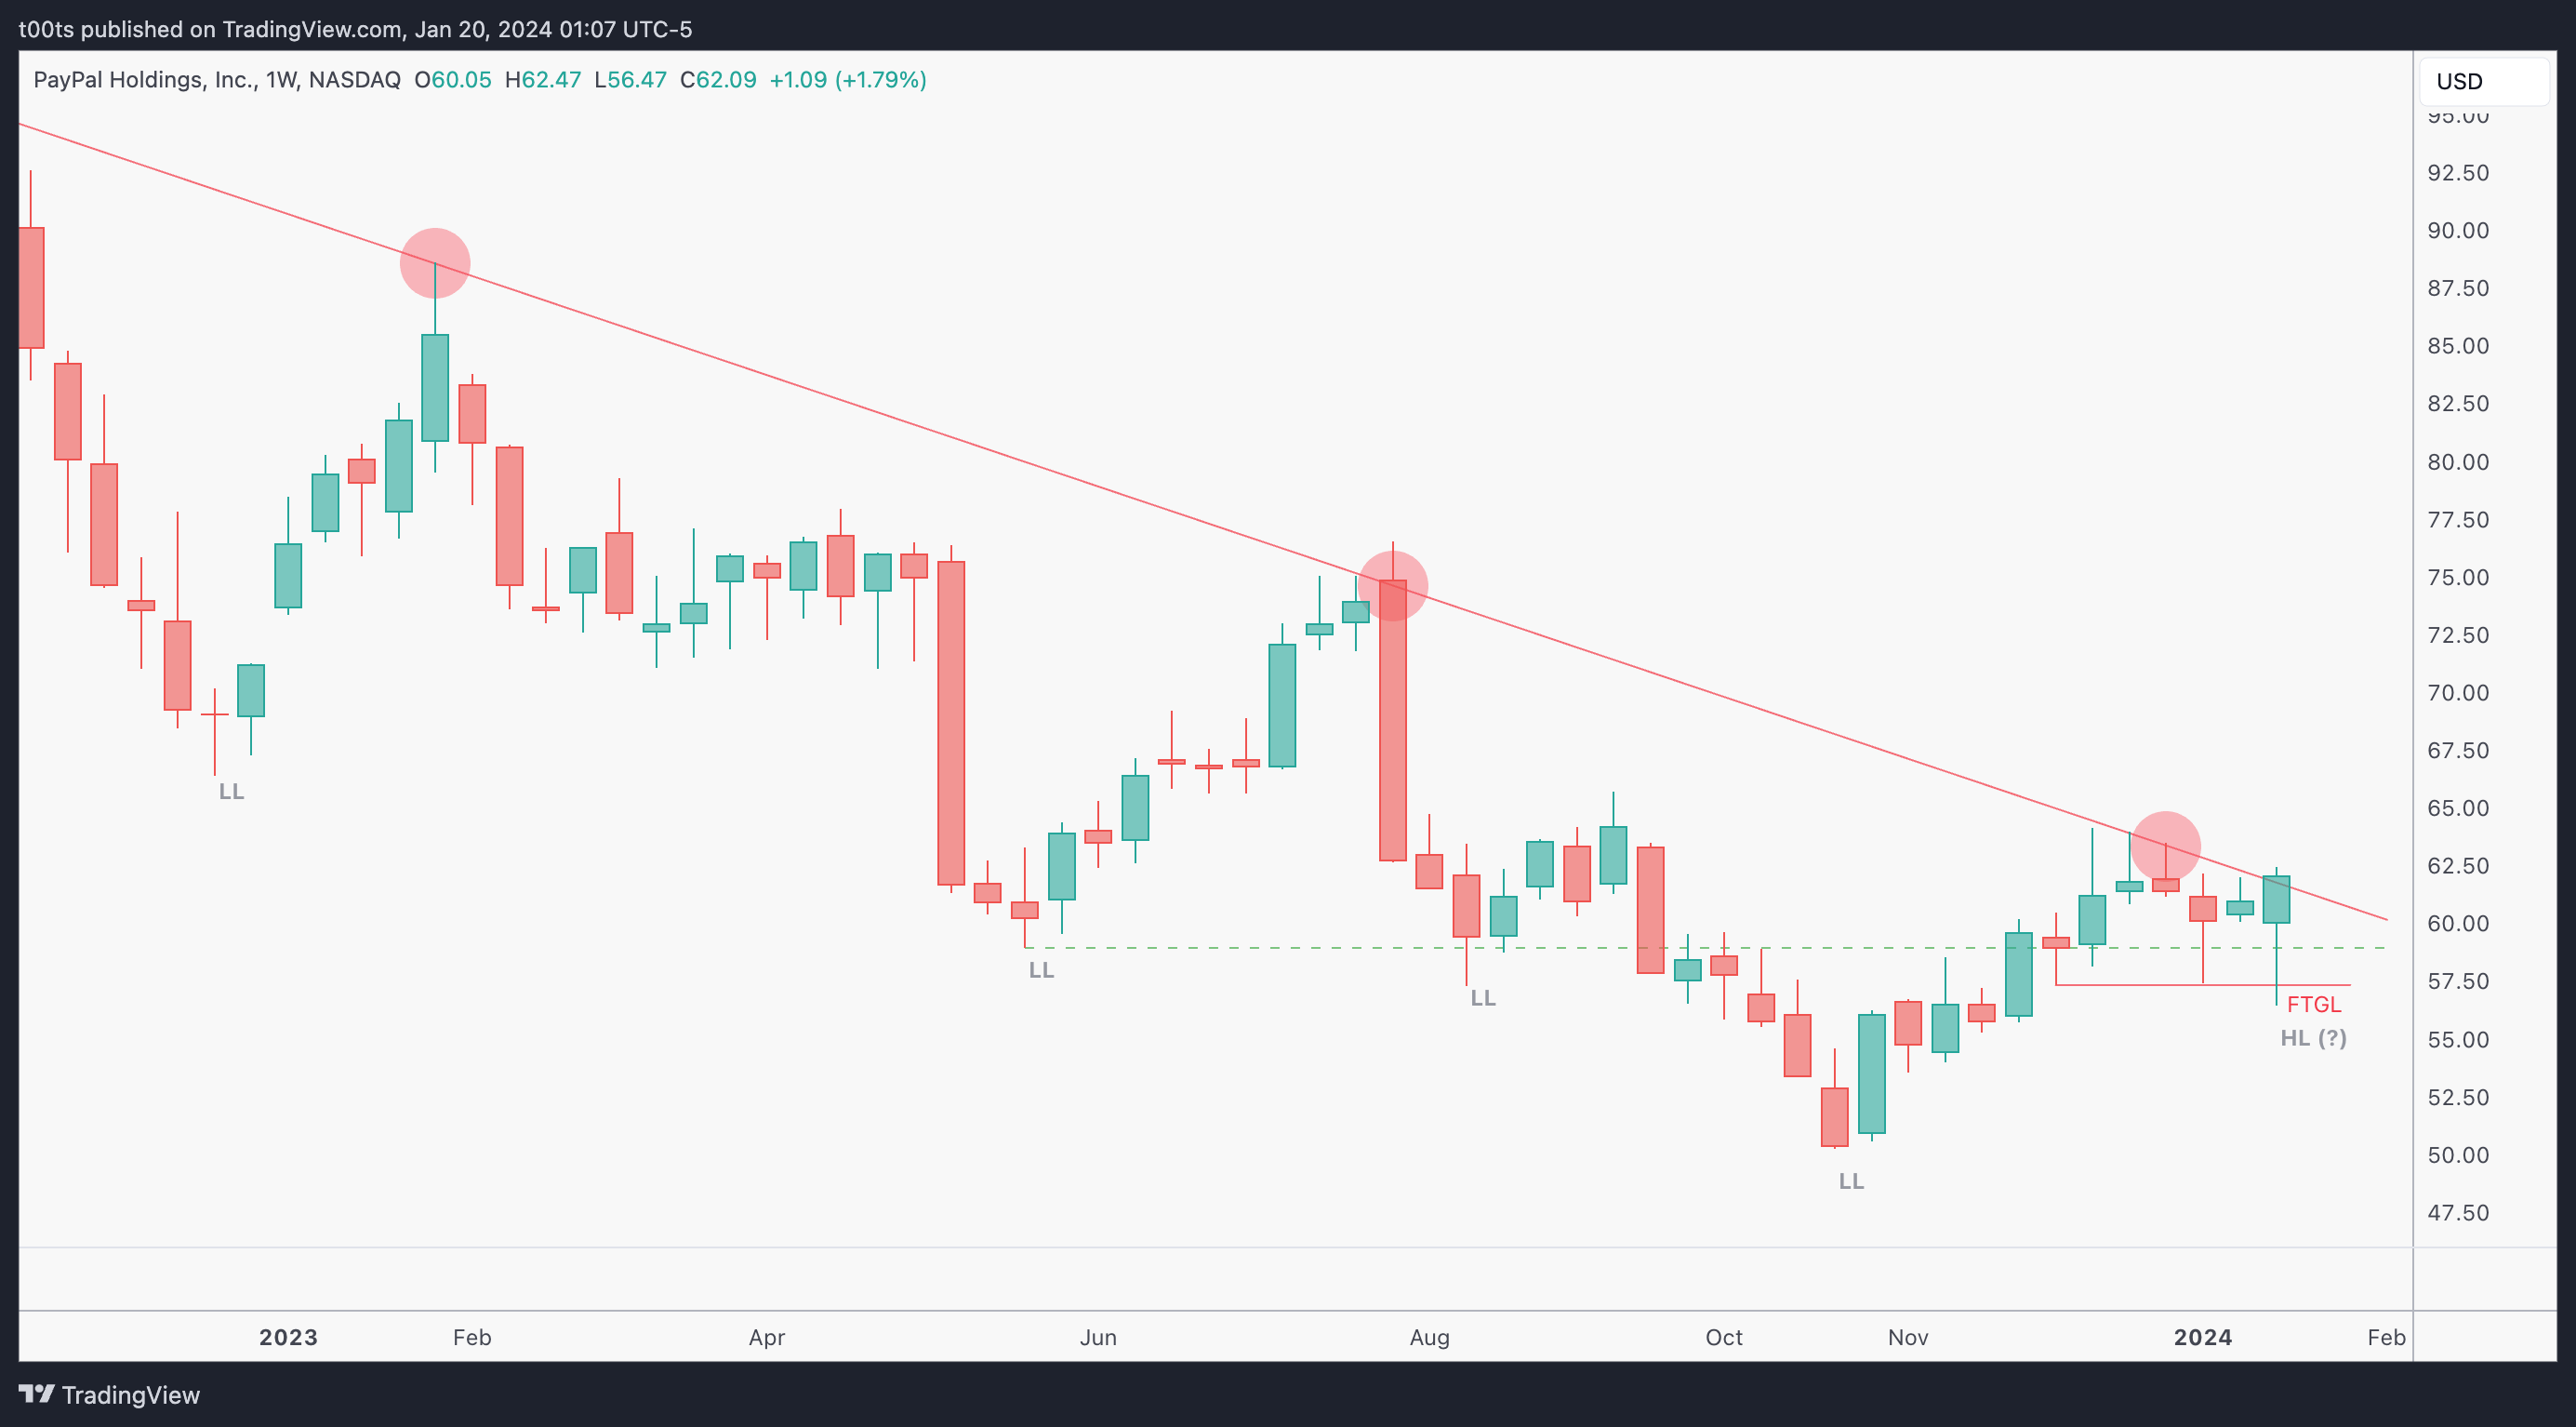
This is one of those trades where the weekly chart is actually what attracts me to it. Sometimes it's the hourly, sometimes it's even the pre-market action. On this occasion, this weekly chart just stood out. Notice how, after breaking down back in October 2023, price has managed to reclaim the previous support (marked with a green dashed line) and is again approaching the multi-year bearish trendline, potentially setting up a higher low for the first time in a while. Furthermore, what really moved the needle here for me was how the current weekly bar failed to go lower and is now setting up to break the trendline.
Daily chart
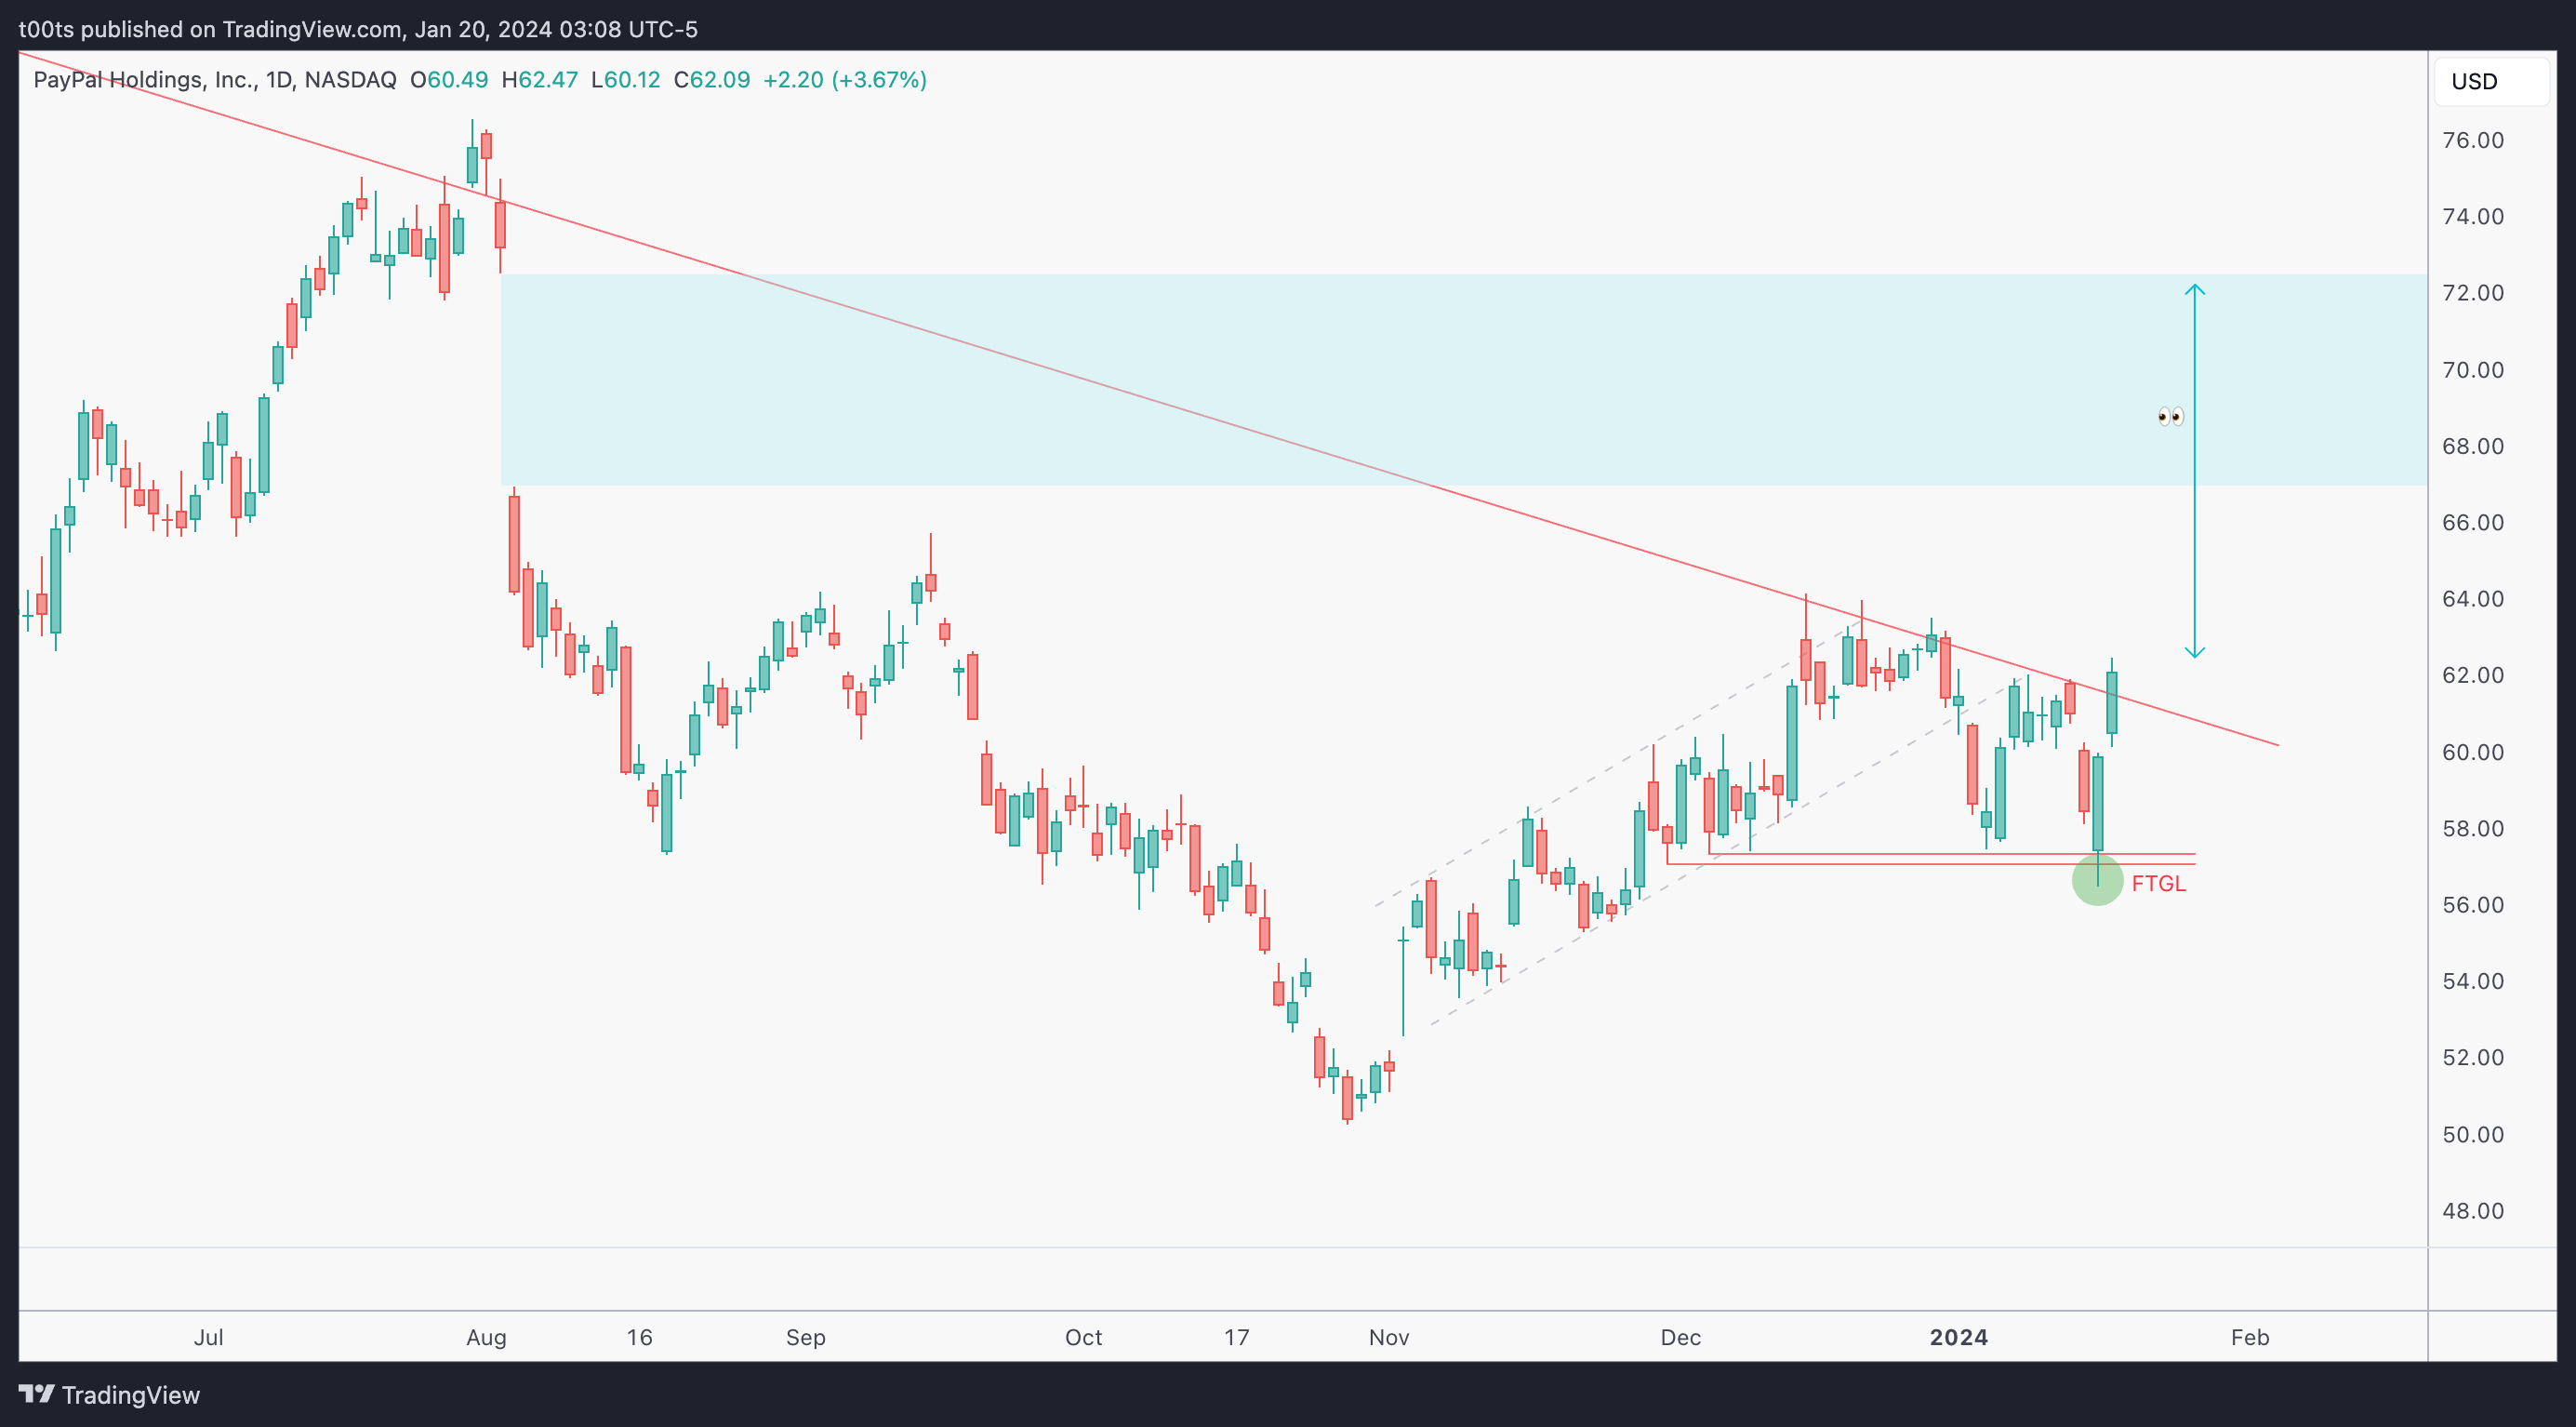
We can see in more detail how the daily chart has been fighting against the trendline for the past few weeks with no luck for bulls. I can count up to 4 clear rejections on the chart before this last push we're currently in. Two very strong trend bars are setting us up for a potential breakout after bears failed to push prices lower. Notice that huge unfilled gap above. These gaps tend to attract price and eventually get filled.
Hourly chart
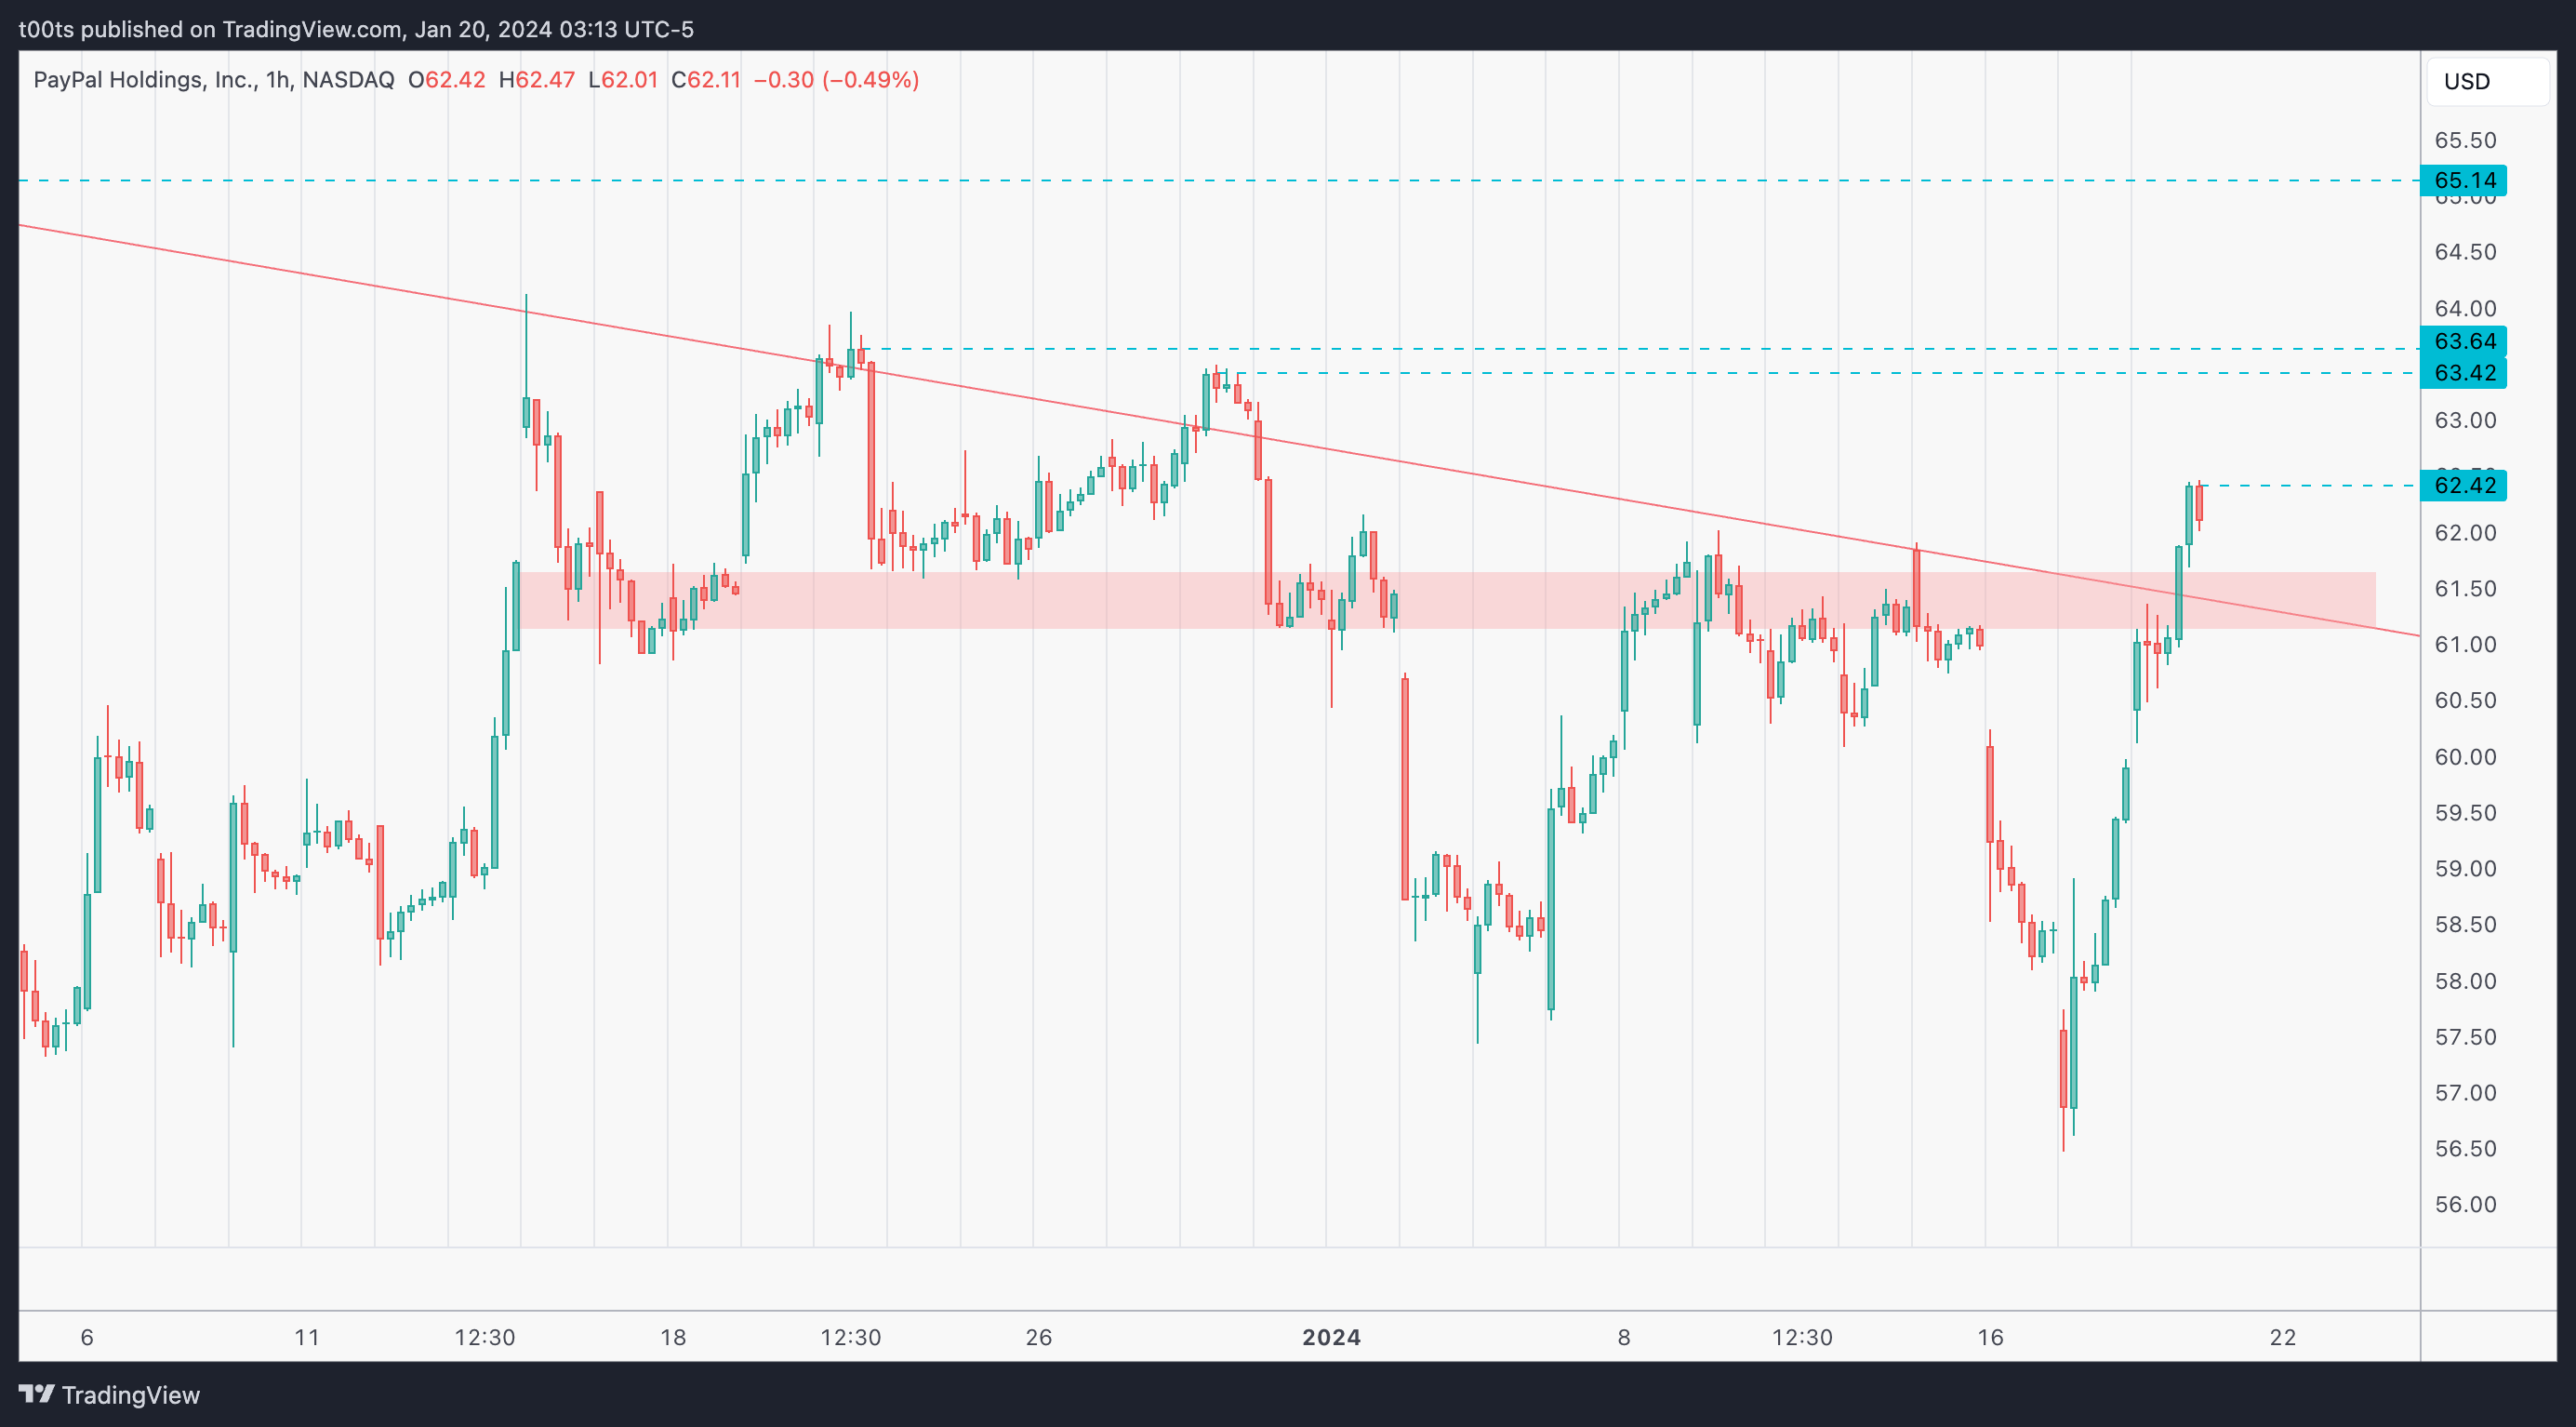
Here's our hourly chart coming into the day. I've left the weekly trendline there for reference, but don't pay too much attention to it.
I like how we're above this area marked in red, which has been an area of conflict for the past few days. Yesterday buyers cleared that with a lot of strength, paving the way for a move higher. Note our hourly levels. There's a lot of room between them if we can gain some traction. The $62.42 should help us gauge momentum conservation. If price can hold there, and considering we're at a weekly inflection point (multi-year bearish trendline), things could get squeezy.
Pre-market action
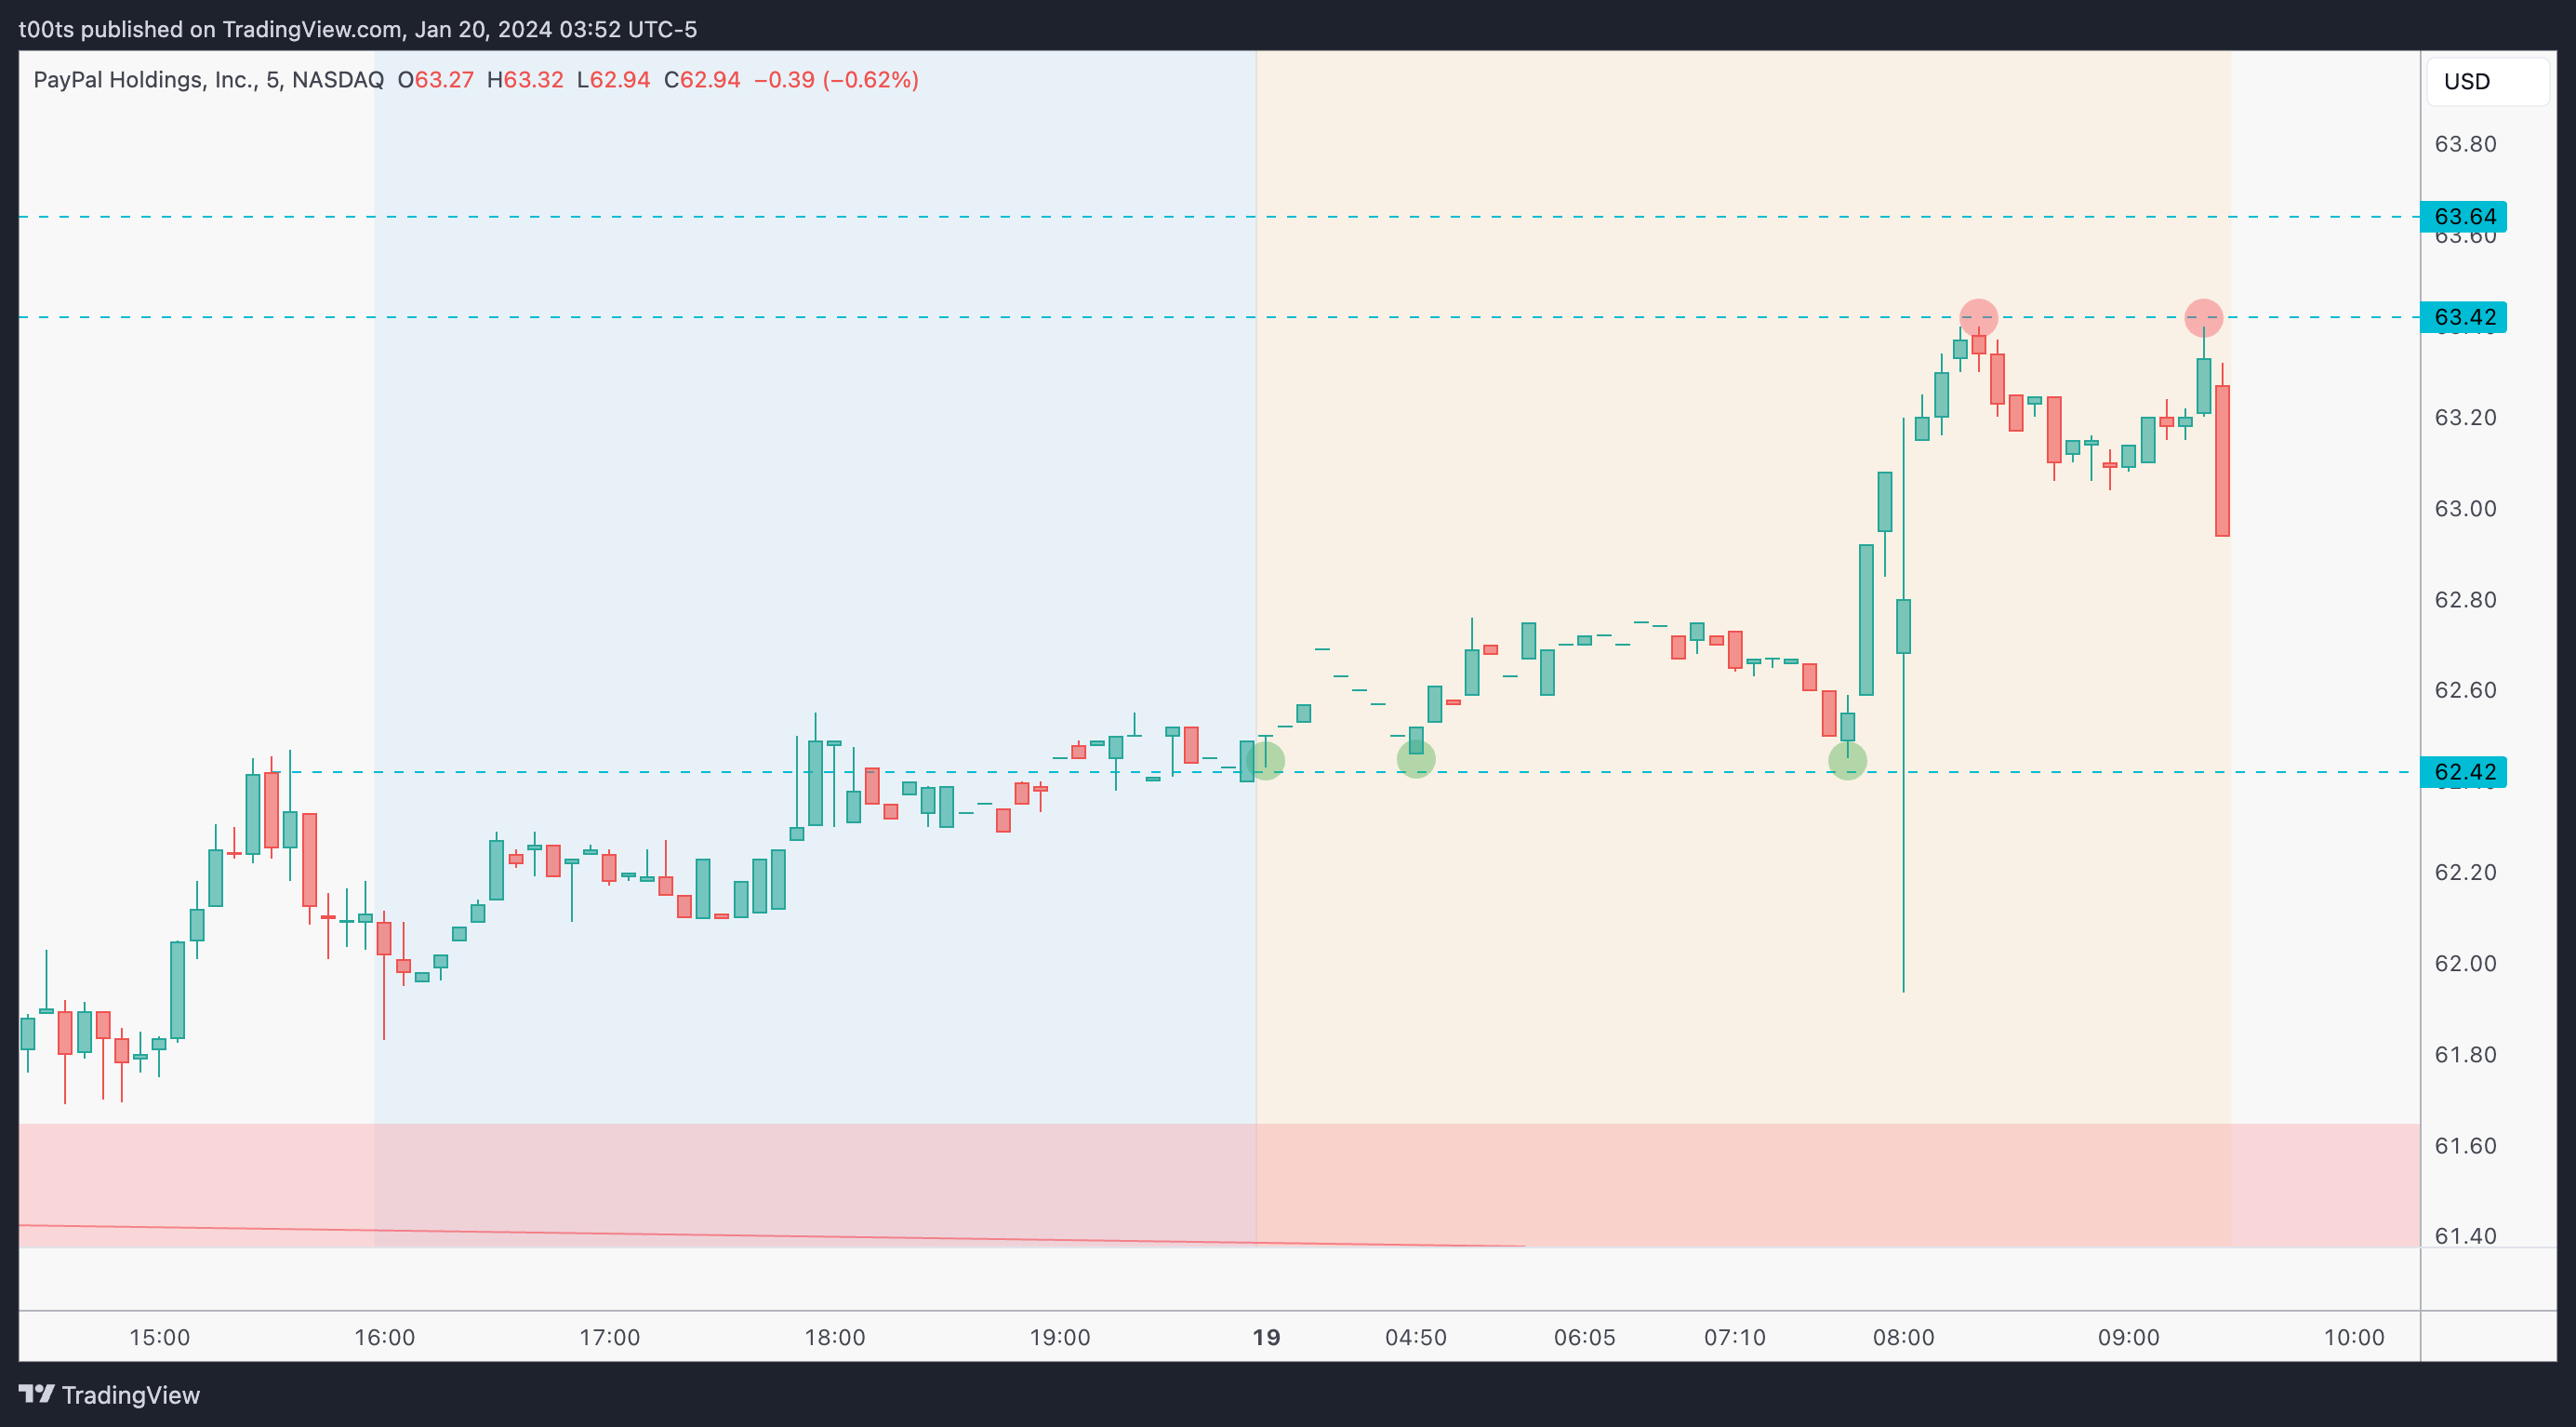
Leaving the pre-market chart here for reference. As mentioned earlier, I got drawn to this trade because an alert I had set triggered right at market open. The pre-market action was irrelevant at that point.
The trade
I might have jumped the gun a bit early on this one, but ever since my first entry I was looking for a bigger move, as that weekly chart was looking juicy for a breakout. This day I took 4 entries and still haven't taken an exit.
Using our CPT Framework:
Cue(s)
CEO setting high expectations for an announcement 6 days from now
Weekly chart putting in a potential higher low with a failure to go lower
Weekly chart about to break out from a multi-year trendline
Huge unfilled gap above on the daily chart
Intraday cue: Our high momentum level of $62.42 holds the open
Plan
Buy every intraday higher low. Accumulate a position for a week-long swing. The idea is to sell near or when the news is finally out, maybe leaving runners for the gap fill.
If $62.42 is lost exit full position and wait for a better entry. Don't get married to this.
Trigger
From 9:30 - 10/10:30 buy every higher low on the 2m chart
From 10/10:30 - Noon buy every higher low on the 5m chart
After Noon - Buy higher lows on the 15m chart
2m chart (early morning entry details)
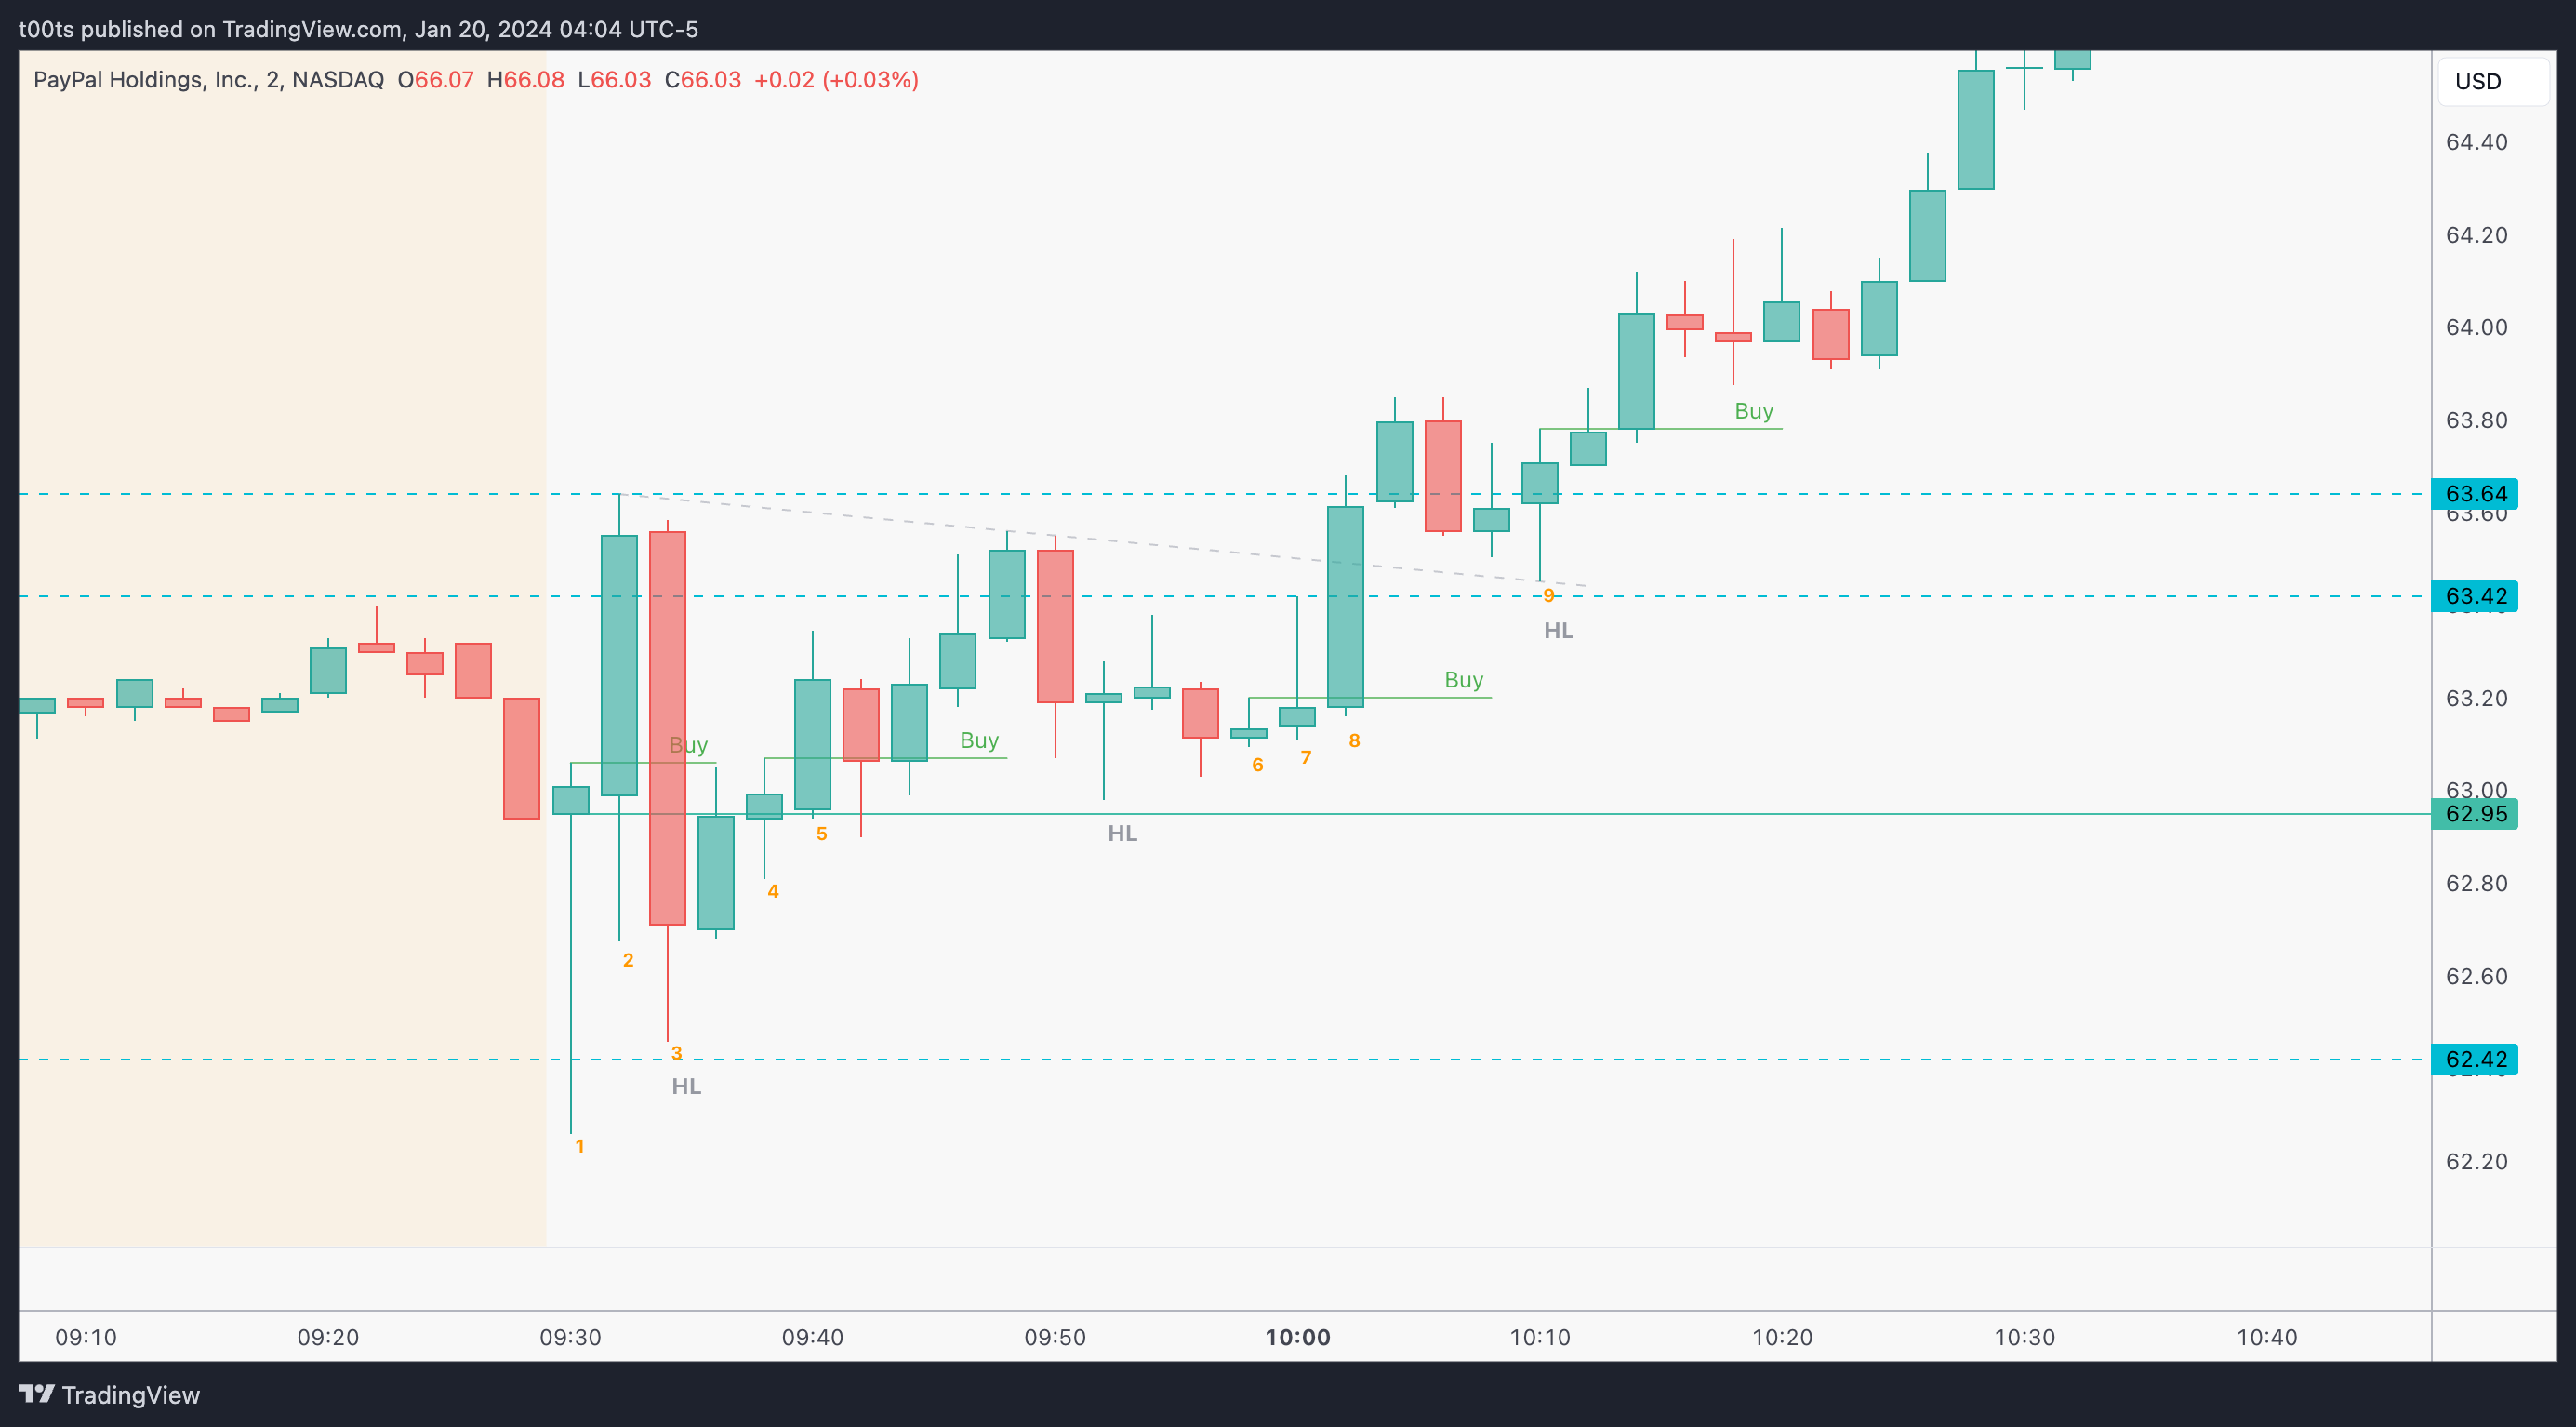
Bar 1 sets up a very clean entry for an opening drive play. I didn't take this entry because I wasn't watching this name, but I honestly would've taken it if I was.
Bar 2 triggers the alert that brings me to this chart. I start watching.
Bar 3 shows a strong rejection of that $63.50 area, and closes below the opening print. However, after such an aggressive move, there's not much follow through to the downside...
Bar 4 is almost an inside bar that reclaims the opening print. As we often say, “almost” in trading is good enough.
Bar 5 breaks out of the previous inside bar and triggers a 3-bar play to the upside. This is where I take my first entry, risking the lows of Bar 4 but also knowing that we have our opening print right below that we want to see hold. I alert this entry on 𝕏.
Bar 6 is another inside bar after a two-legged pullback. If you've been reading you know how much I love these. So naturally, my second entry is when Bar 7 breaks the highs of this bar.
Despite a bit of a shakeout at 10am, Bar 8 finally breaks the $63.42 level and the intraday trendline between the two previous highs.
Bar 9 was probably the best and safest entry of all in this chart. You have an uptrend, two levels to risk off of, a failure of previous bar lows, and clear skies above. And yet somehow I totally missed it.
5m chart (all entries)
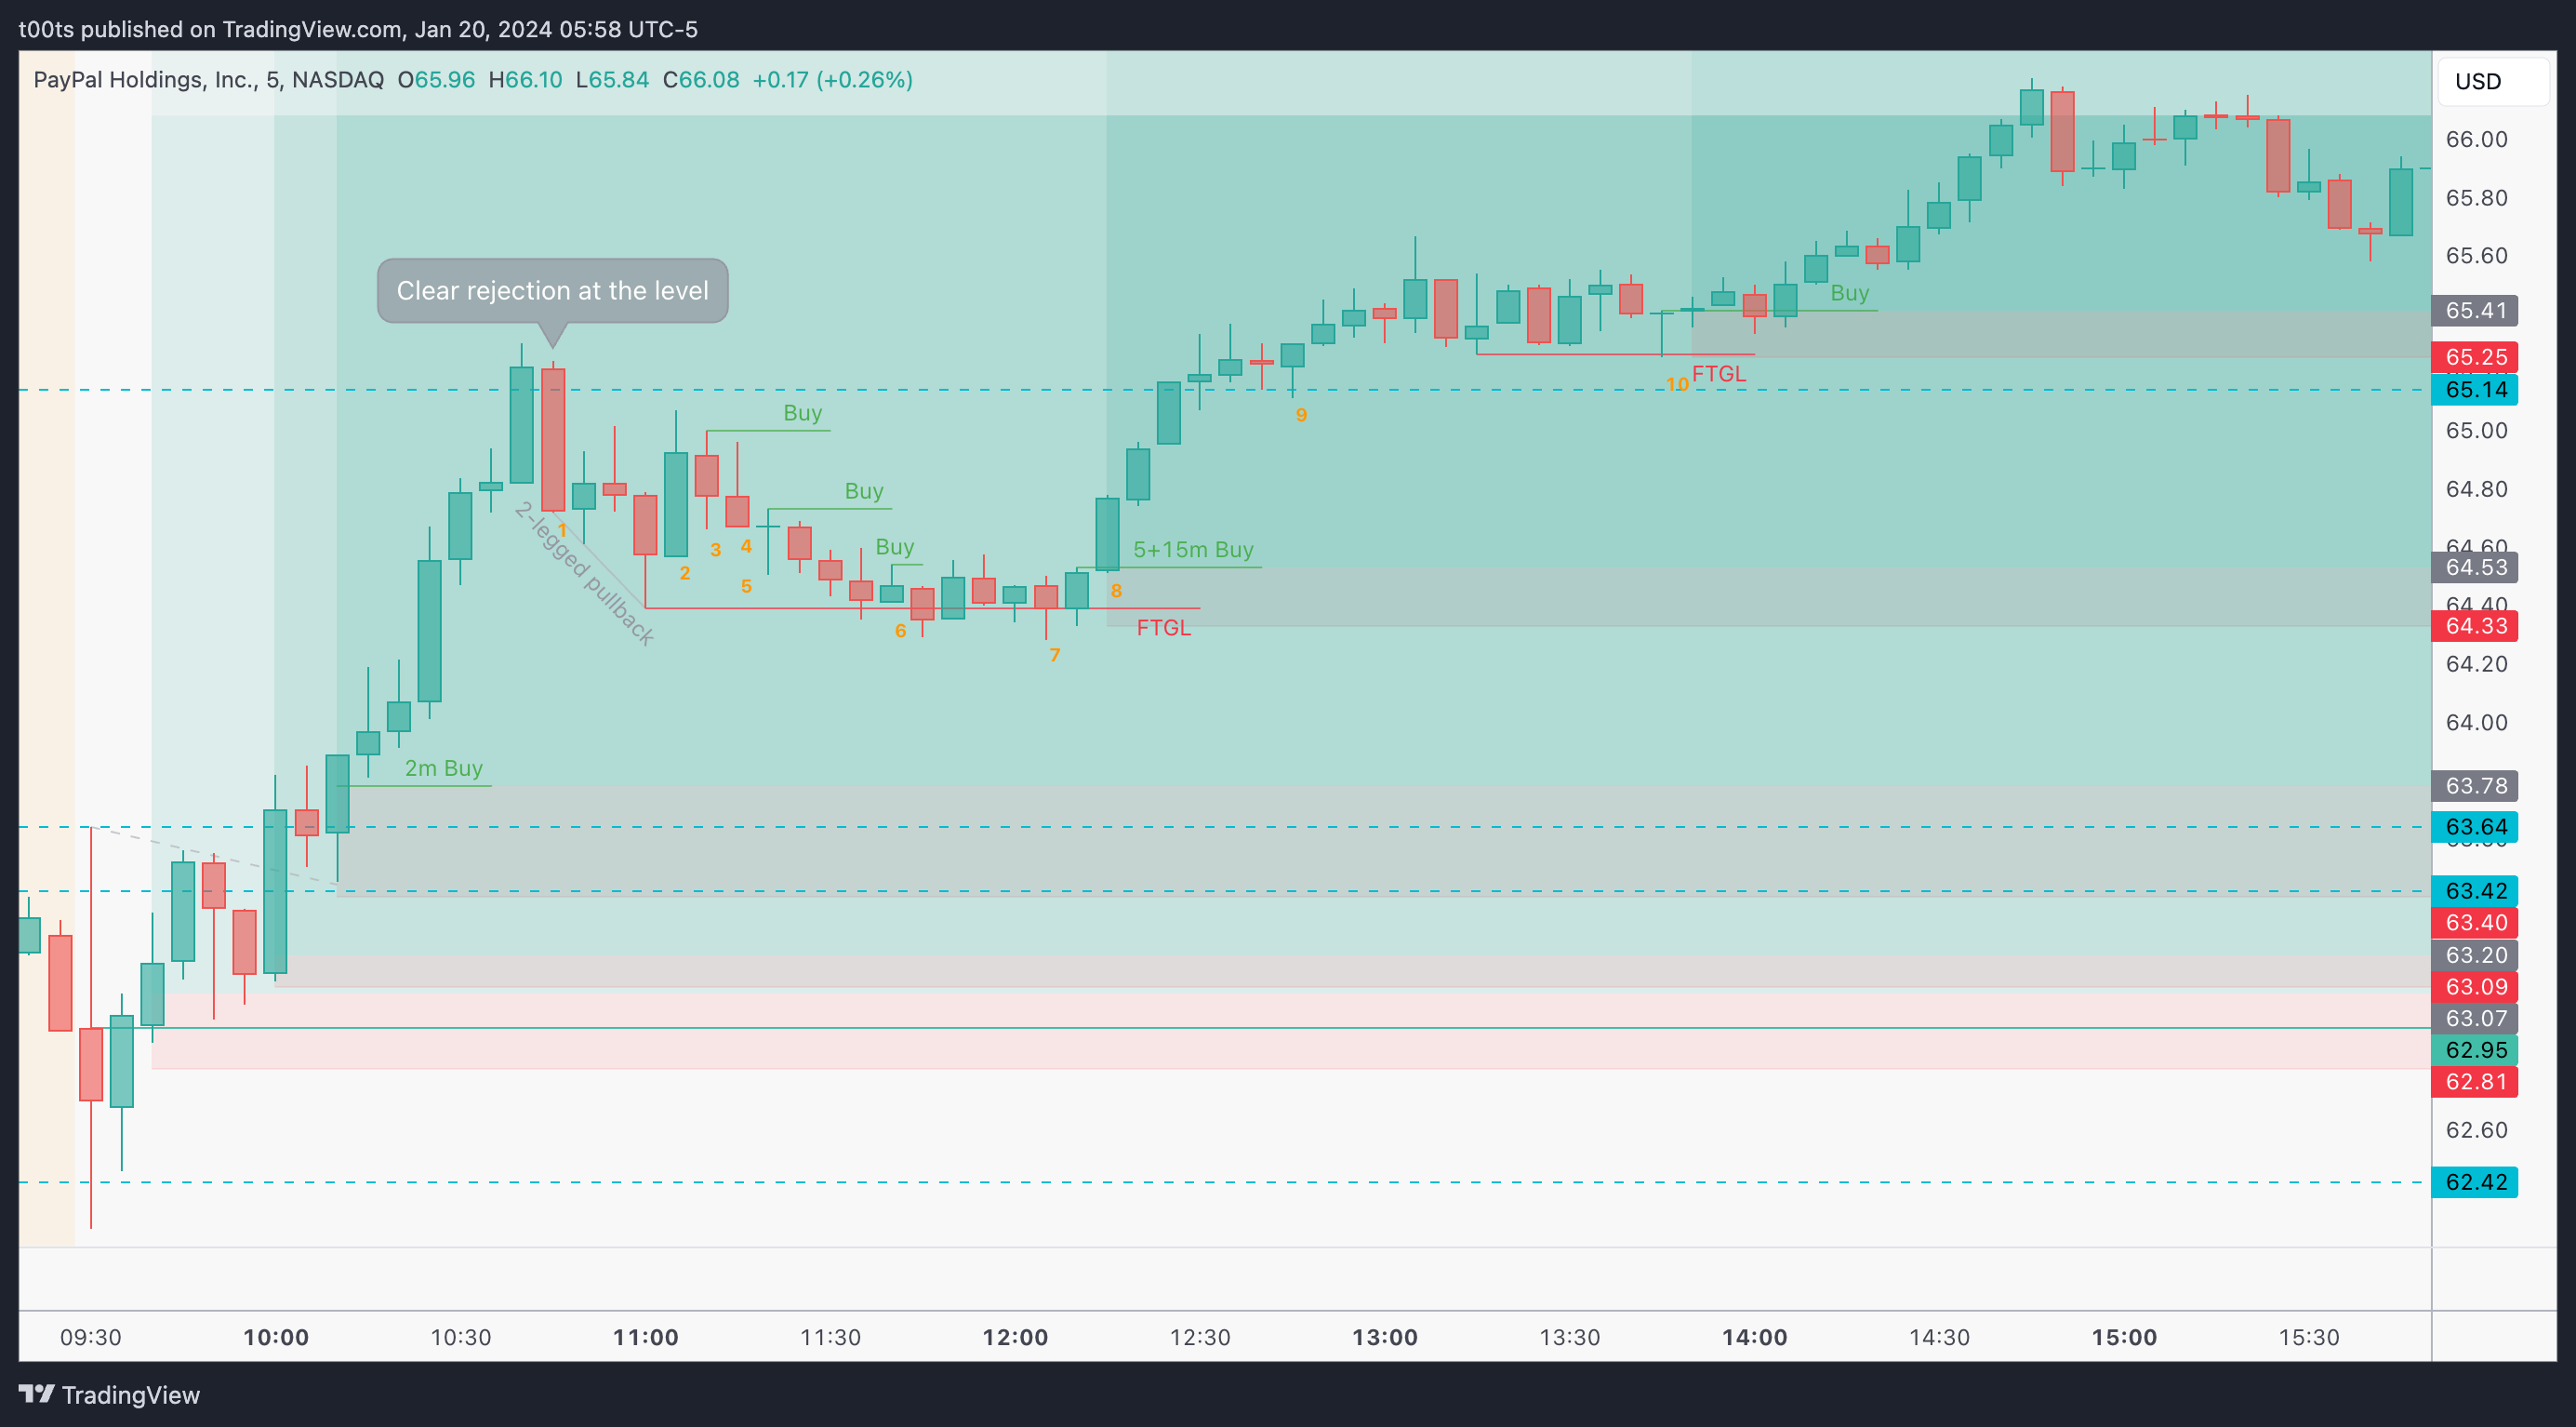
Bar 1 is a bearish engulfing trend bar that rejects off the $65.14 level. I see this rejection, but I'm zoomed out and confident in the higher timeframes, so I posted that I'd hold for a swing.
Bar 2 is a nice bull trend bar that gives us the first clue that buyers might be ready to resume the trend.
Bar 3 is an inside bar setting up a nice 3-bar play off the previous bullish trend bar.
Bar 4 is a double inside bar off that potential 3-bar play that never triggers to the upside.
Bar 5 breaks down on that 10m range, but closes back at the lows, failing to go lower. This would've been a solid entry for a long, but it never got triggered. Instead, price faded lower.
Bar 6 is another inside bar after a small failure to go below that previous low where buyers tried to resume the trend. Again, can be used as a buy setup but never triggered.
Bar 7 again fails to go lower and this one will finally set us up for the next leg higher.
Bar 8 is a solid trend bar that triggers the buy setup from its previous bar. I took this entry (on my phone) as it aligned with a beautiful 15m buy setup (not shown).
Bar 9 is another buy setup off a level, but it's lunch time and we're at daily highs, so probably not worth taking.
Bar 10 is a nice doji that sets us up for the final move higher. I added my last tier here.
Closing notes
We still don't know how this trade will turn out. We only know what we're risking in our intraday entries, but it's pointless (in my opinion) to talk about R here as we just got in and anything can happen. Best case scenario, stock rises 10% and fills the gap. Worst case scenario, stock falls back down and I'm forced to exit with nothing.
I'm very happy with my entries. This could be my best trade so far this year, but we'll have to wait and see if it plays out. You always hear the famous “Buy the rumour, sell the news”. Well, here's the “Buy the rumour” part. Let's wait and see what the news brings next week.
I am posting one trade writeup every day throughout 2024. I focus on large caps using levels and price action. The subscription is absolutely free and will always be. I will strive to provide value by offering clues and ideas for you to enhance your edge. Let’s grow together!