
Snowflake (SNOW) - Feb 2nd 2024
Riding the wave: Profiting from big player tailwinds

Higher timeframe context
It's a big earnings week and all the major tech companies have been reporting strong quarters. Snowflake is neither among this select group nor has its earnings coming up, but as we’re about to explore, it offered a great long opportunity for anyone who ran a quick morning scan before the bell and patiently waited for the setup to form.
I feel it is important to go over this trade because it was straightforward enough to consider it as one of those base hits that you can't afford to miss. Even if your attention around the open was on the stronger names (mine was on NVDA and META), this trade set up an hour into the day and was a great way to pad the wallet.
Weekly chart
An interesting weekly chart that has been on watch recently after it finally broke out from this multi-year wedge it has been basing off since mid 2022's. We can see how the breakout gave us a nice trade on that 3-bar play breakout, but after that there was no follow-through and instead price headed back down to retest the upper trendline of the wedge.
Price does indeed bounce a first time there but is followed by a strong failure. The second bounce creates a failed failure pattern. As we know, these failed failures usually lead to great trades. Price does indeed gap up the following week and is now ranging ahead of a potential continuation move up.

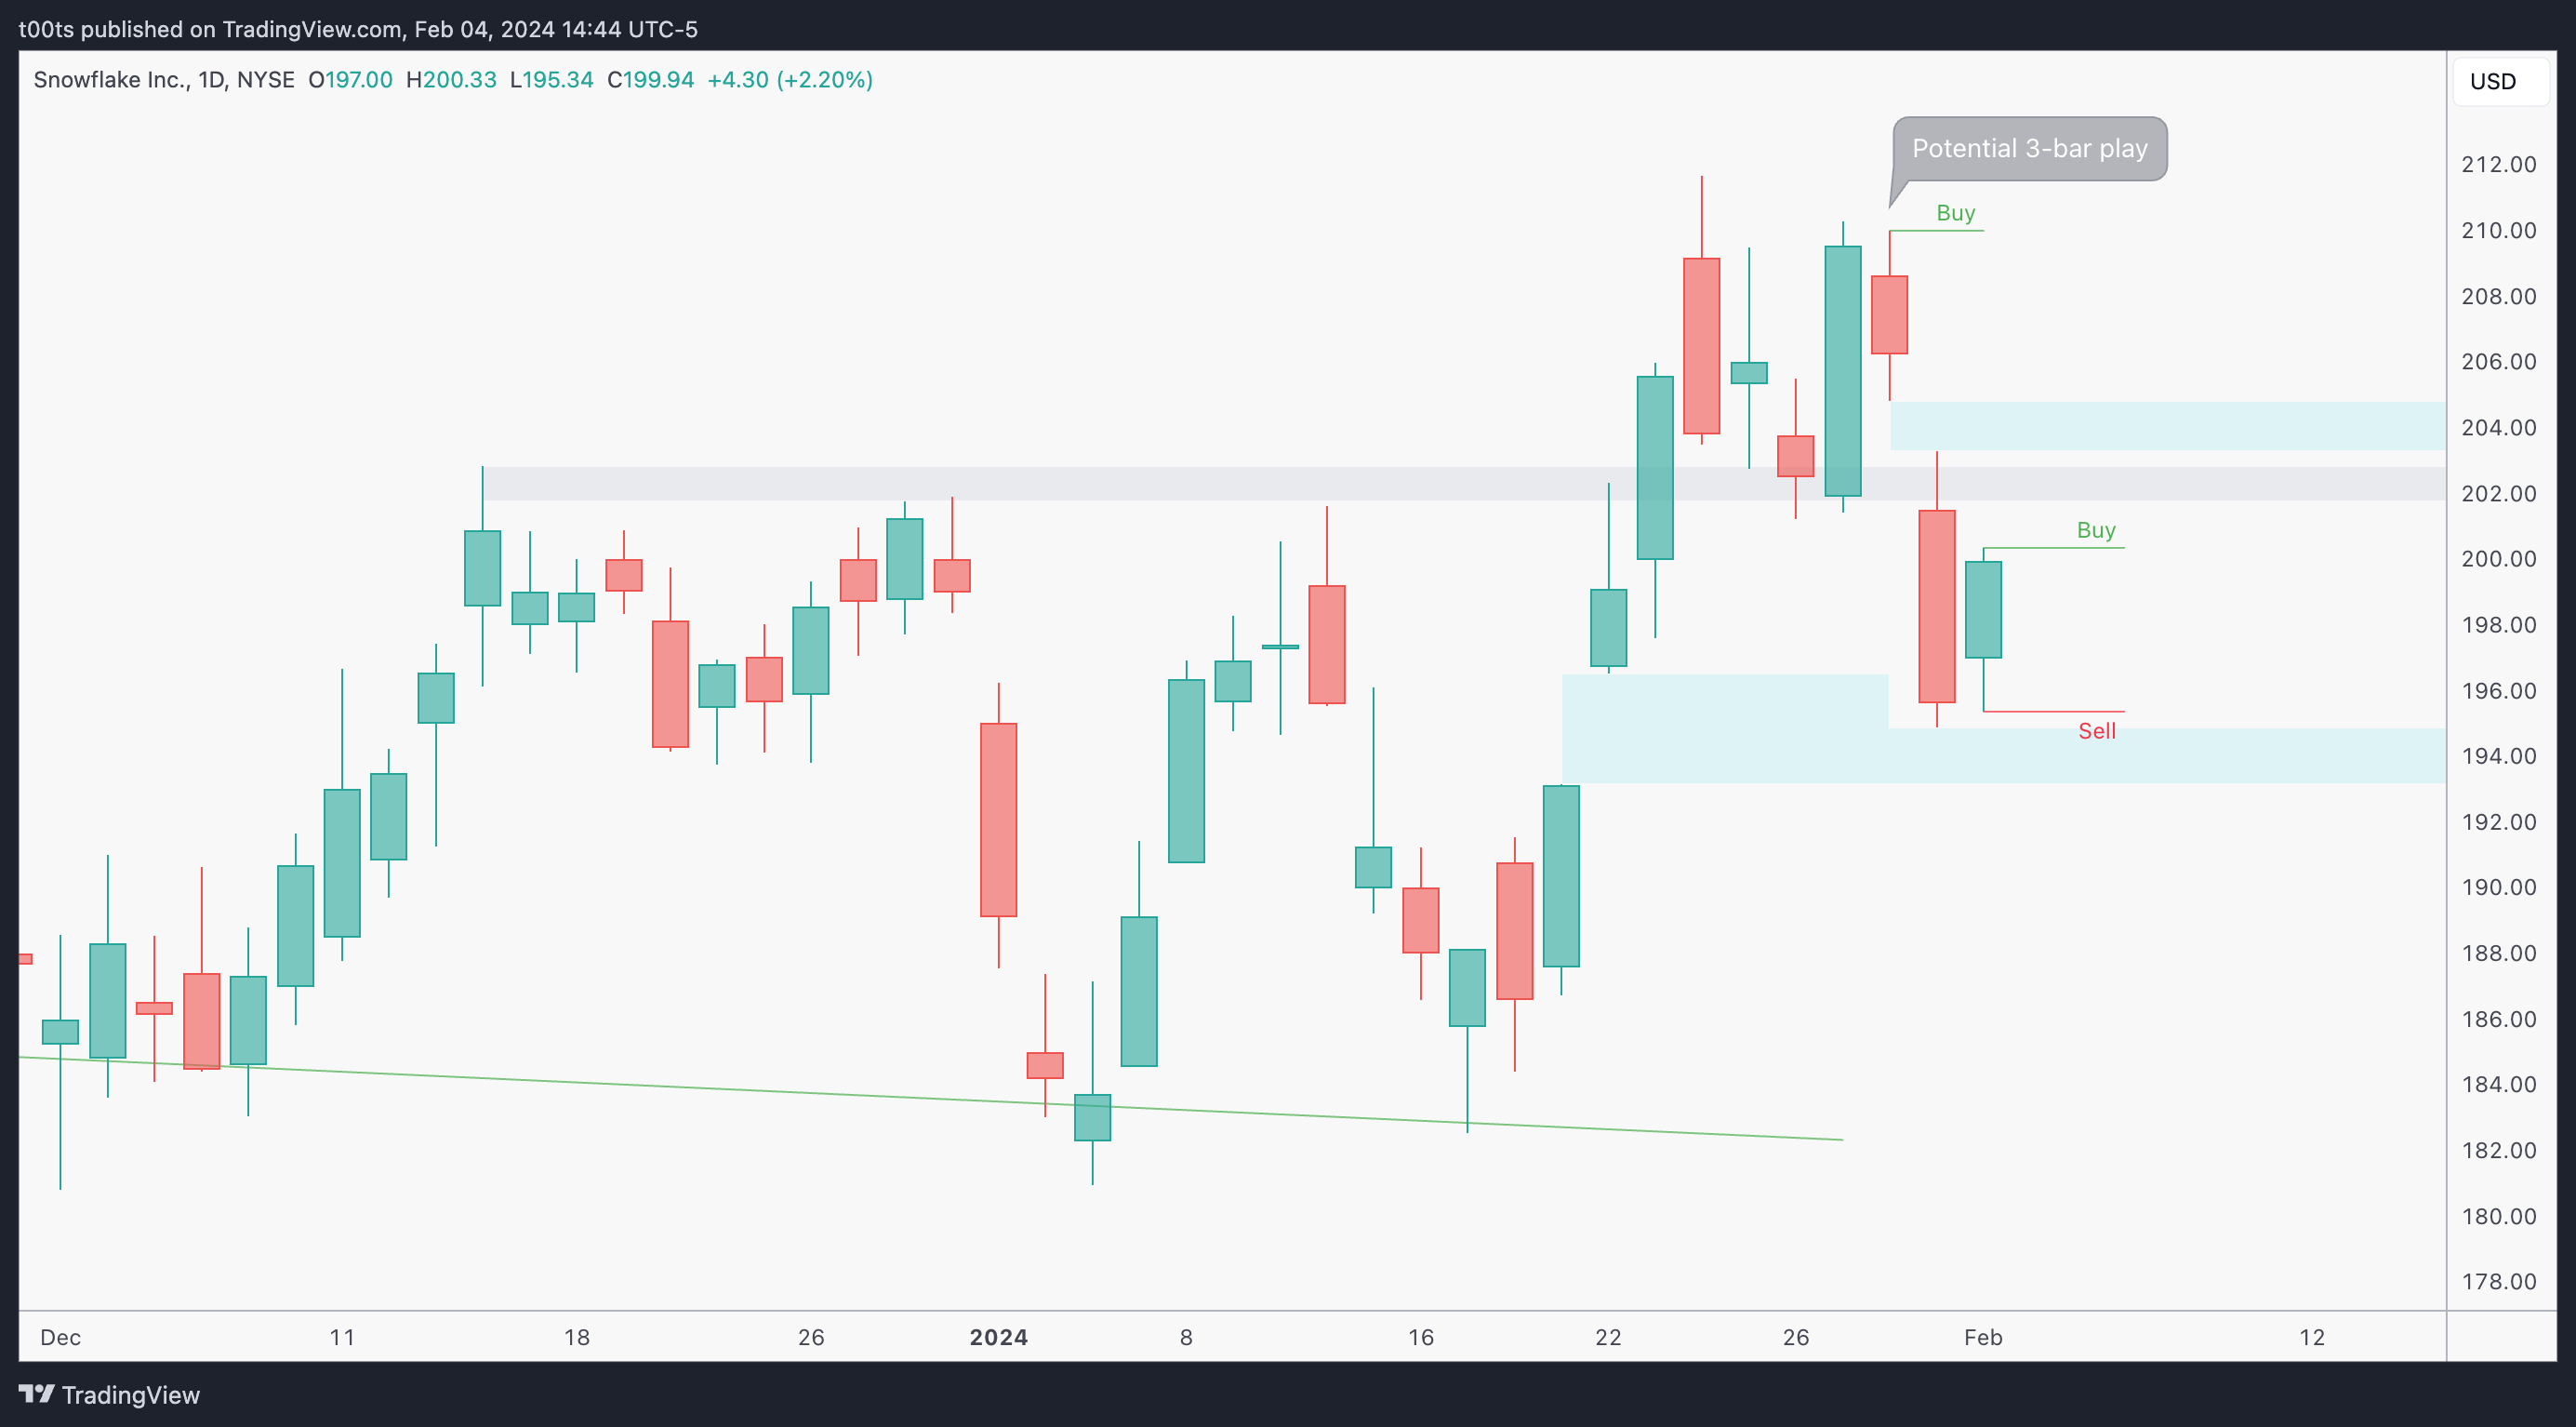
Daily chart
Straight off the bat, this daily chart is not really what we want to see for a continuation move up. The moment price fails to break out of that potential 3-bar play and gaps down back into the previous range, it attempts to reclaim the $202 area but gets rejected and trends all the way down to the gap fill. This is a clear change in market structure as price has lost its uptrend support.
It's interesting to note how after this bearish candle the stock prints an inside bullish trend bar, suggesting that either buyers are not done or they want a retest of that $202 area to bring this back down.
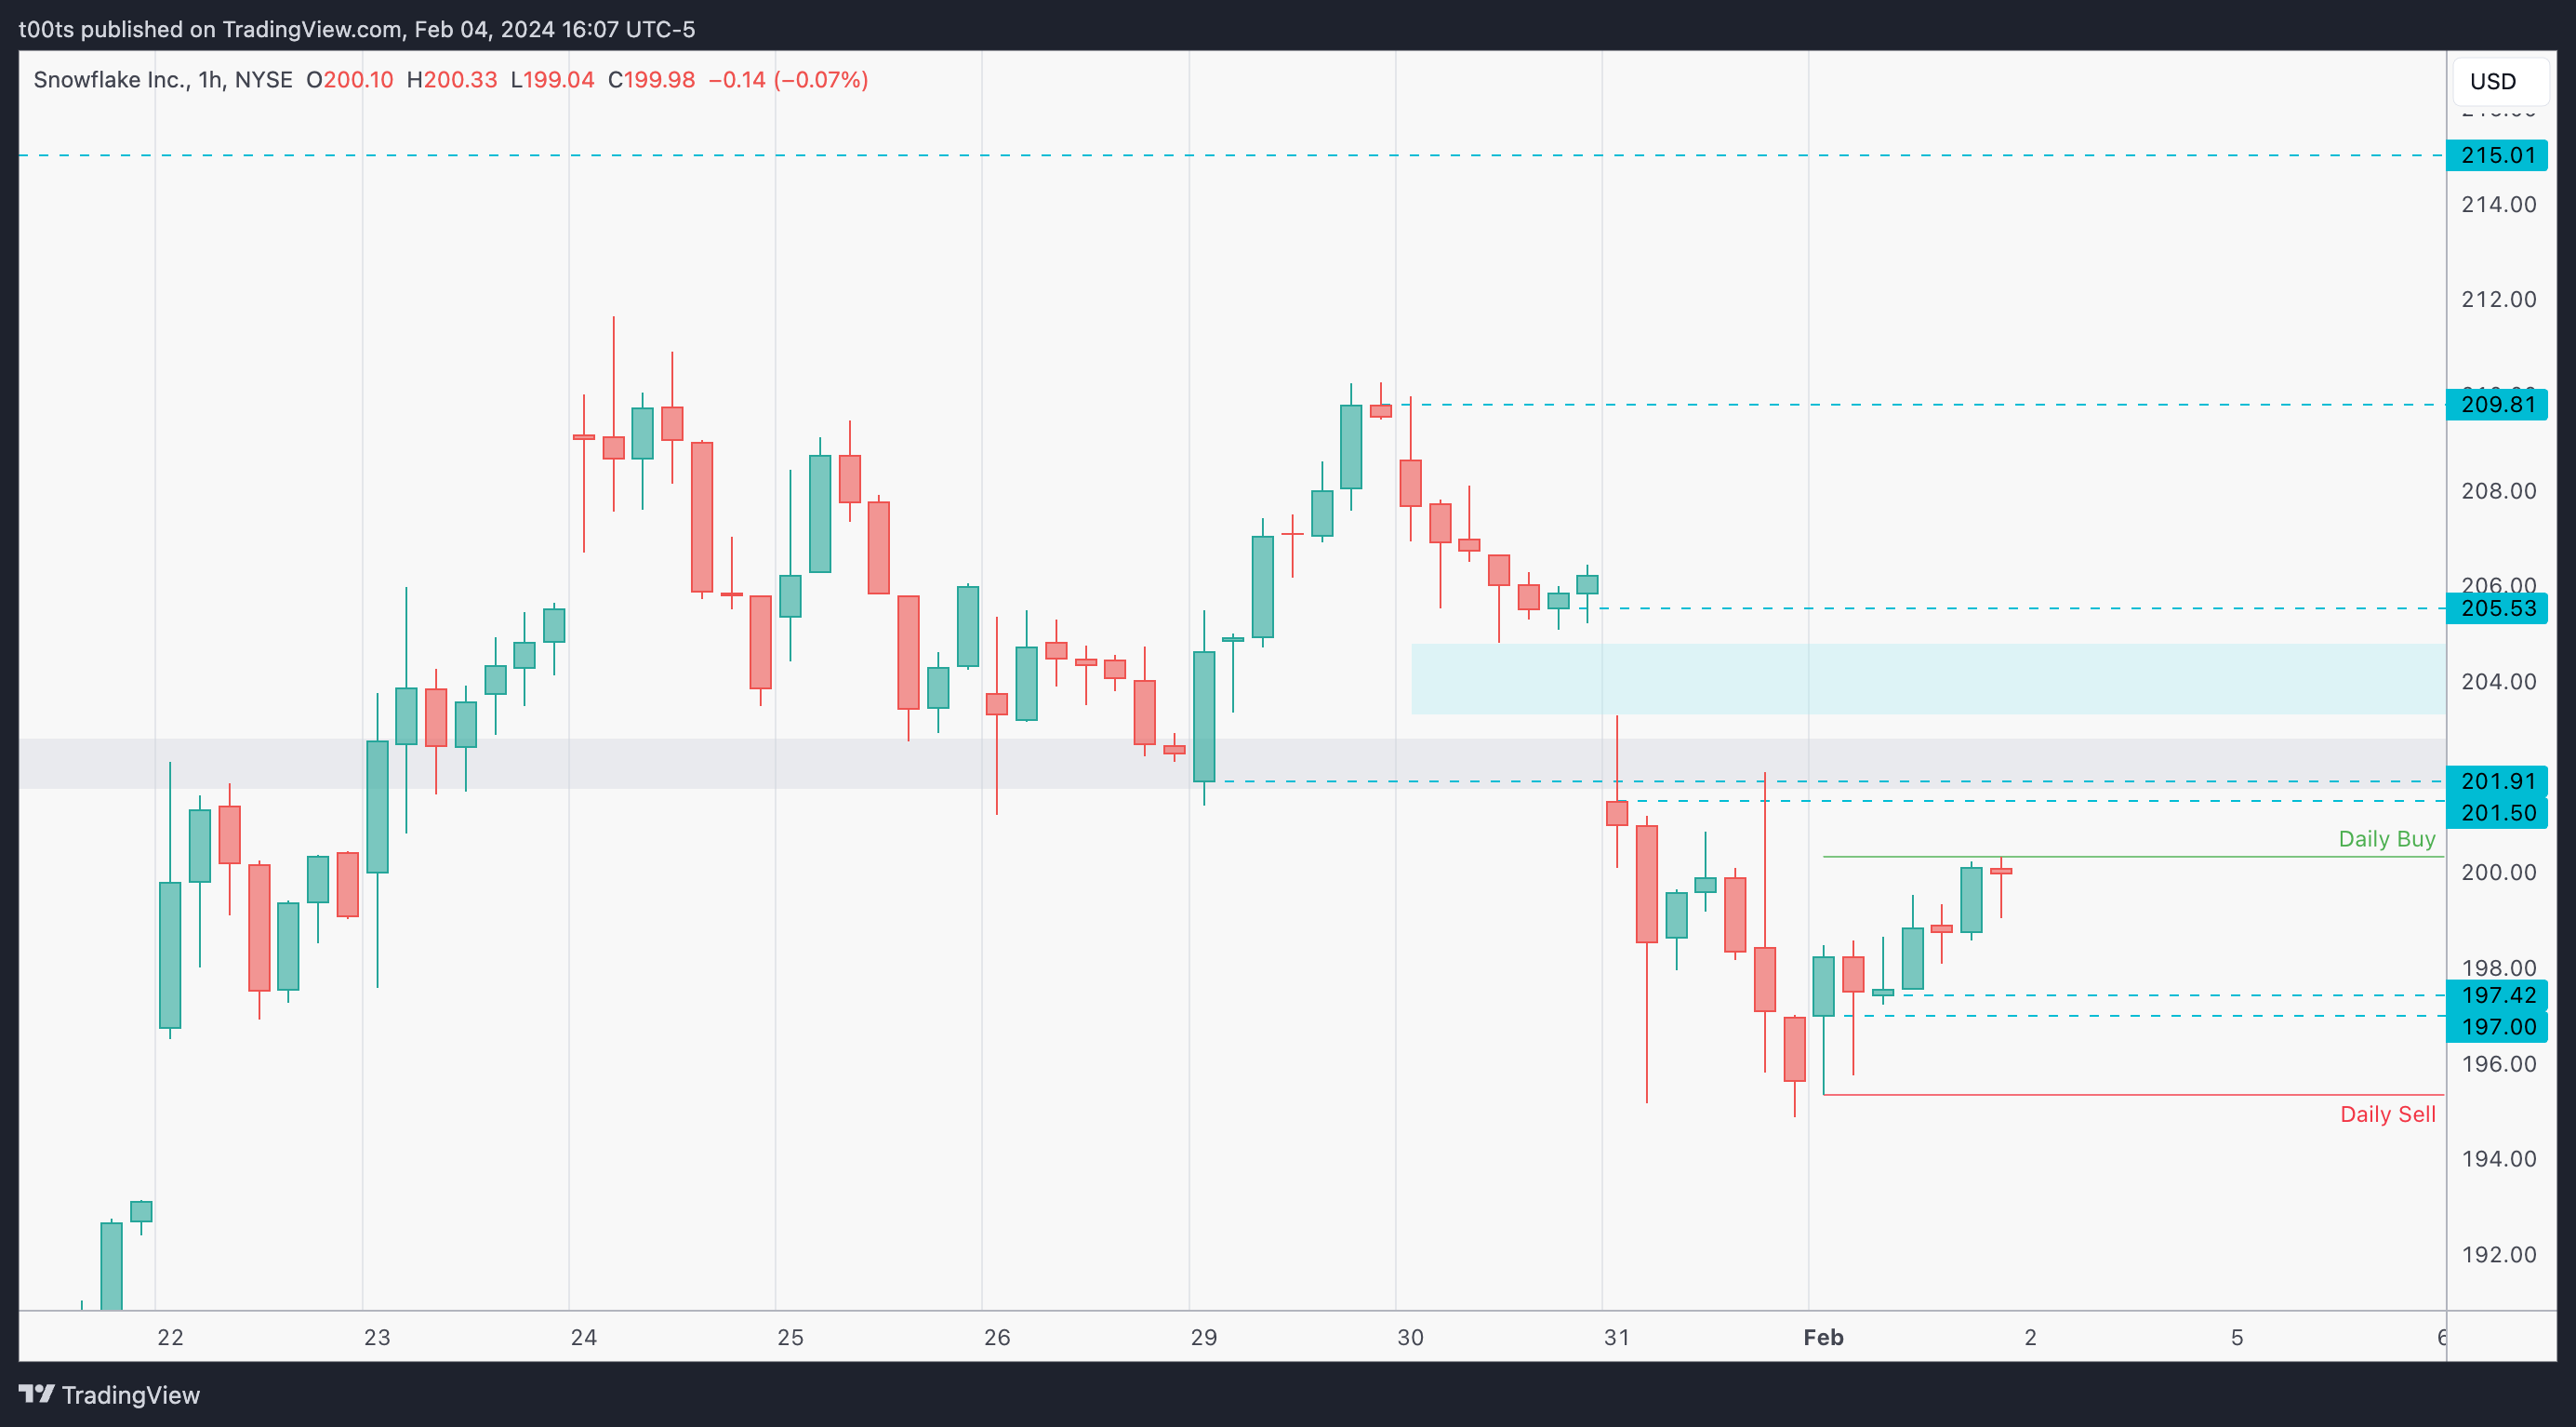
Hourly chart
The most important levels on this chart are the $201.91 and the $209.81. Both are key in their context as they stem from significant pivots. The first one is right at the daily support/resistance area we were mentioning above. If the stock gaps above this area we'll want to see a hold of this level. The second one is expected to act as resistance the moment price trades around that area.
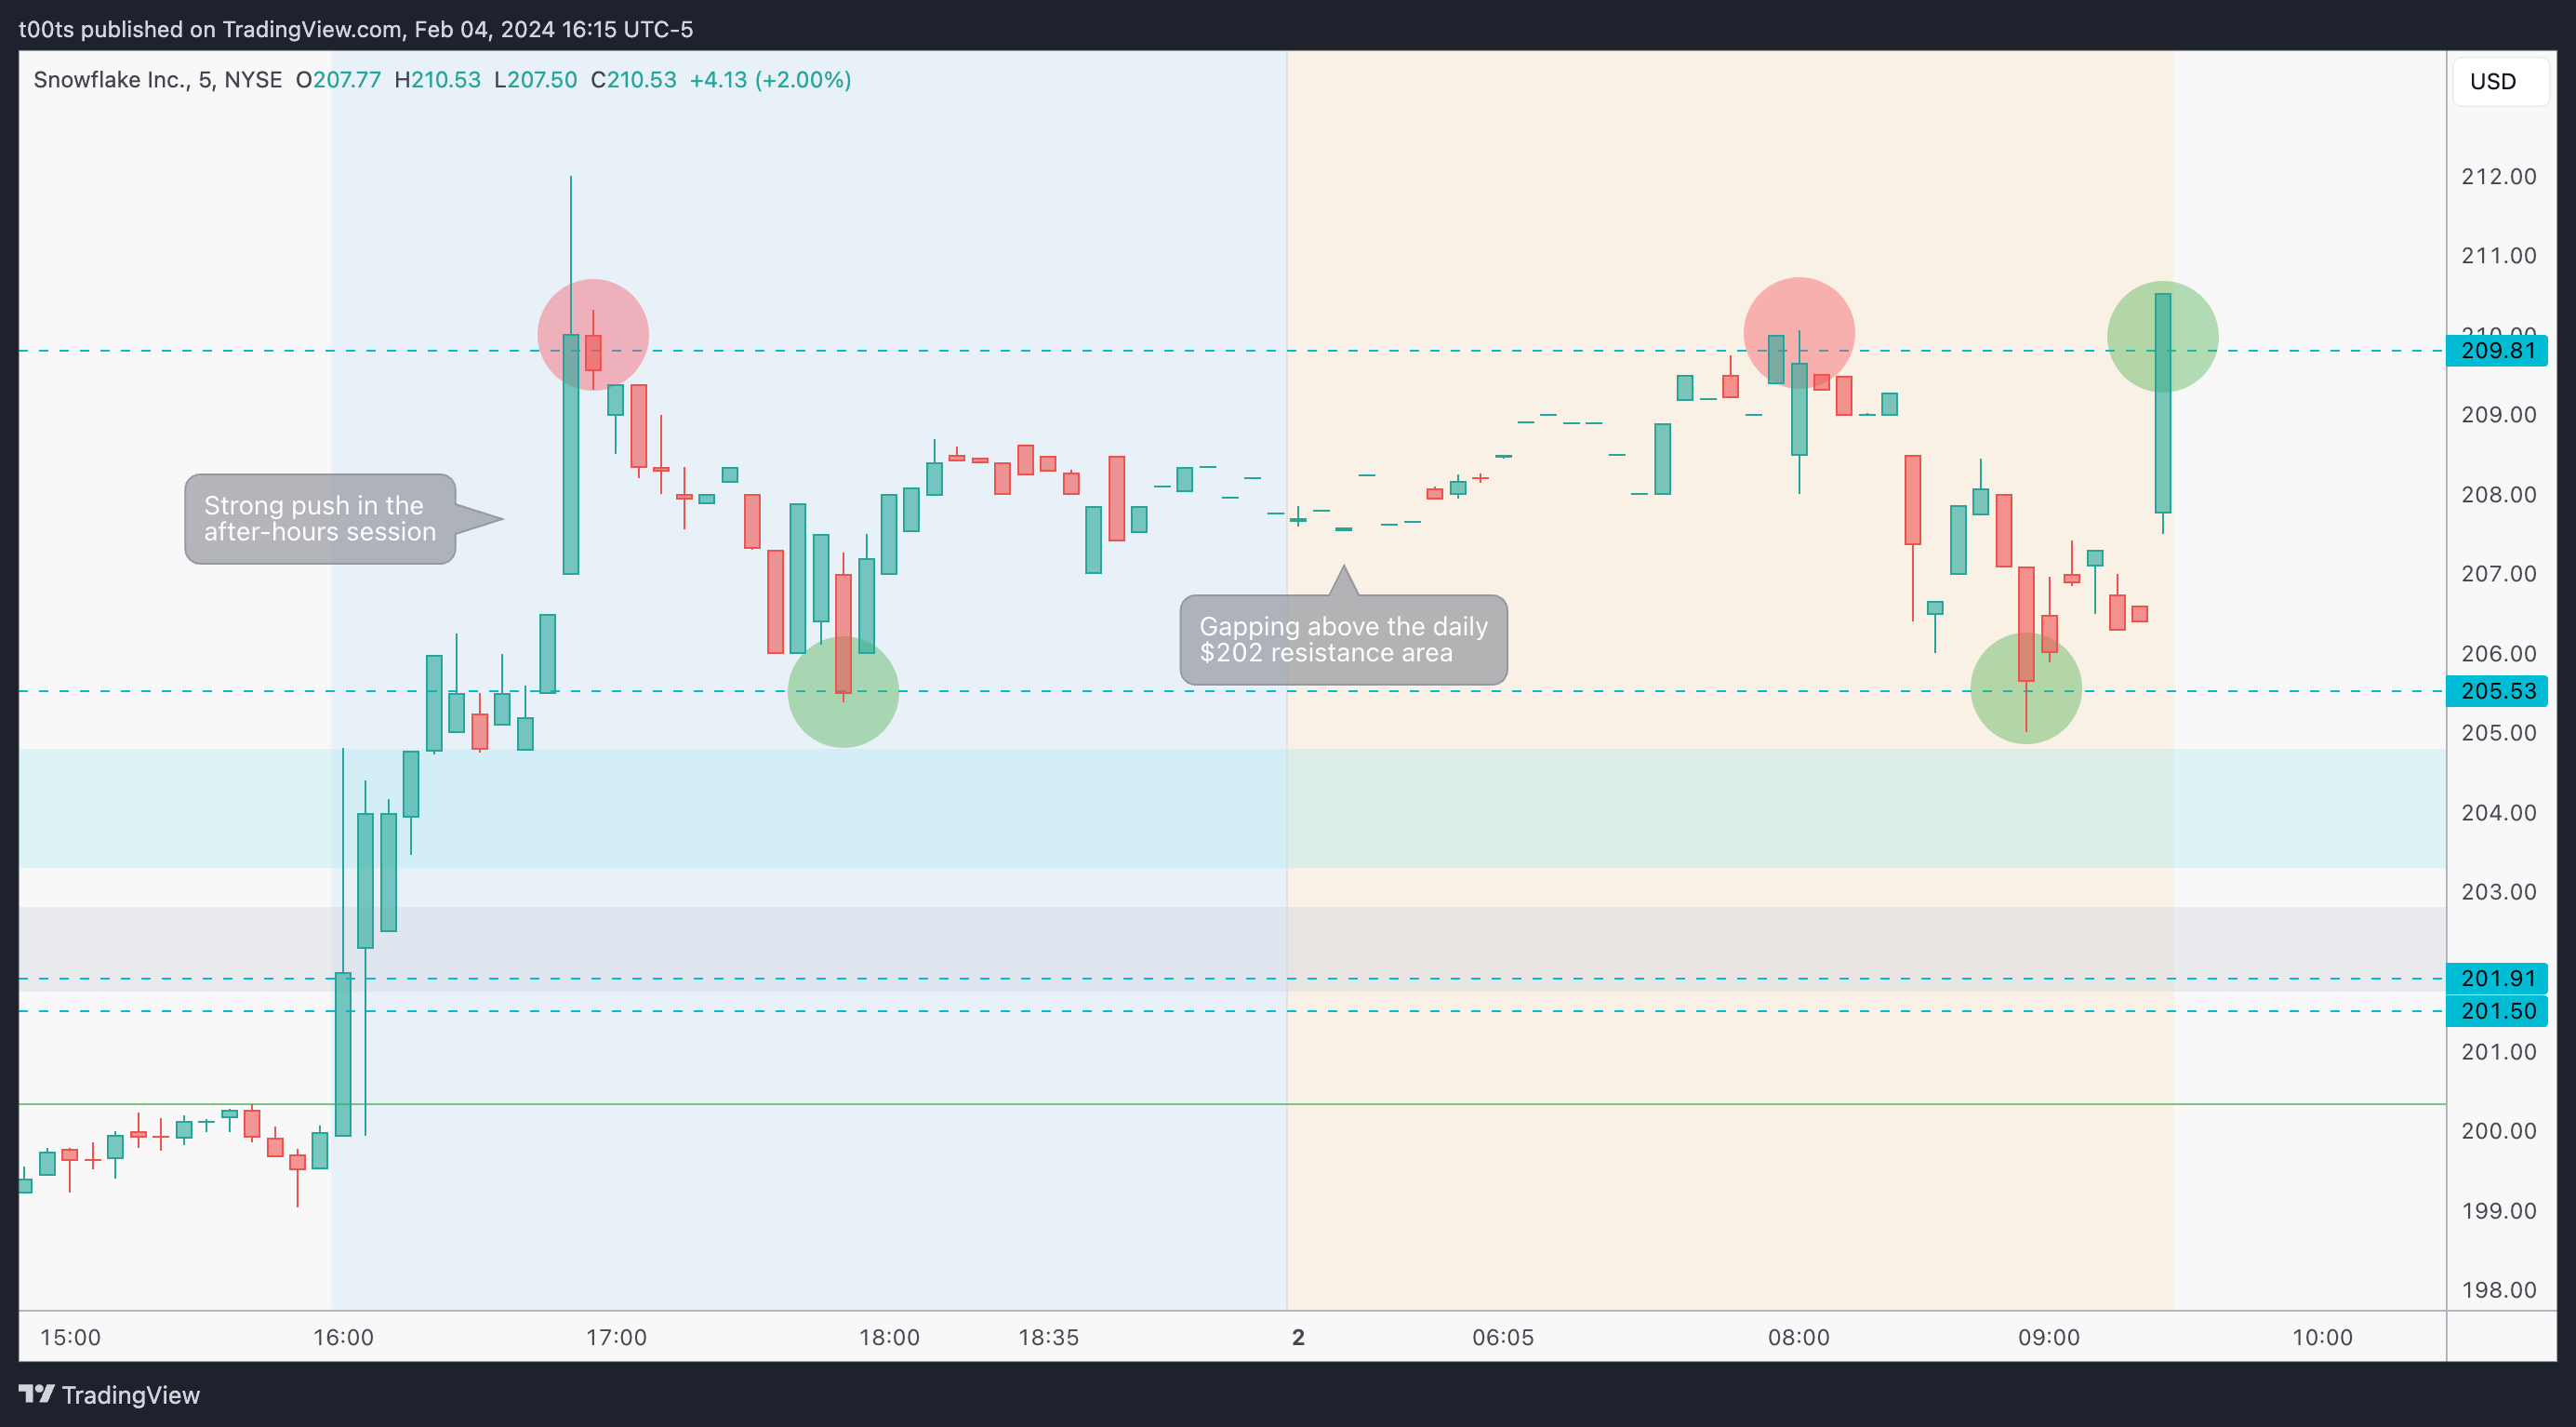
Pre-market action
Note how the stocked pushed above the daily $202 resistance right after the close. This action doesn't go unnoticed, and even if it does, the stock still ends the day above this big resistance area, so traders have enough time to notice even during the following morning prep.
It becomes even more obvious when price holds between the $205.53 and $209.81 levels during the pre-market session. Anyone with this stock in their watchlist scanning for gaps will see it pop up.
The trade
The last trade of the pre-market session takes place above the $209.81, which leads us to consider our opening drive playbook. However, it never triggers, and price instead bounces between the two levels that marked the pre-market range until we get a breakout and the actual trade sets up. Let's dive in.
Using our CPT Framework:
Cue(s)
Strong pop in the after-hours session above key daily resistance area
Price holds the gap into the open
Intraday cue: Lower bound of pre-market range holds the open
Intraday cue: Intraday higher low sets up breakout of higher bound of range
Intraday cue: The strong $209.81 acts as support twice, creating a buy setup
Plan
Take the buy setup off the $209.81, risking the level and targeting the two levels above.
Trigger(s)
Price trading above the buy setup signal bar
5m chart
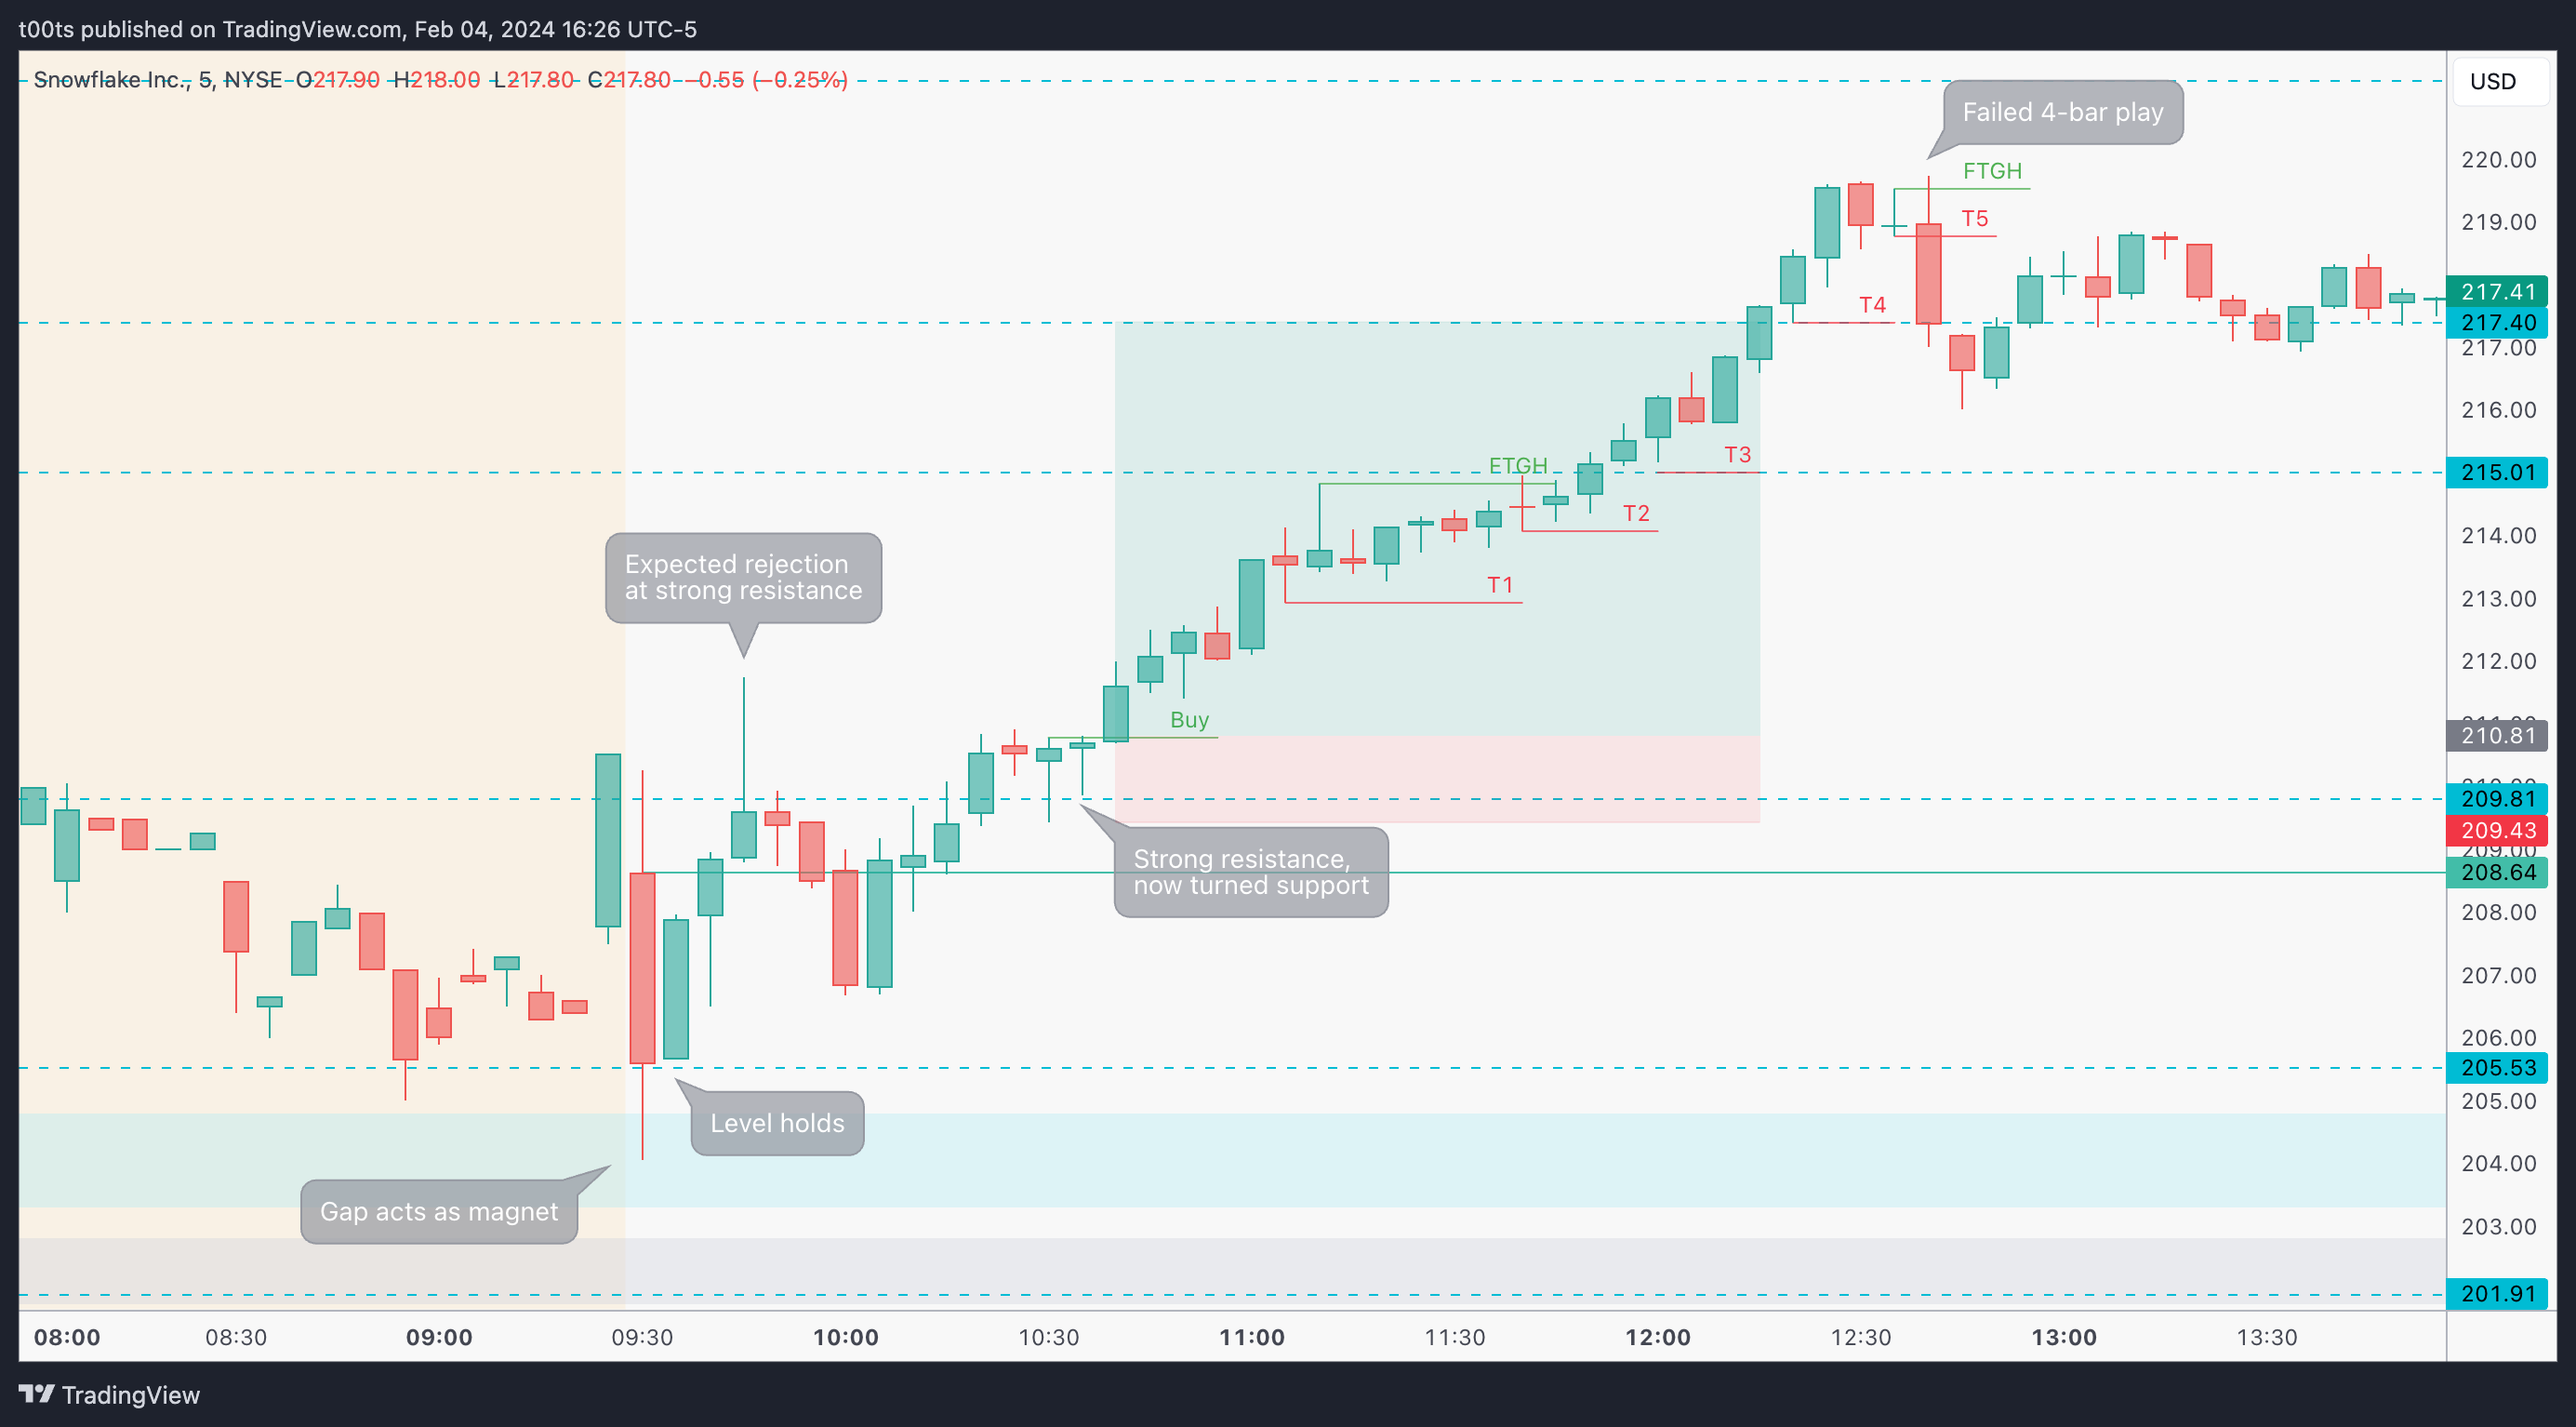
First thing we see is that price actually opens up below the level despite that last trade of the pre-market session happening above. This immediately invalidates the opening drive playbook we might have considered, and warns us that the liquidity on this name might be scarce.
We maintain our interest as we see the lower bound of the range holding, and price bouncing back up strong.
I wouldn't blame you if you went long there. I probably would as well. I've noticed I only do well with bounces when they happen very close to the bell. 5 minutes would classify as "very close". When I try to catch bounces past 10am I don't tend to do well.
Price climbs back up into the strong $209.81 level and makes new intraday highs, trapping a lot of traders on that rejection. Luckily, we were aware of the strength of that level and know better than trading a breakout.
In yesterday's post, we jumped into META as soon as the opening print was reclaimed. Why not do the same here? Because we'd be facing a strong resistance $1 away from our entry. The risk-to-reward, even risking the opening print, would not be worth our effort.
Things start to get interesting when price bounces after the 10am shakeout, printing an intraday higher low which leads to the breakout of the $209.81 level. I consider a breakout the moment a trend bar closes above the level.
The following bars show price resting and even retesting the level twice. The second bullish hammer is an inside bar which reinforces the buy setup from the previous bar. Such a clean setup, basing off a strong level is hard to ignore.
Our risk is contained and the setup triggers on the next bar. You experience zero drawdown on this trade as it works immediately in your favour.
T1 is our first trail as the pseudo 3-bar play setup fails. Price holds well and it never gets even close to being triggered.
T2 is our second trail as we fail to go higher very close to our first level. At this point, it doesn't make sense to risk our profits as price could pull back.
As price breaks $215.01, we trail our stop (T3) to the level we want to see hold. Notice there's a small failure right after we trail but we don't move the stop. There's no reason to. We're OK with price pulling back to the level if it needs to.
Our next trail at T4 is once again when price breaks the next level and buyers hold the retest.
The last trail at T5 is set on the second inside bar of a 4-bar play setup which eventually fails and gets us out of our remaining position.
Closing notes
There was a lot going on this day. As we've seen in previous posts, some of the big boys reported strong earnings and the market overall saw notable gains. Many stocks like Snowflake surfed these tailwinds. But these moves are never random. That's why we're always interested in what's going on in the higher timeframes. In this case, we had a very interesting weekly chart coming up to this day, and the strong gap up gave us both the setup and the confidence that there was potential for action.
I am posting one trade writeup every day throughout 2024. I focus on large caps using levels and price action. The subscription is absolutely free and will always be. I will strive to provide value by offering clues and ideas for you to enhance your edge. Let’s grow together!