
NVIDIA (NVDA) - Feb 2nd 2024
NVIDIA emerges as the top gainer amidst earnings reports from tech giants

Higher timeframe context
A few big names reported earnings this week. Most of the conversation revolved around AI. Companies like Microsoft, Meta, or Amazon reinforced their commitment to building in-house compute infrastructure for AI, announcing substantial investment plans that include billions for NVIDIA chips.
Major analysts like Bank of America have recently been issuing new upgrades to the stock, further fuelling this massive rally.
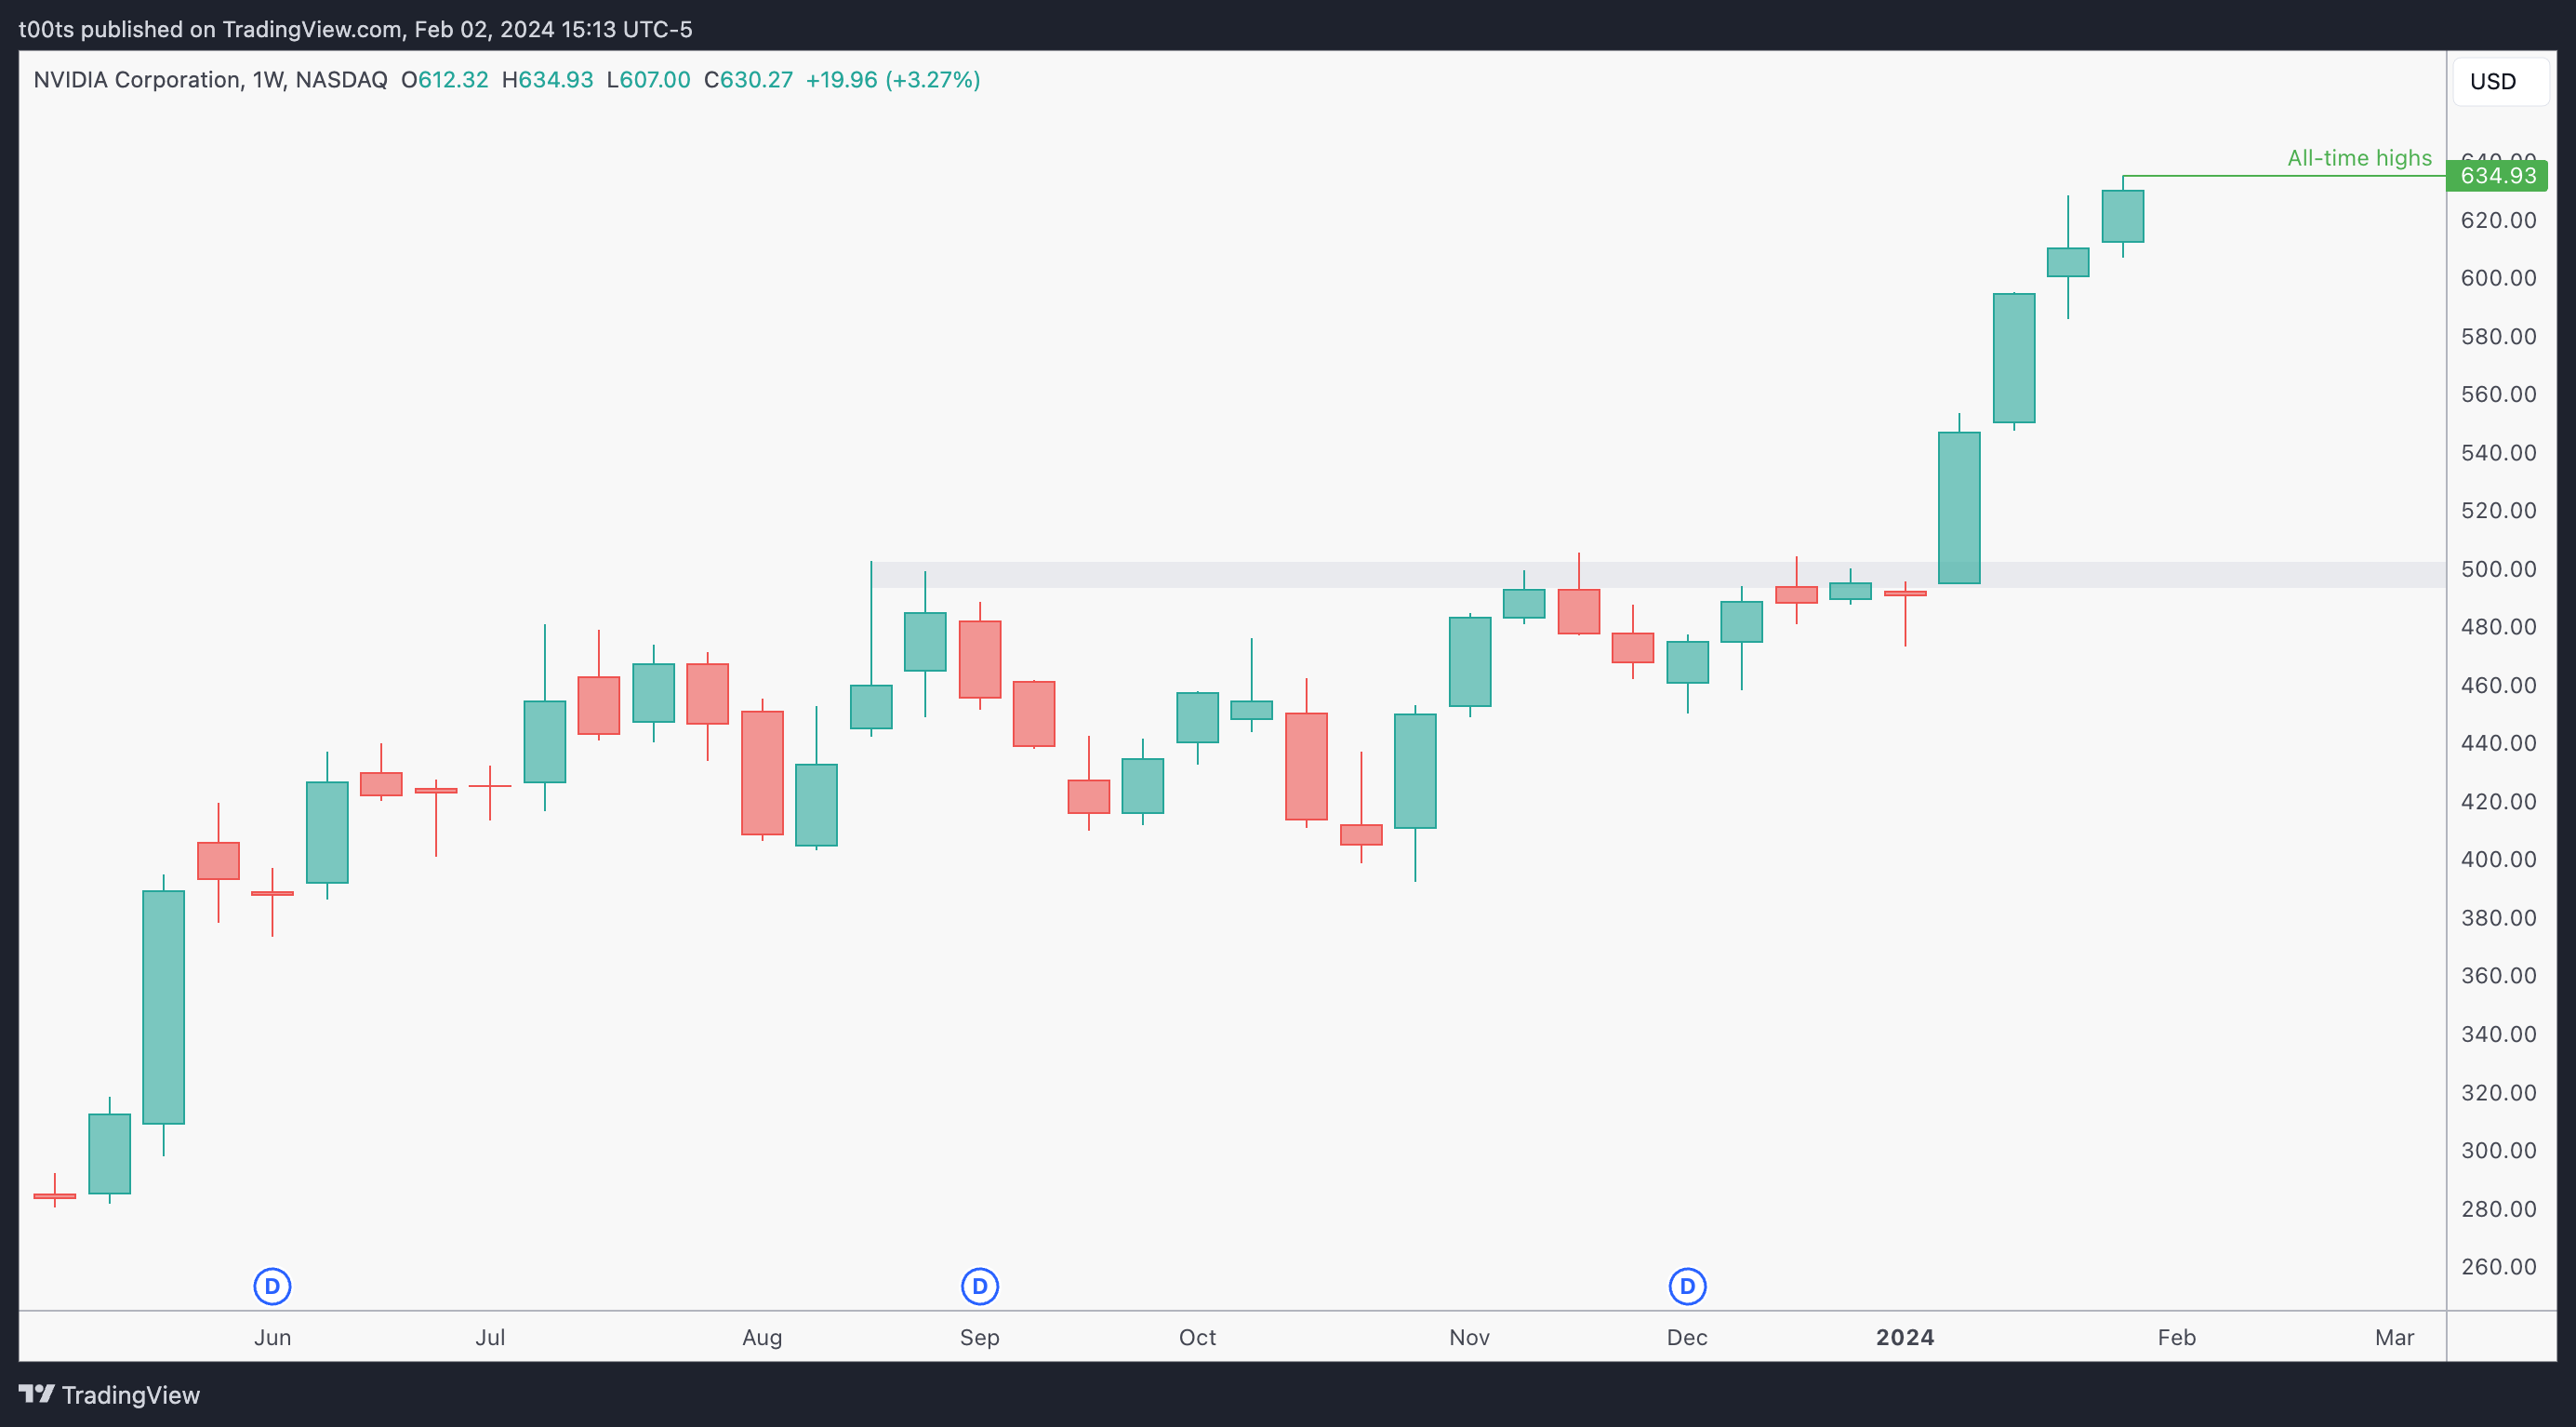
Weekly chart
Not much to highlight on this weekly chart as price action is pretty straightforward to read. The stock has been pushing ever since the $500 area broke out. We never got a retest, showcasing how much momentum this stock has as investors keep piling in.
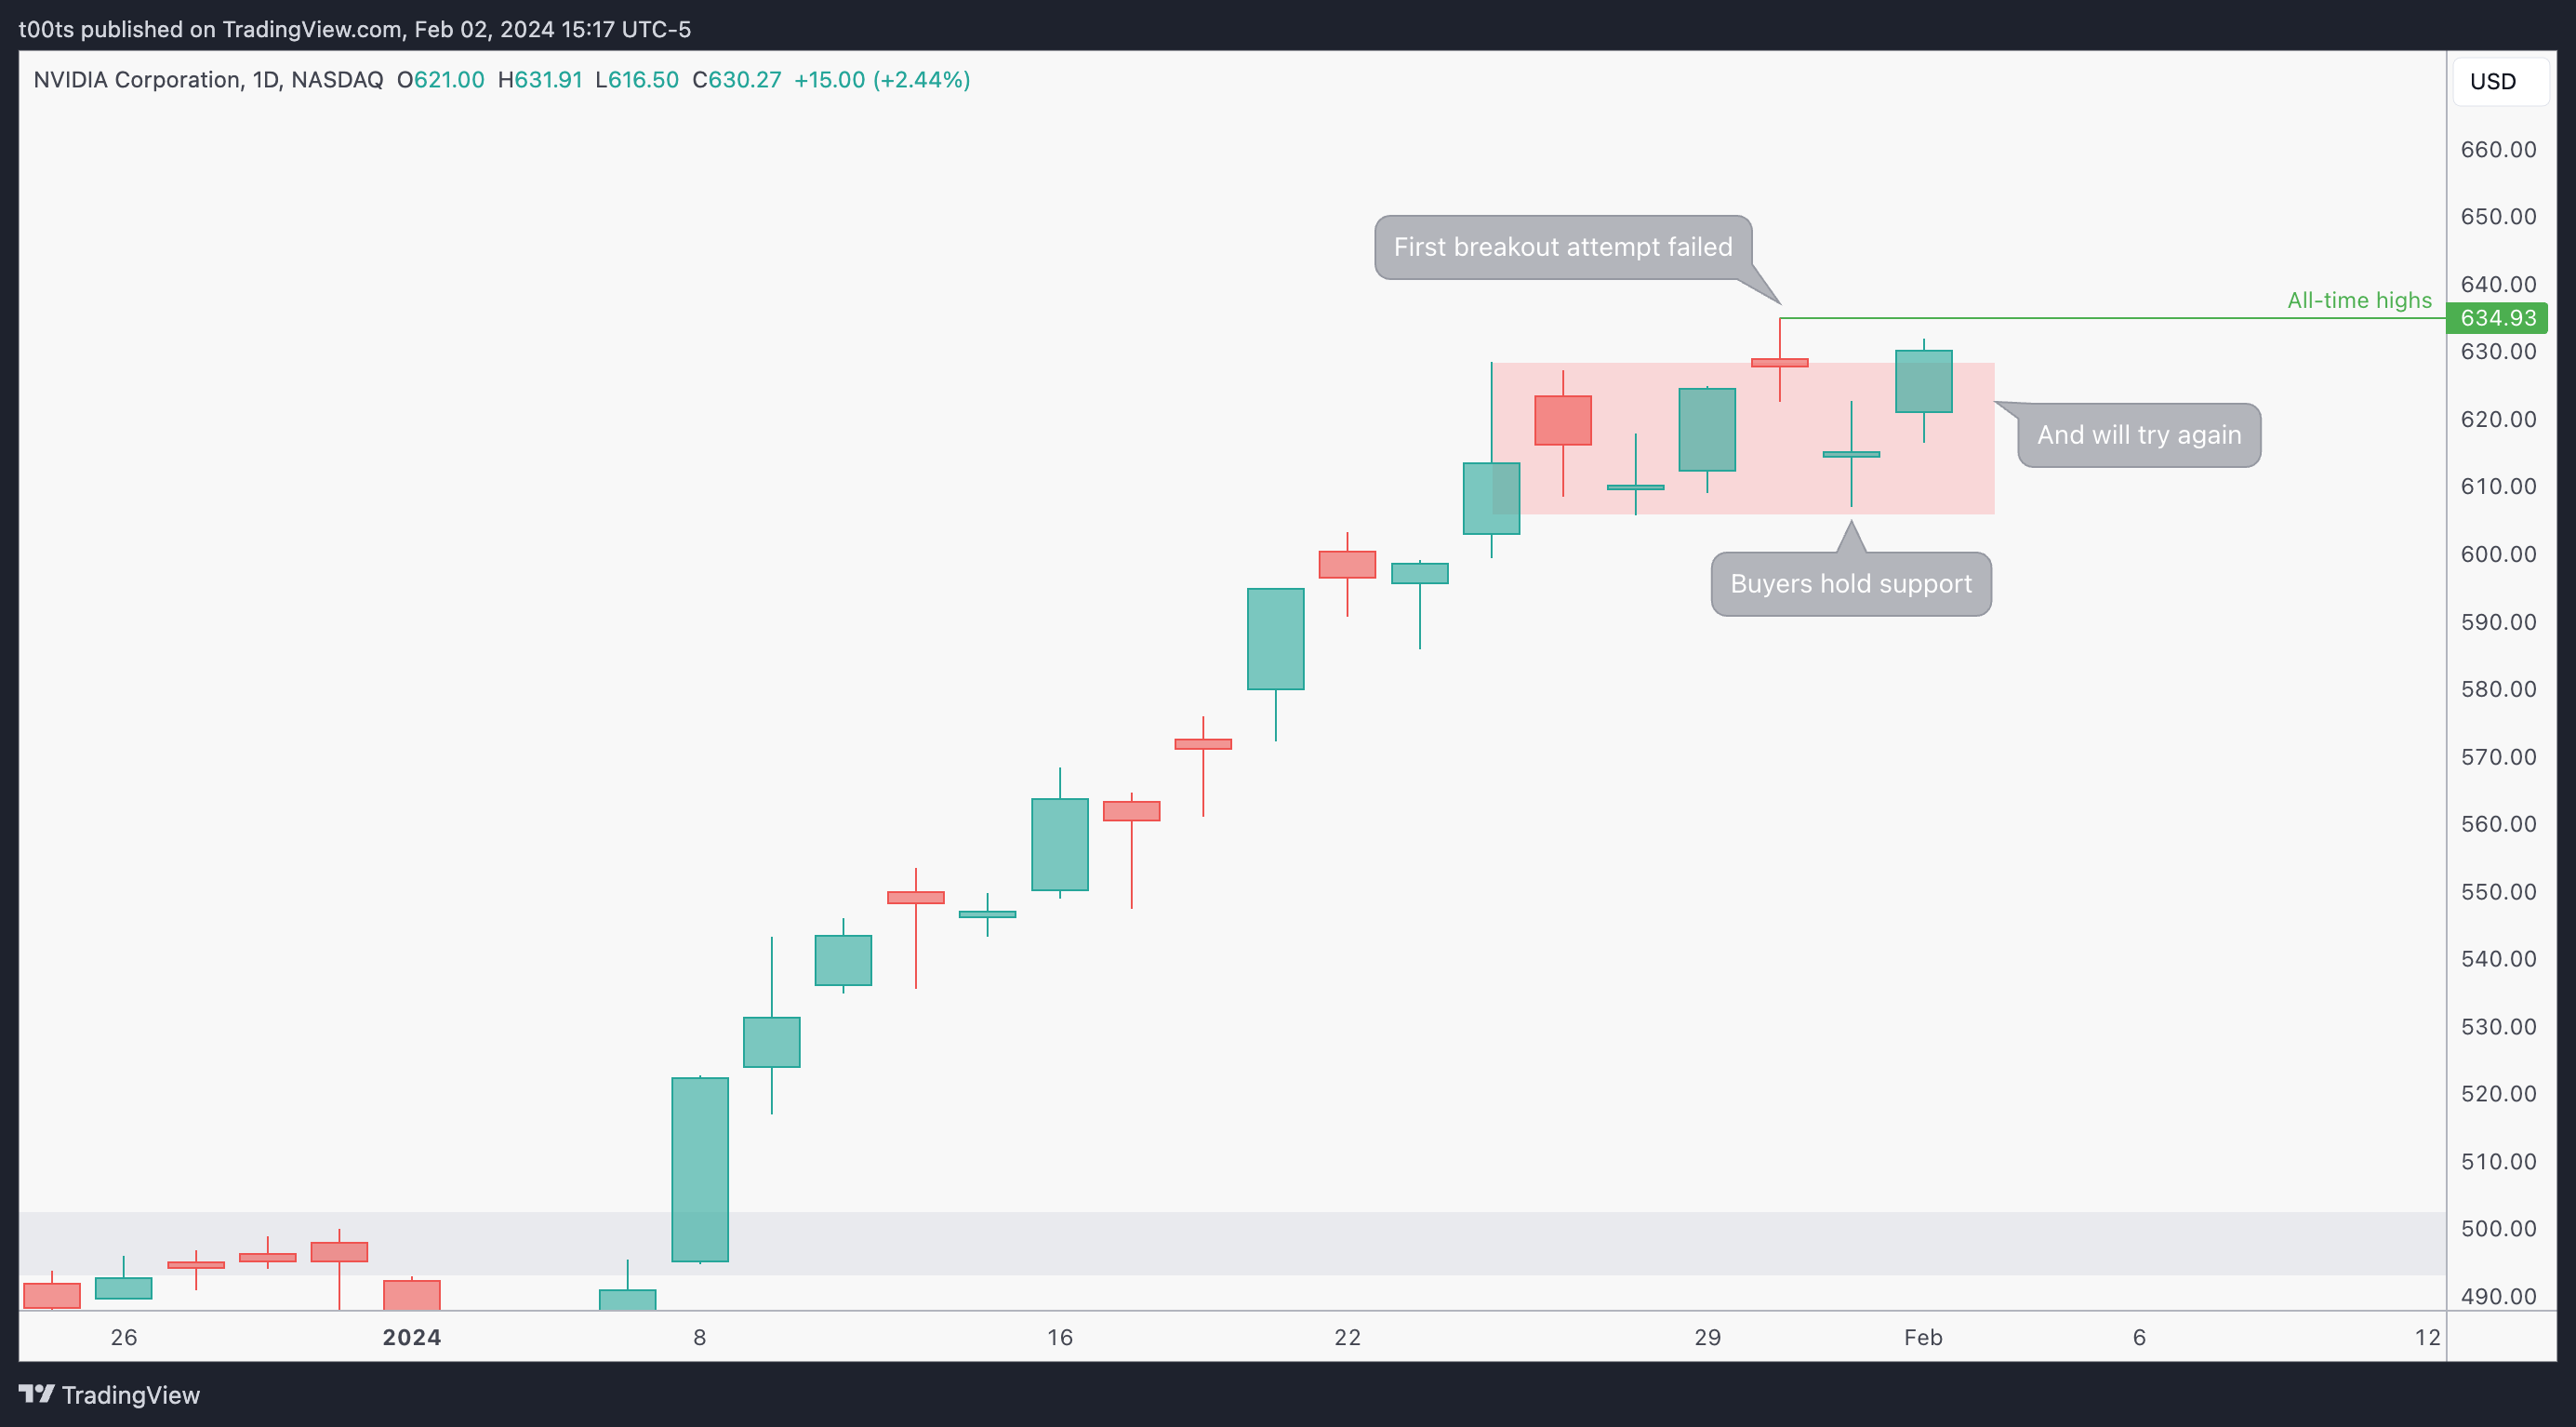
Daily chart
Price has been ranging for the past week. The first breakout attempt failed, but buyers held the line -putting in a higher low- and the stock is back to the top of this small range. All we need is a catalyst now.
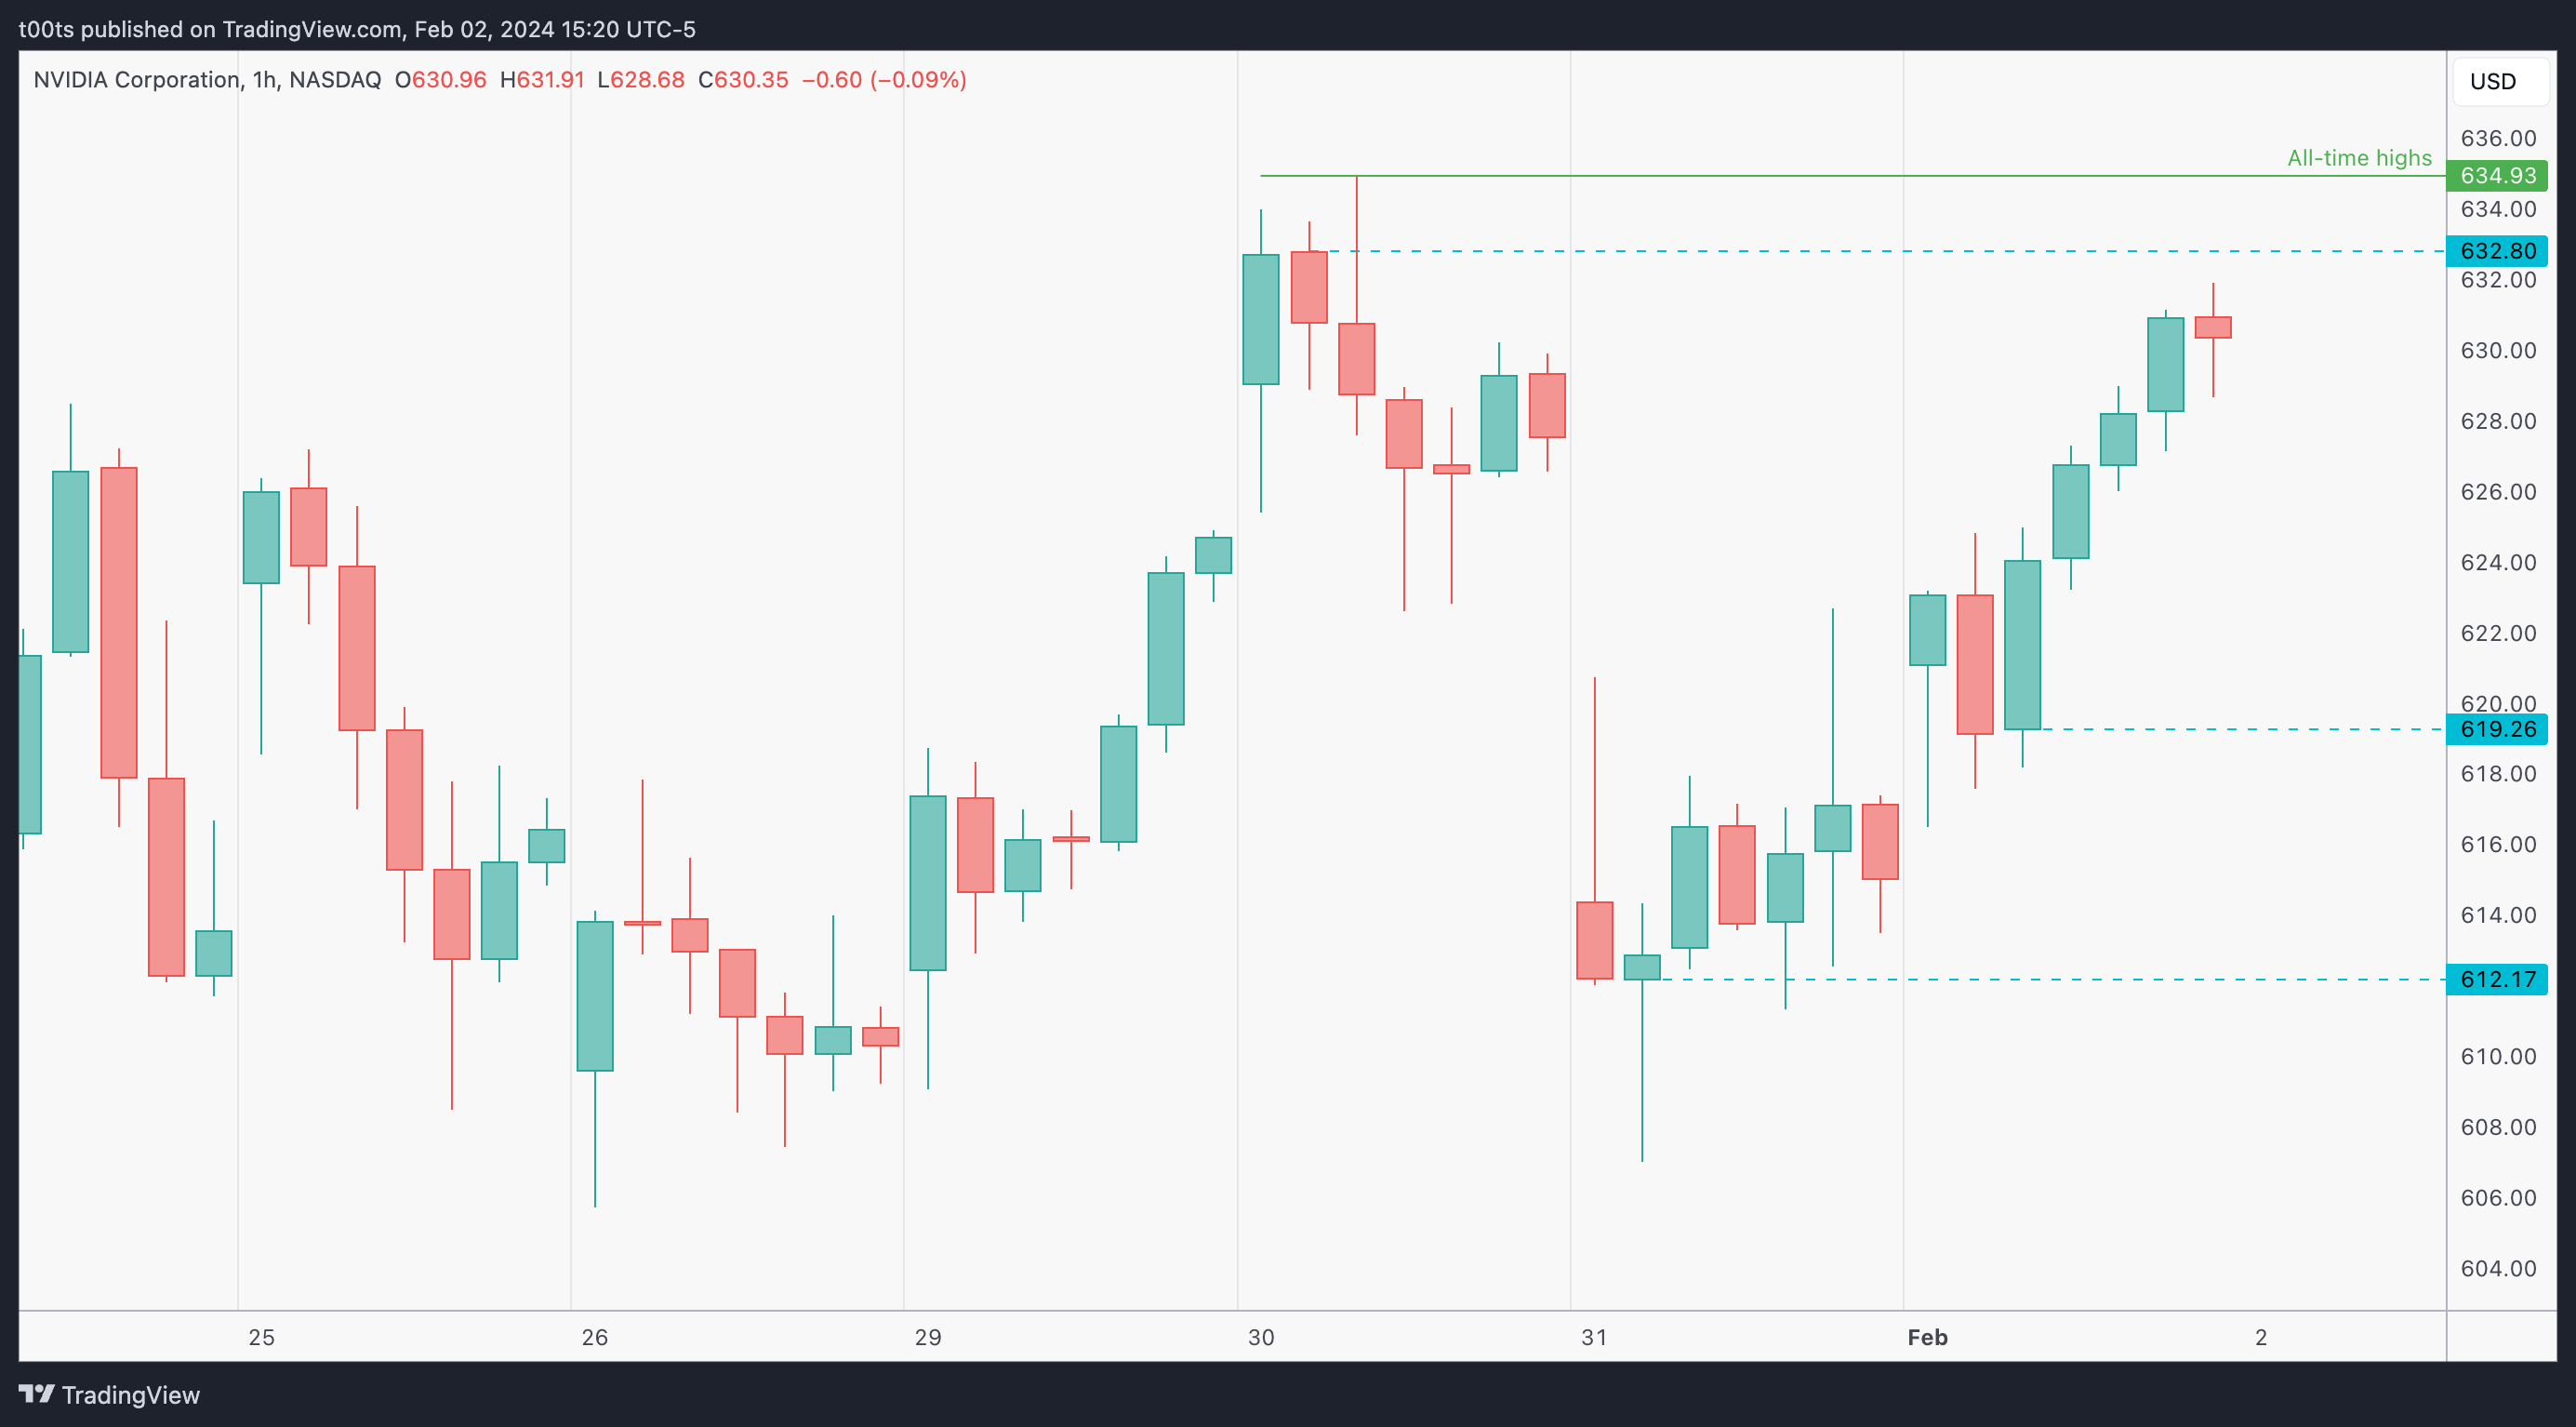
Hourly chart
The hourly chart just confirms the range saw on the daily with better detail. The $632.80 level can become an interesting reference to trade off of if price gaps above it.
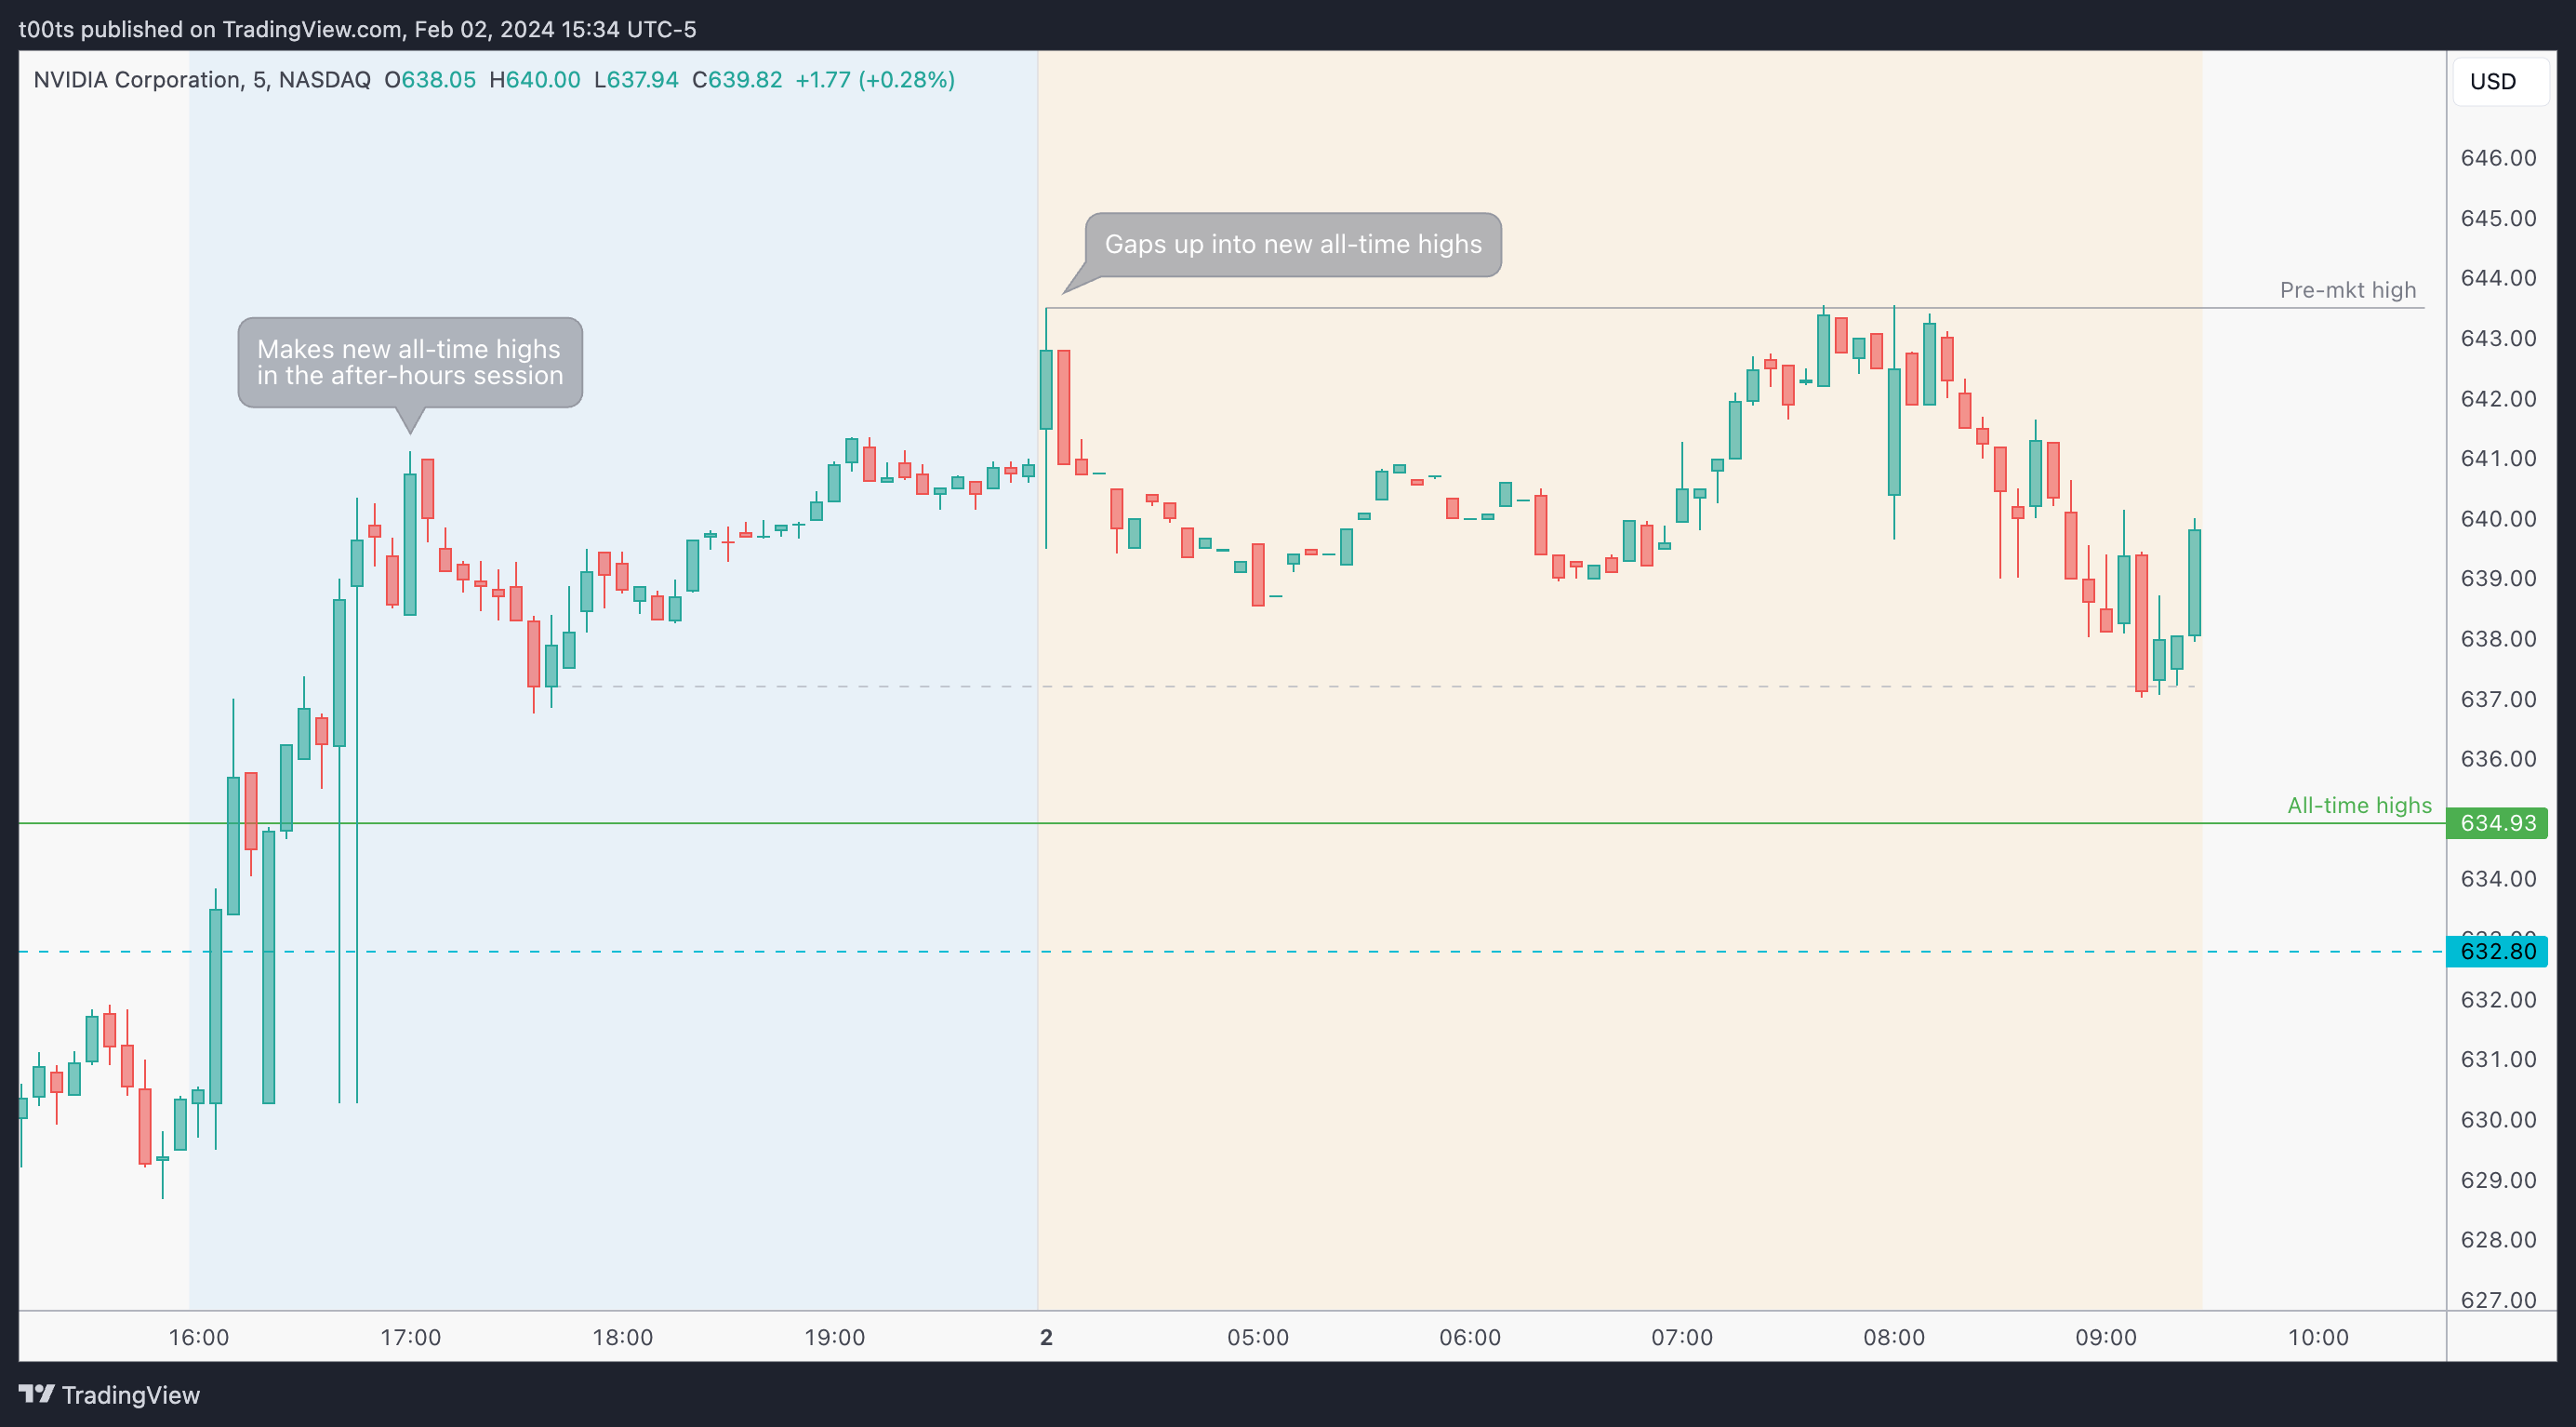
Pre-market action
Here's where things get interesting. Notice how the stock rallies in the after-hours session and makes new all-time highs. Despite other stocks supposedly having most of the attention given their earnings reports, Nvidia is still climbing to new highs on their announcements. Just like we saw with SMCI, when a stock makes a significant move in the after-hours session it's likely to be in many traders watchlists the following day.
Judging by how well the gap up held during the pre-market, this stock has a high chance of moving higher. Price trends down the last hour before the bell, but it's set to open with a potential trend flip as the 9:25 5-minute bar closes above the previous lower high pivot.
The trade
We've talked a lot about the magnetic power of round numbers. The stock is set to open around $640. The first thing that comes to mind is that it'll probably trade $650 sooner than later. We want to see strength near the open and use our opening print to risk against.
Using our CPT Framework:
Cue(s)
Market leading stock in strongest sector
Holding after-hours gap into new all-time highs
Positive news catalyst
Intraday cue: Buyers step in at pre-market lows
Plan
As we have no levels nearby, our plan is to use the opening print as our level of reference. Ideally we'd like to see a small drop just to gauge if buyers are still there. From there, we'd want to see a reclaim of the opening print and go long targeting the $650.
If the initial drop is too pronounced, our risk-to-reward might not be favorable when risking those initial lows, so we might want to look for a smaller timeframe higher low or a bullish momentum pattern to get involved.
Trigger(s)
Price reclaiming the opening print.
5m chart
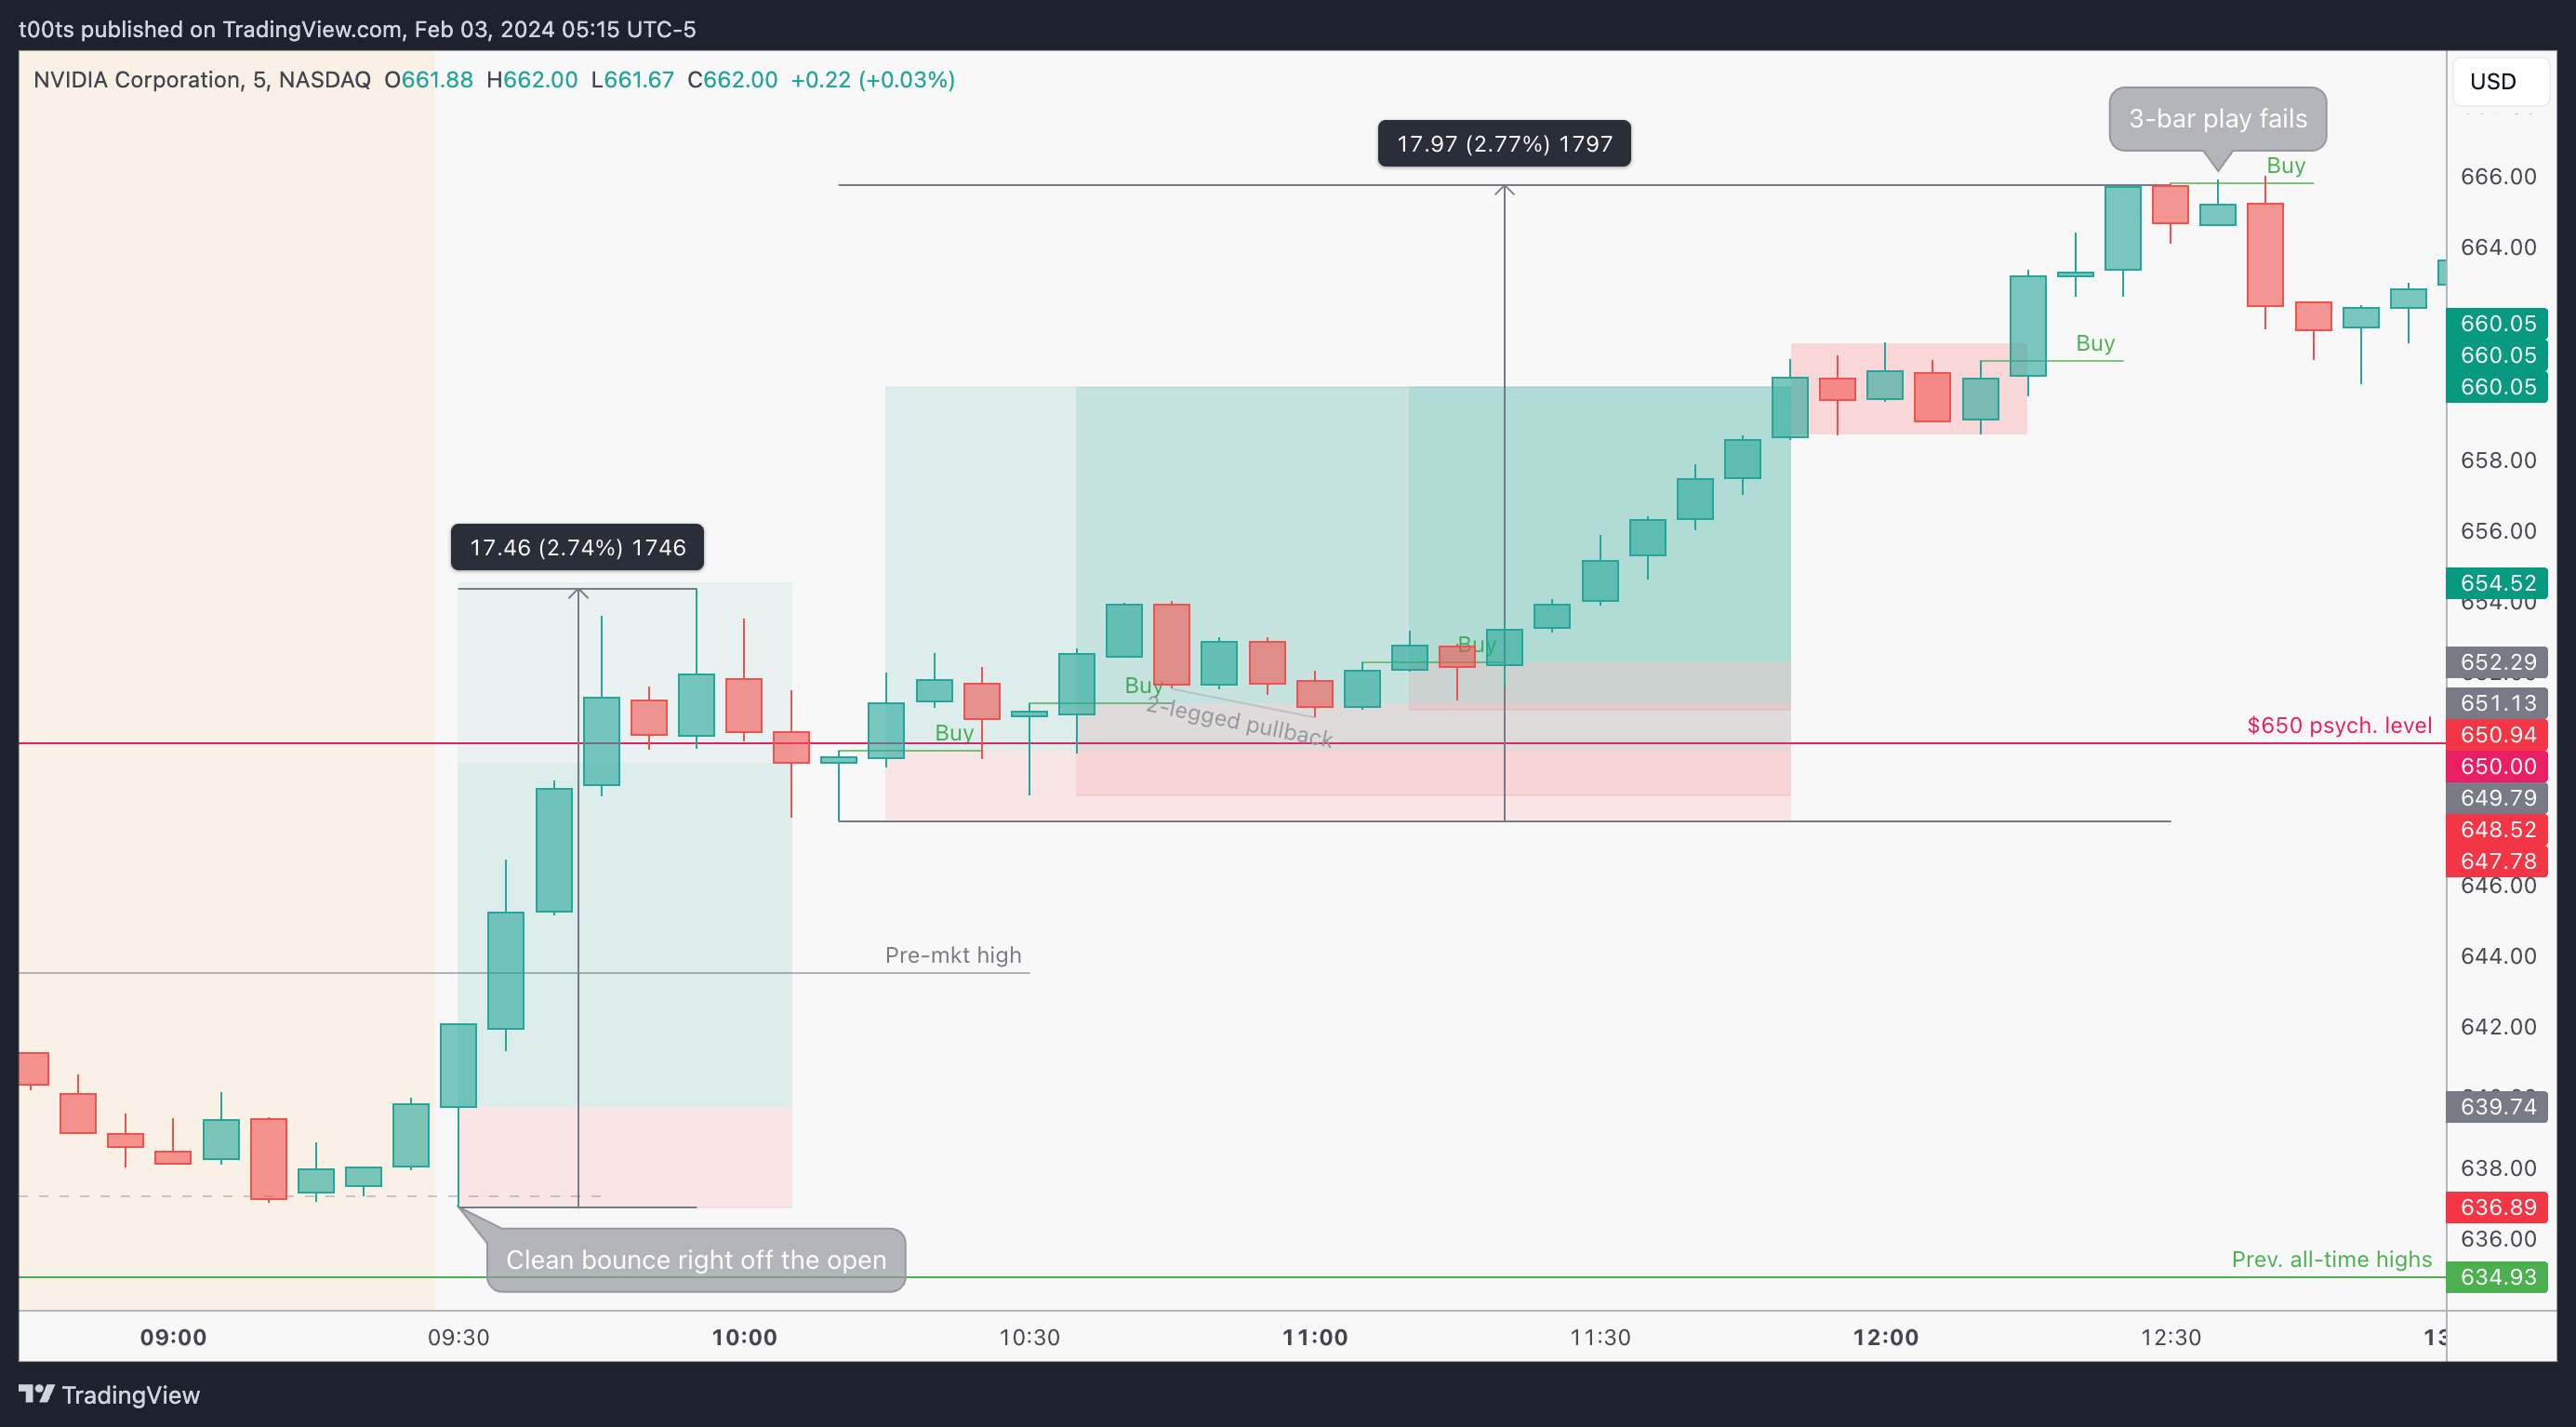
There's a lot going on in this chart, let's take a look.
First off, we get a quick pre-market low retest right off the open and price bounces back up reclaiming the opening print. Targeting the $650 psych. level and risking those lows we'd be looking at a 3.6R trade. We'll take that every time.
The $650 target hits quickly, but there's no reason to sell until price loses it after failing to move higher twice. With options, after a strong move like that initial push it's always interesting to scale out into strength as premiums are jacked up, but you can never go wrong holding a core until there's an actual reason to sell.
After the initial trade we can either succumb to the excitement from our profits, or remain concentrated in the chart in front of us as it climbs to new highs.
There were several buy setups to take on this consolidation before the next leg up. They offered between 3R and 5R. Again, worth taking. I used $660 as target to be conservative. There was really no reason to sell but as we know those round numbers often act as levels, especially when a stock is in price discovery mode.
Notice how each of the two legs measures around 17pts from the lows to the highs.
I'm not going to sit here and say you could've caught the whole second move by using the measuring tool, but I thought it was worth highlighting.
The trend ends when the 3-bar play (or 4-bar play) fails at the top right of the chart.
Closing notes
Many keep asking themselves how far can this go. That's their FOMO speaking. If you're among this group of people, let go, it's not worth it. I've been missing out on the whole Meta rally because of my ego and biases.
NVIDIA is currently positioned to dominate the AI infrastructure market. The trend is up, and it's strong. Ride it. Find trades and execute. Forget what you've missed and stop trying to guess the future. Market doesn't care, and neither should you.
I am posting one trade writeup every day throughout 2024. I focus on large caps using levels and price action. The subscription is absolutely free and will always be. I will strive to provide value by offering clues and ideas for you to enhance your edge. Let’s grow together!