

Higher timeframe context
Chinese stocks suffered a pretty dramatic downturn after the post-covid bull run. Chinese government crackdown on technology companies was probably the most prominent factor for the case that concerns us with Alibaba.com, but let’s not forget other notable events such as the Evergrande debt crisis and the overall geopolitical tensions in trade relations with the United States.
Those who were trading at the time might even remember that Jack Ma, Alibaba's CEO went missing around November 2020, just when he was about to become the richest man in China. All these factors forecasted an uncomfortable outlook for investors in the Chinese market, and tech stocks in particular.
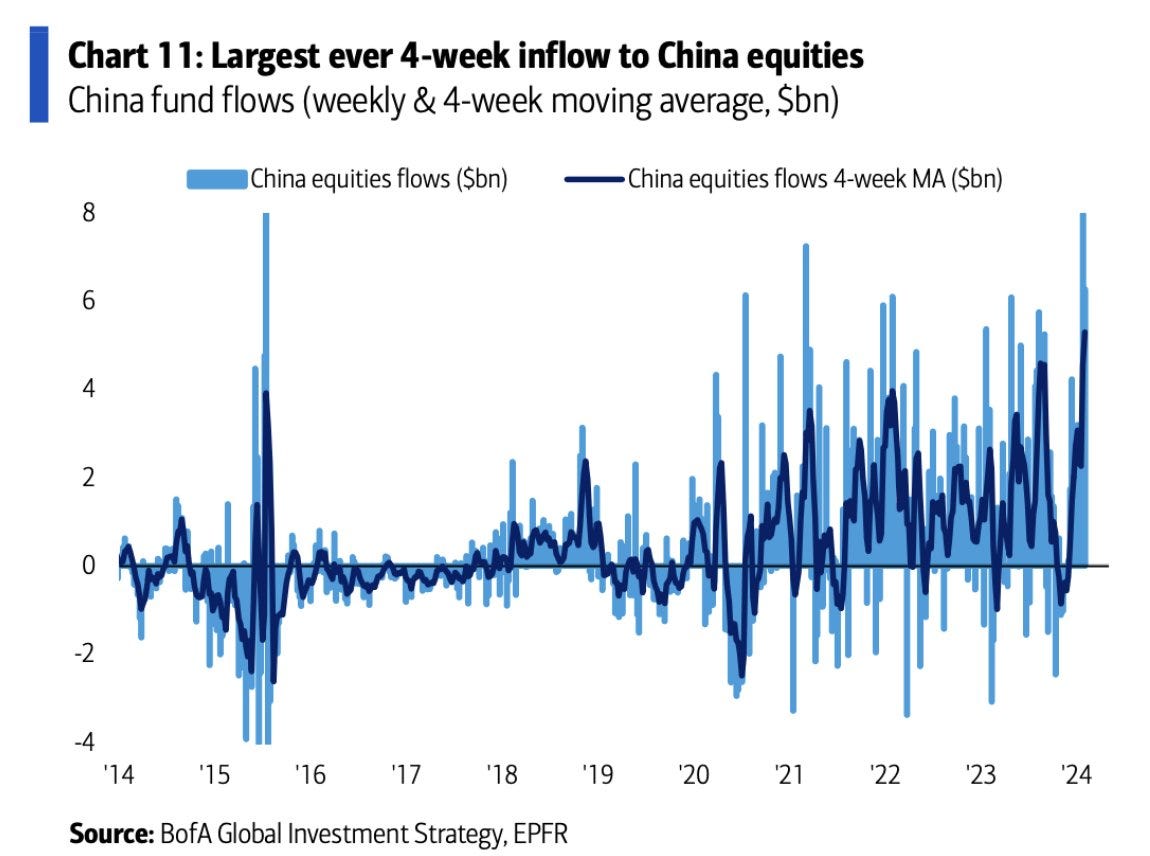
On February 4th, the following chart started circulating on 𝕏. Bank of America reporting the largest ever China stock inflows in a 4-week period, slightly above $20 billion. This is a powerful statement, which would obviously bring BABA and other Chinese names to many traders watchlists.
Weekly chart
Not much to highlight on this weekly chart besides the obvious crash from the highs. BABA is still down a whopping 77% from its all-time highs. We've gone through stocks that have been down just as much and are making new all-time highs, yet BABA can't seem to gain traction to the upside.
Notice how during the 2022 bear market it didn't suffer as much as most US stocks we've looked at, as it already experienced a notable drop during 2021. Stock has been essentially flat for two years, as every time it seemed to catch a bit of momentum it lacked followed through. Is this a huge accumulation? Feels weird that despite that immense capital inflow there's not much price movement yet...

Daily chart
Price has flipped the trend on the daily after a notable gap up and appears to be flagging, getting ready for a potential continuation move up. That failure to go lower on that last bar right before the news is an interesting cue as well for us to prepare a trade. If the stock can trend above that last days high we have potential to break out of this flag and get a nice move up.

Hourly chart
Things are getting even more interesting as we pull up the hourly chart and plot a few levels. Notice how much room to the upside if we can get above the $72.33 level and trend. It's also very convenient how that level is really close to our daily buy area. More cues to bring this name to our watch.
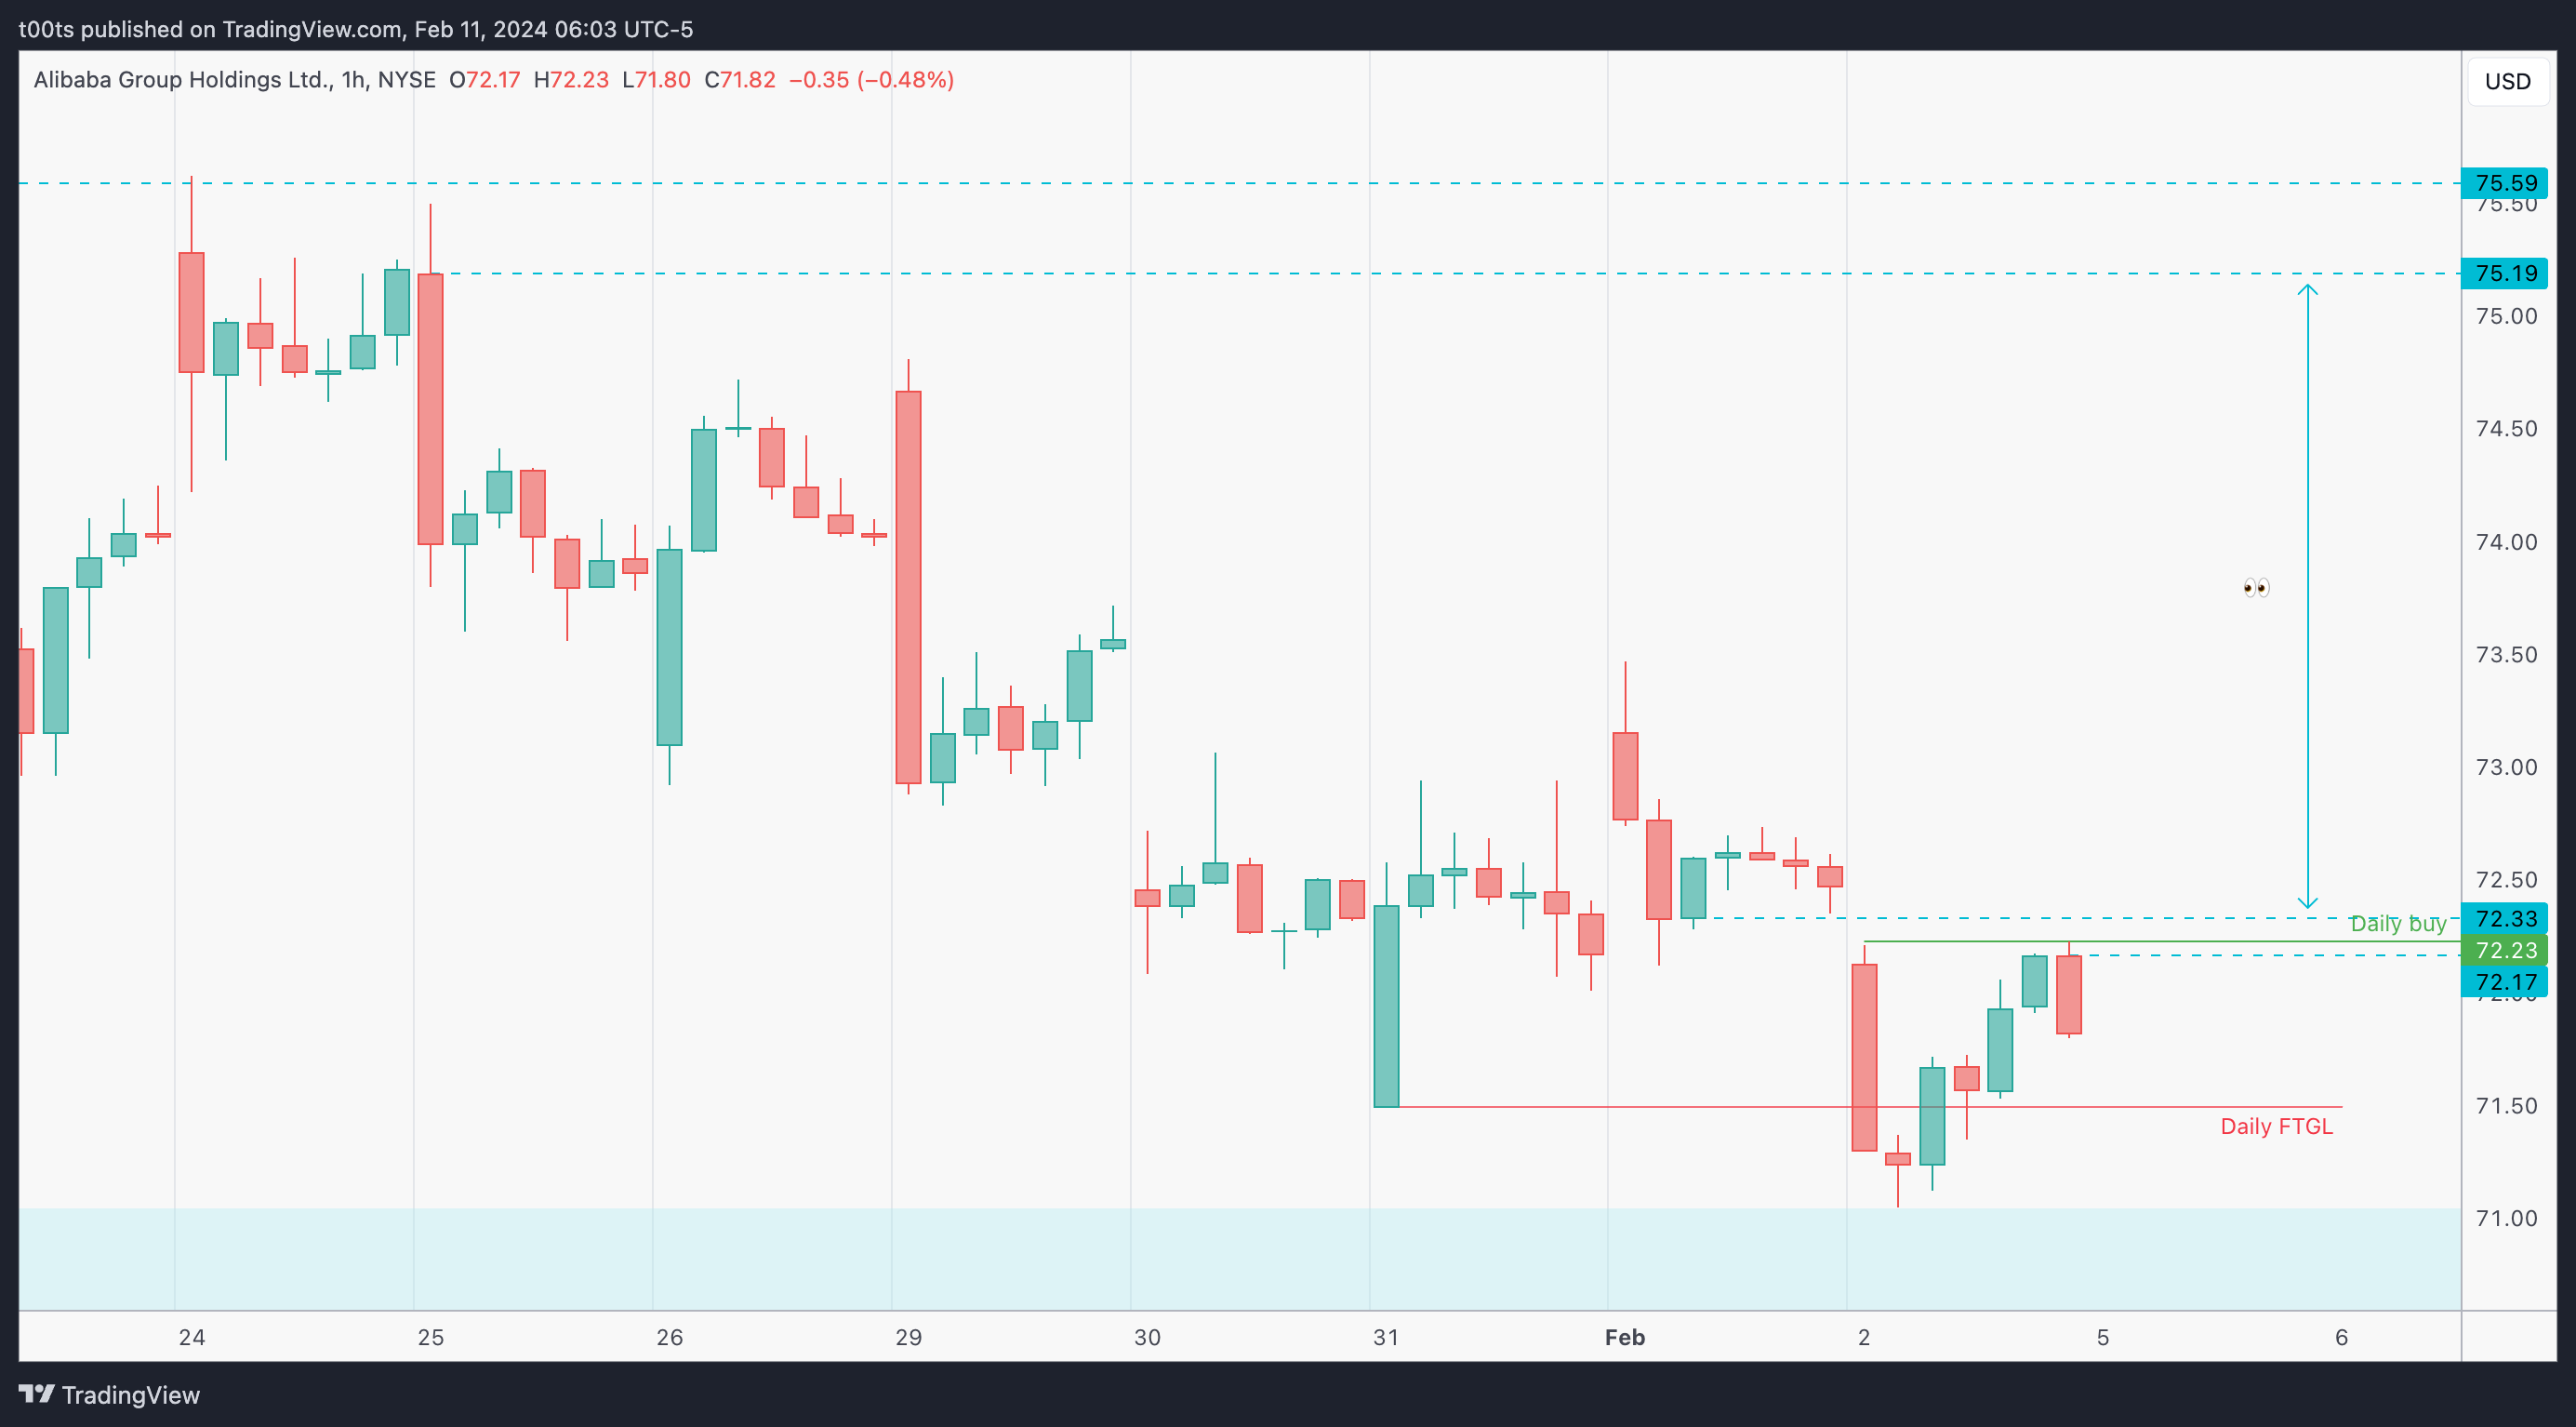
Pre-market action
This is not the greatest pre-market action but it is really setting us up for a very favourable opening drive play as the stock is set to open right at our $72.17 level, which is our lowest level in that confluence area we'd be looking to get involved in. Despite that downturn an hour into the bell, just like with TSLA, we now have better risk-to-reward potential.

The trade
Back to our CPT Framework:
Cue(s)
Daily chart structure is potentially setting up for a move higher
Failure to go lower on the daily
Relevant news catalyst circulating
Stock set to open at our level of interest
Intraday cue: Strong bounce at the $72 area
Plan
Honestly, the plan is to get involved as soon as possible in case we just shoot up from the level that's already holding in the pre-market. The way I'd quantify this to fit our system is to jump in as soon as we trade above this 9:25 bar high. Because we have a few levels of interest in this area, the plan is to split the position in 3 chunks that we can add as each level breaks, assuming this will be an opening drive play. $72 area seems a good level to place our stops.
Trigger(s)
Price trading above 9:25 bar high
Price trading above daily buy ($72.23)
Price trading above $72.33
Intraday lower high at $72.33
2m chart (entry detail)
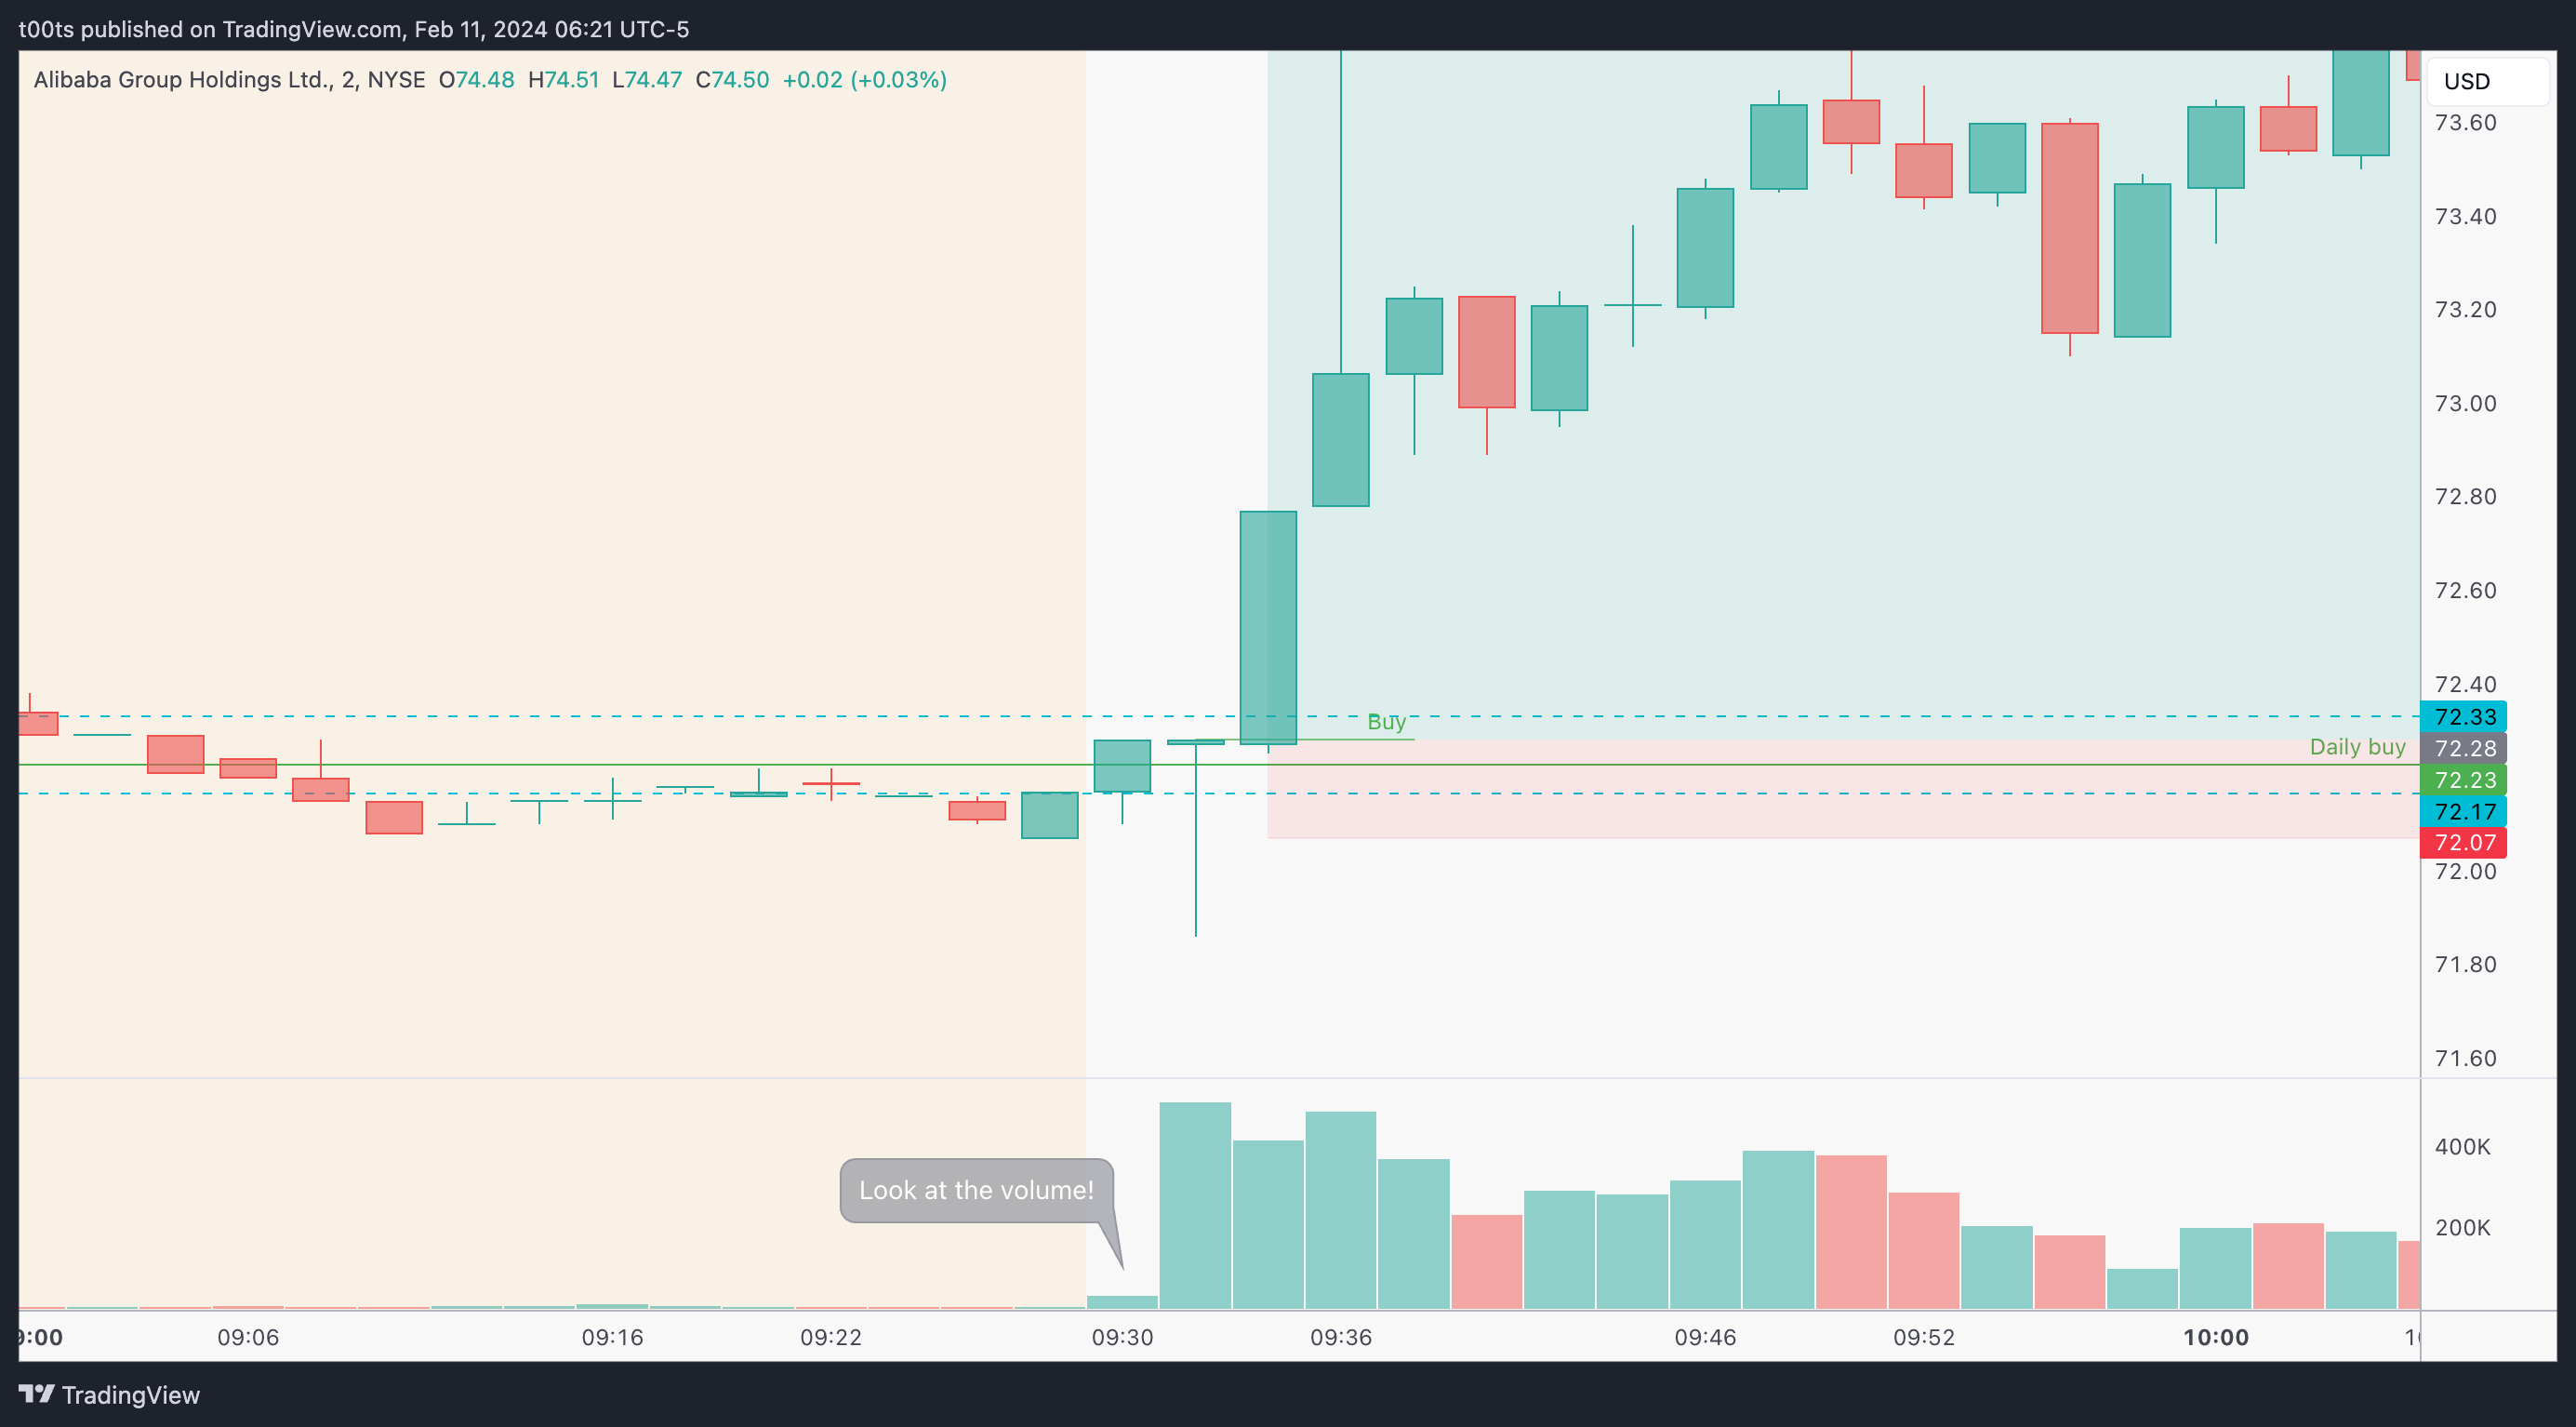
Although the trade triggers right off the open, if you were watching this in real-time you'd notice that there was literally nothing going on. And I mean nothing. The stock was just sitting there for two minutes. It was weird, it really didn't invite you to get in. Look at the volume on that first 2m bar and you'll see what I mean.
The moment we get a quick flush below $72 you could immediately see the tape accelerating and size coming in. And here's where all the conditions start aligning. We get a very strong bounce back above the opening print and the daily buy, allowing us to get in more comfortably as we can see buyers are present and bidding with size.
Our risk is tight because we can use the $72.17 level that held twice in the pre-market as our stop.
5m chart
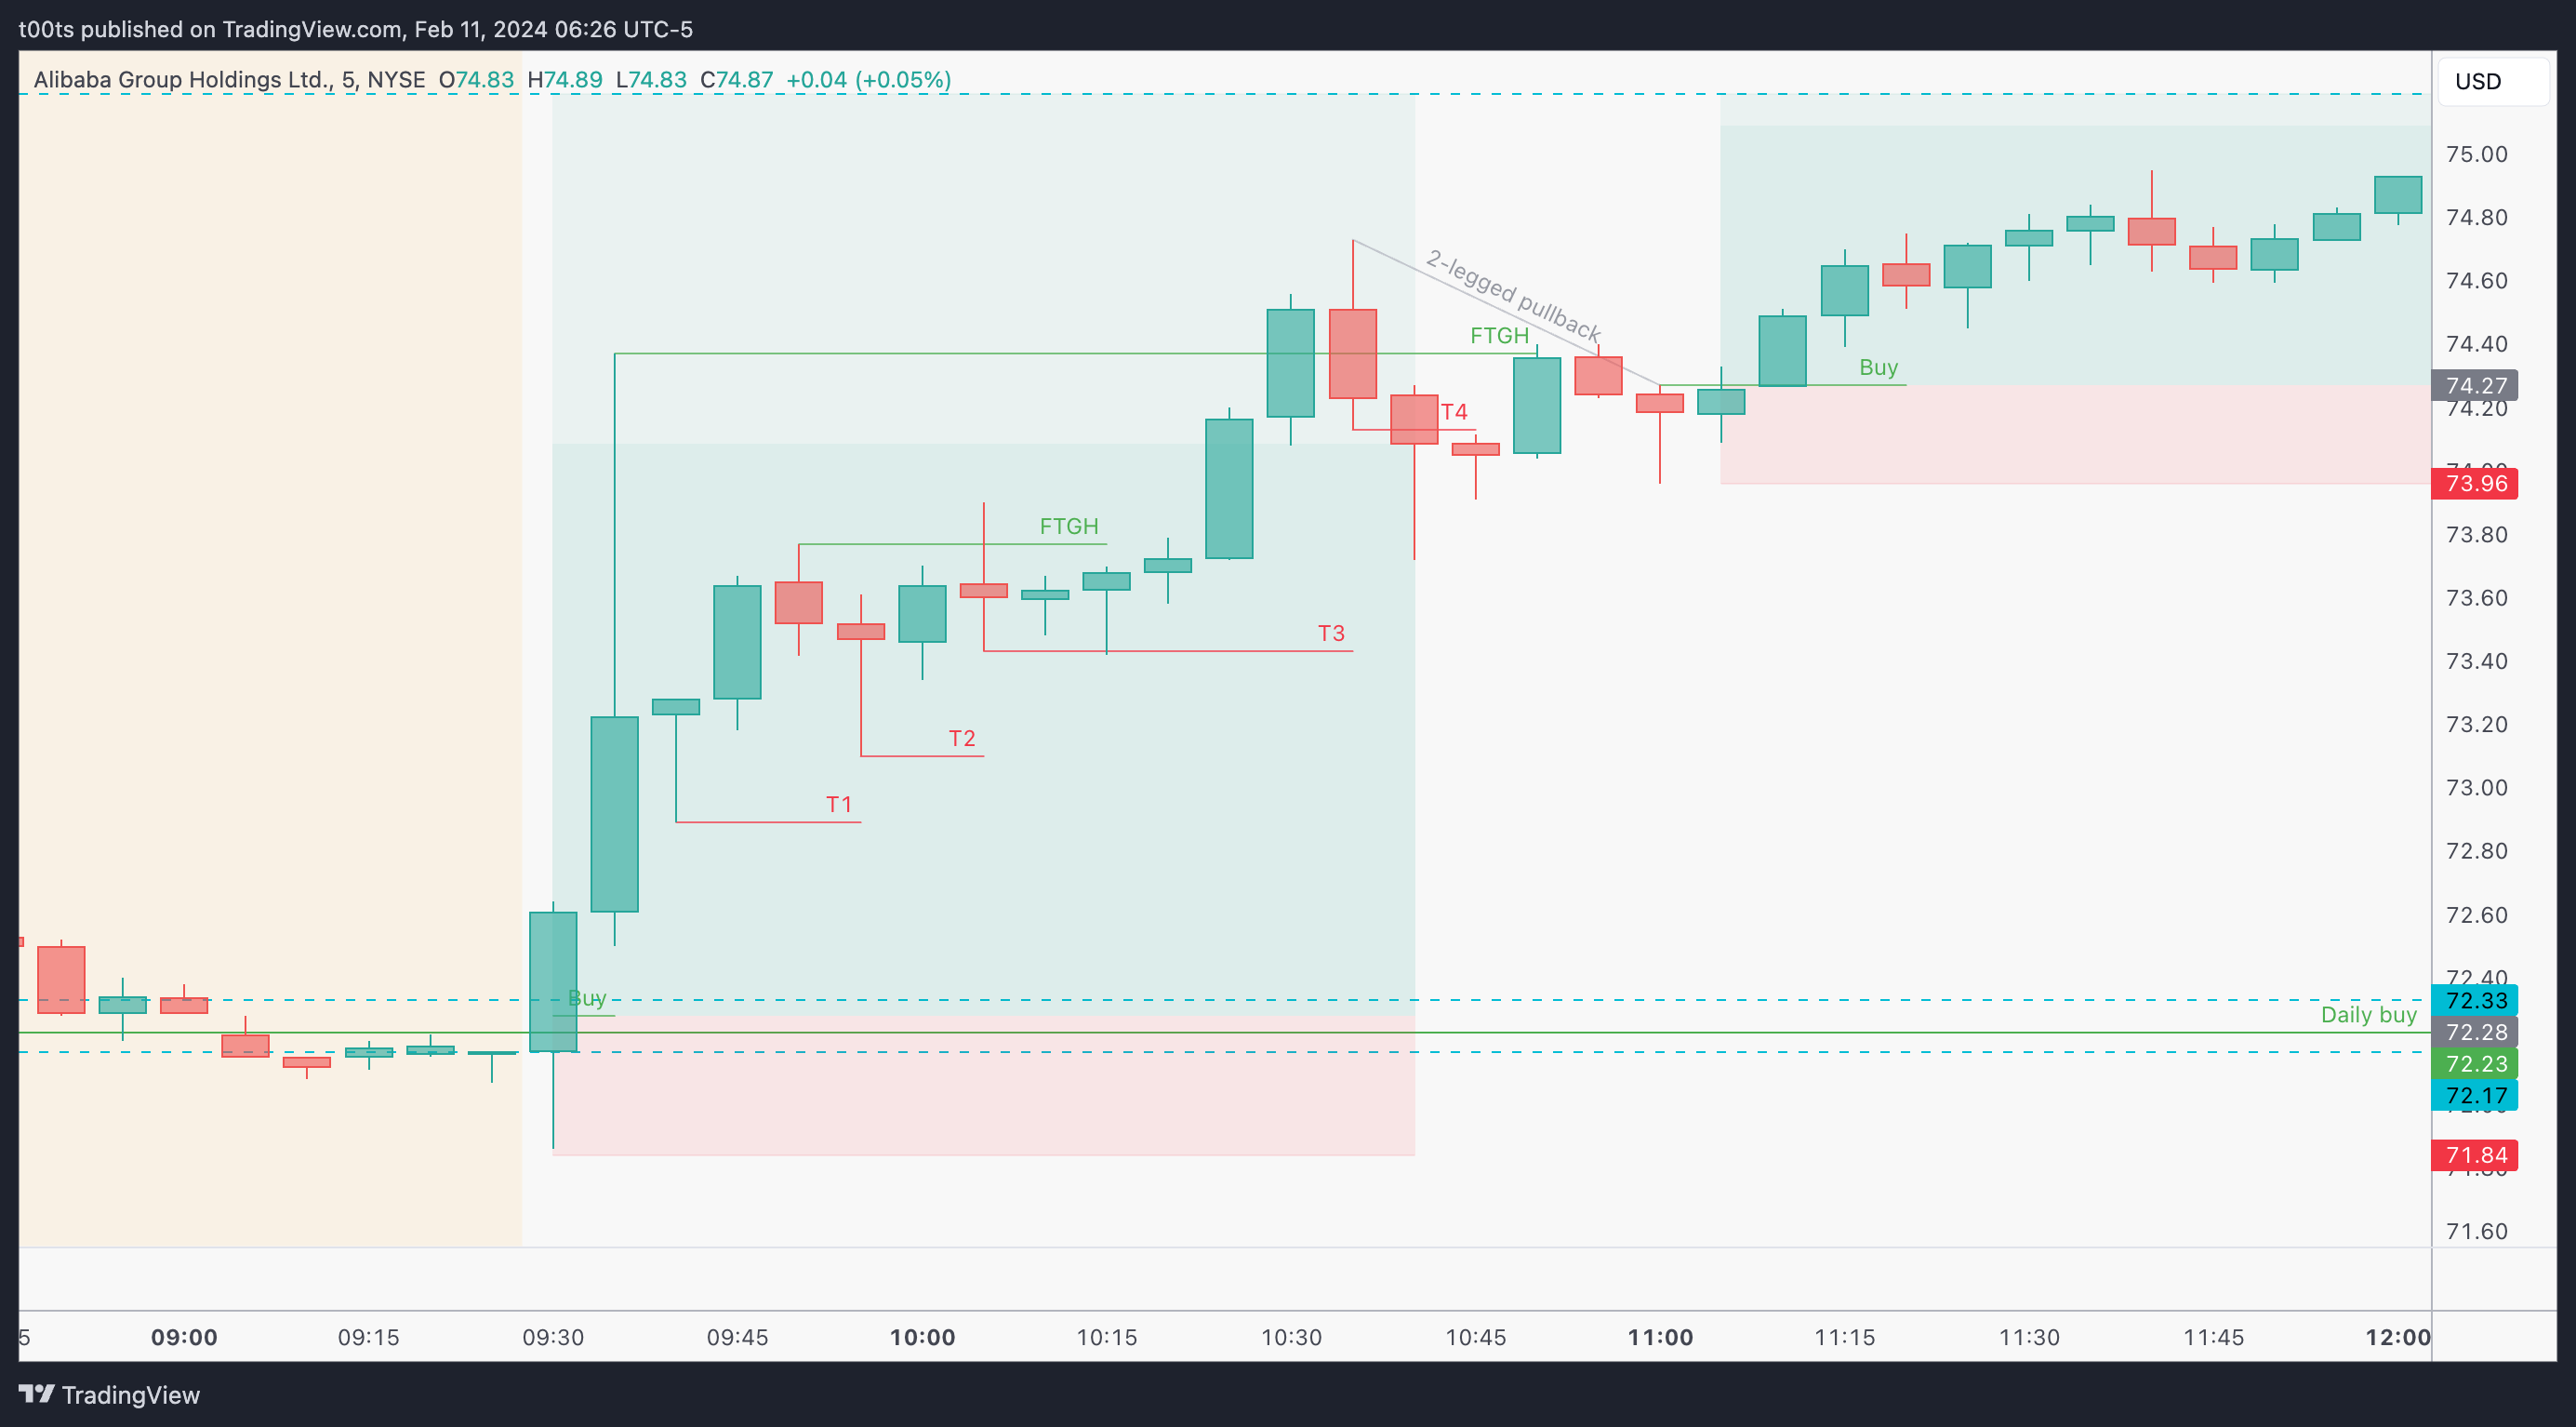
Here's a 5m chart with the stop trails. T1 was after that large wick and bounce back up. T2 is at our first pivot. T3 is after a failure to go higher but never really triggers.
T4 stops us out.
I don't think this was a good stop. You could probably keep a core as the trend hasn't failed. The thing is that when you're in the trade, you've held through 40 minutes of consolidation and the stock finally breaks out, it's a bit of a bummer to see it fail and come back down, so although I'm not advocating this is what you should do, it's natural human behaviour you sometimes can't avoid.
There was another opportunity to either add or go long again a few bars later, but the action was extremely slow and frankly a waste of time.
Closing notes
With the benefit of hindsight, while this day did turn out to be a solid trend day, a week later and price is back around these levels after BABA reported earnings. To me, it still feels weird that there's been so much capital pouring into these names and yet they've barely moved.
BABA is the China stock by excellence, so I'd argue it's a good proxy to get a feel for the overall picture. And as of now, it's not looking too bright. We'll see if this changes soon.
I am posting one trade writeup every day throughout 2024. I focus on large caps using levels and price action. The subscription is absolutely free and will always be. I will strive to provide value by offering clues and ideas for you to enhance your edge. Let’s grow together!