
Tesla (TSLA) - Feb 15th 2024
Using higher timeframe cues to gauge and trade intraday trends

Higher timeframe context
We've all witnessed how Tesla stock hasn't been getting any love for the past few weeks, as all the action is now in the AI-related names, mainly in the semiconductor sector. Quite ironically, Tesla is probably the company that has the most advanced real-world AI, yet investors seem reluctant to bet on it, for now.
Weekly chart
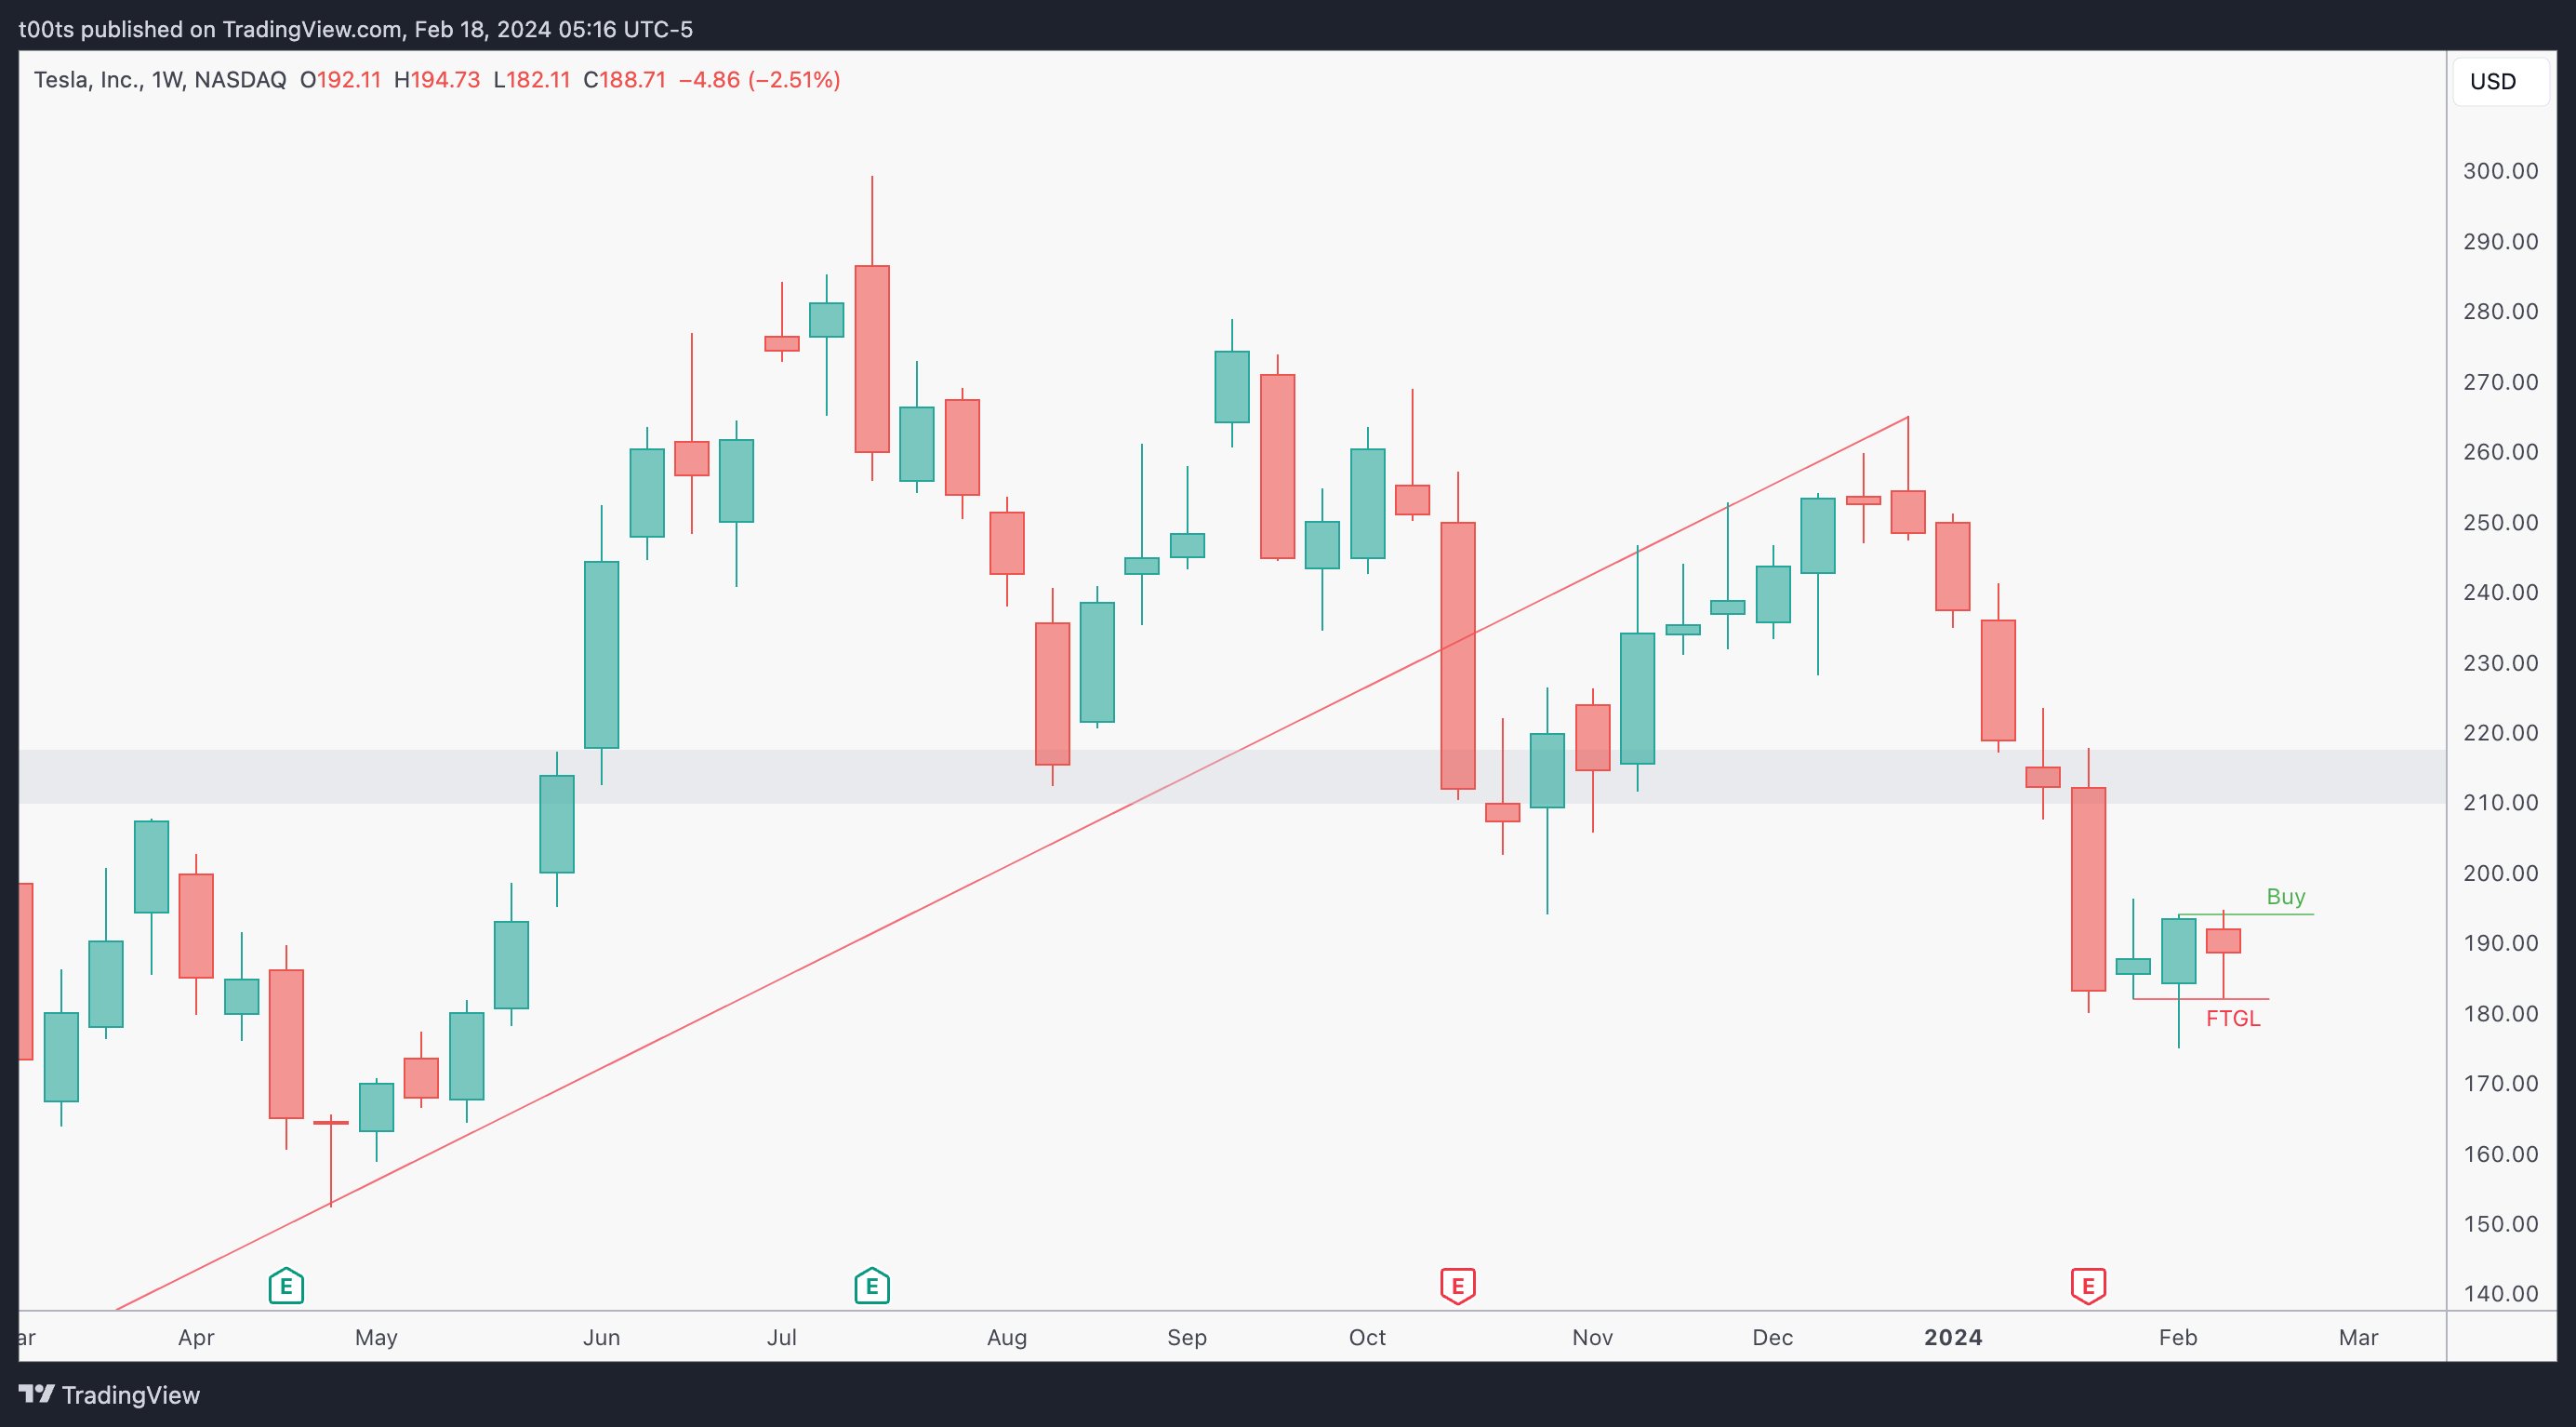
After that multi-week aggressive drop, looks like price has finally found some support at the $180 area, as it looks like the stock is basing there. We got an interesting weekly bar last week with that failure to go lower on what looked like a potential 3-bar play setup to the downside that failed, leading to a very profitable trade.
Price is now trading within the previous bar's range as we wait for further confirmation for some much-awaited relief bounce to the upside.
Daily chart
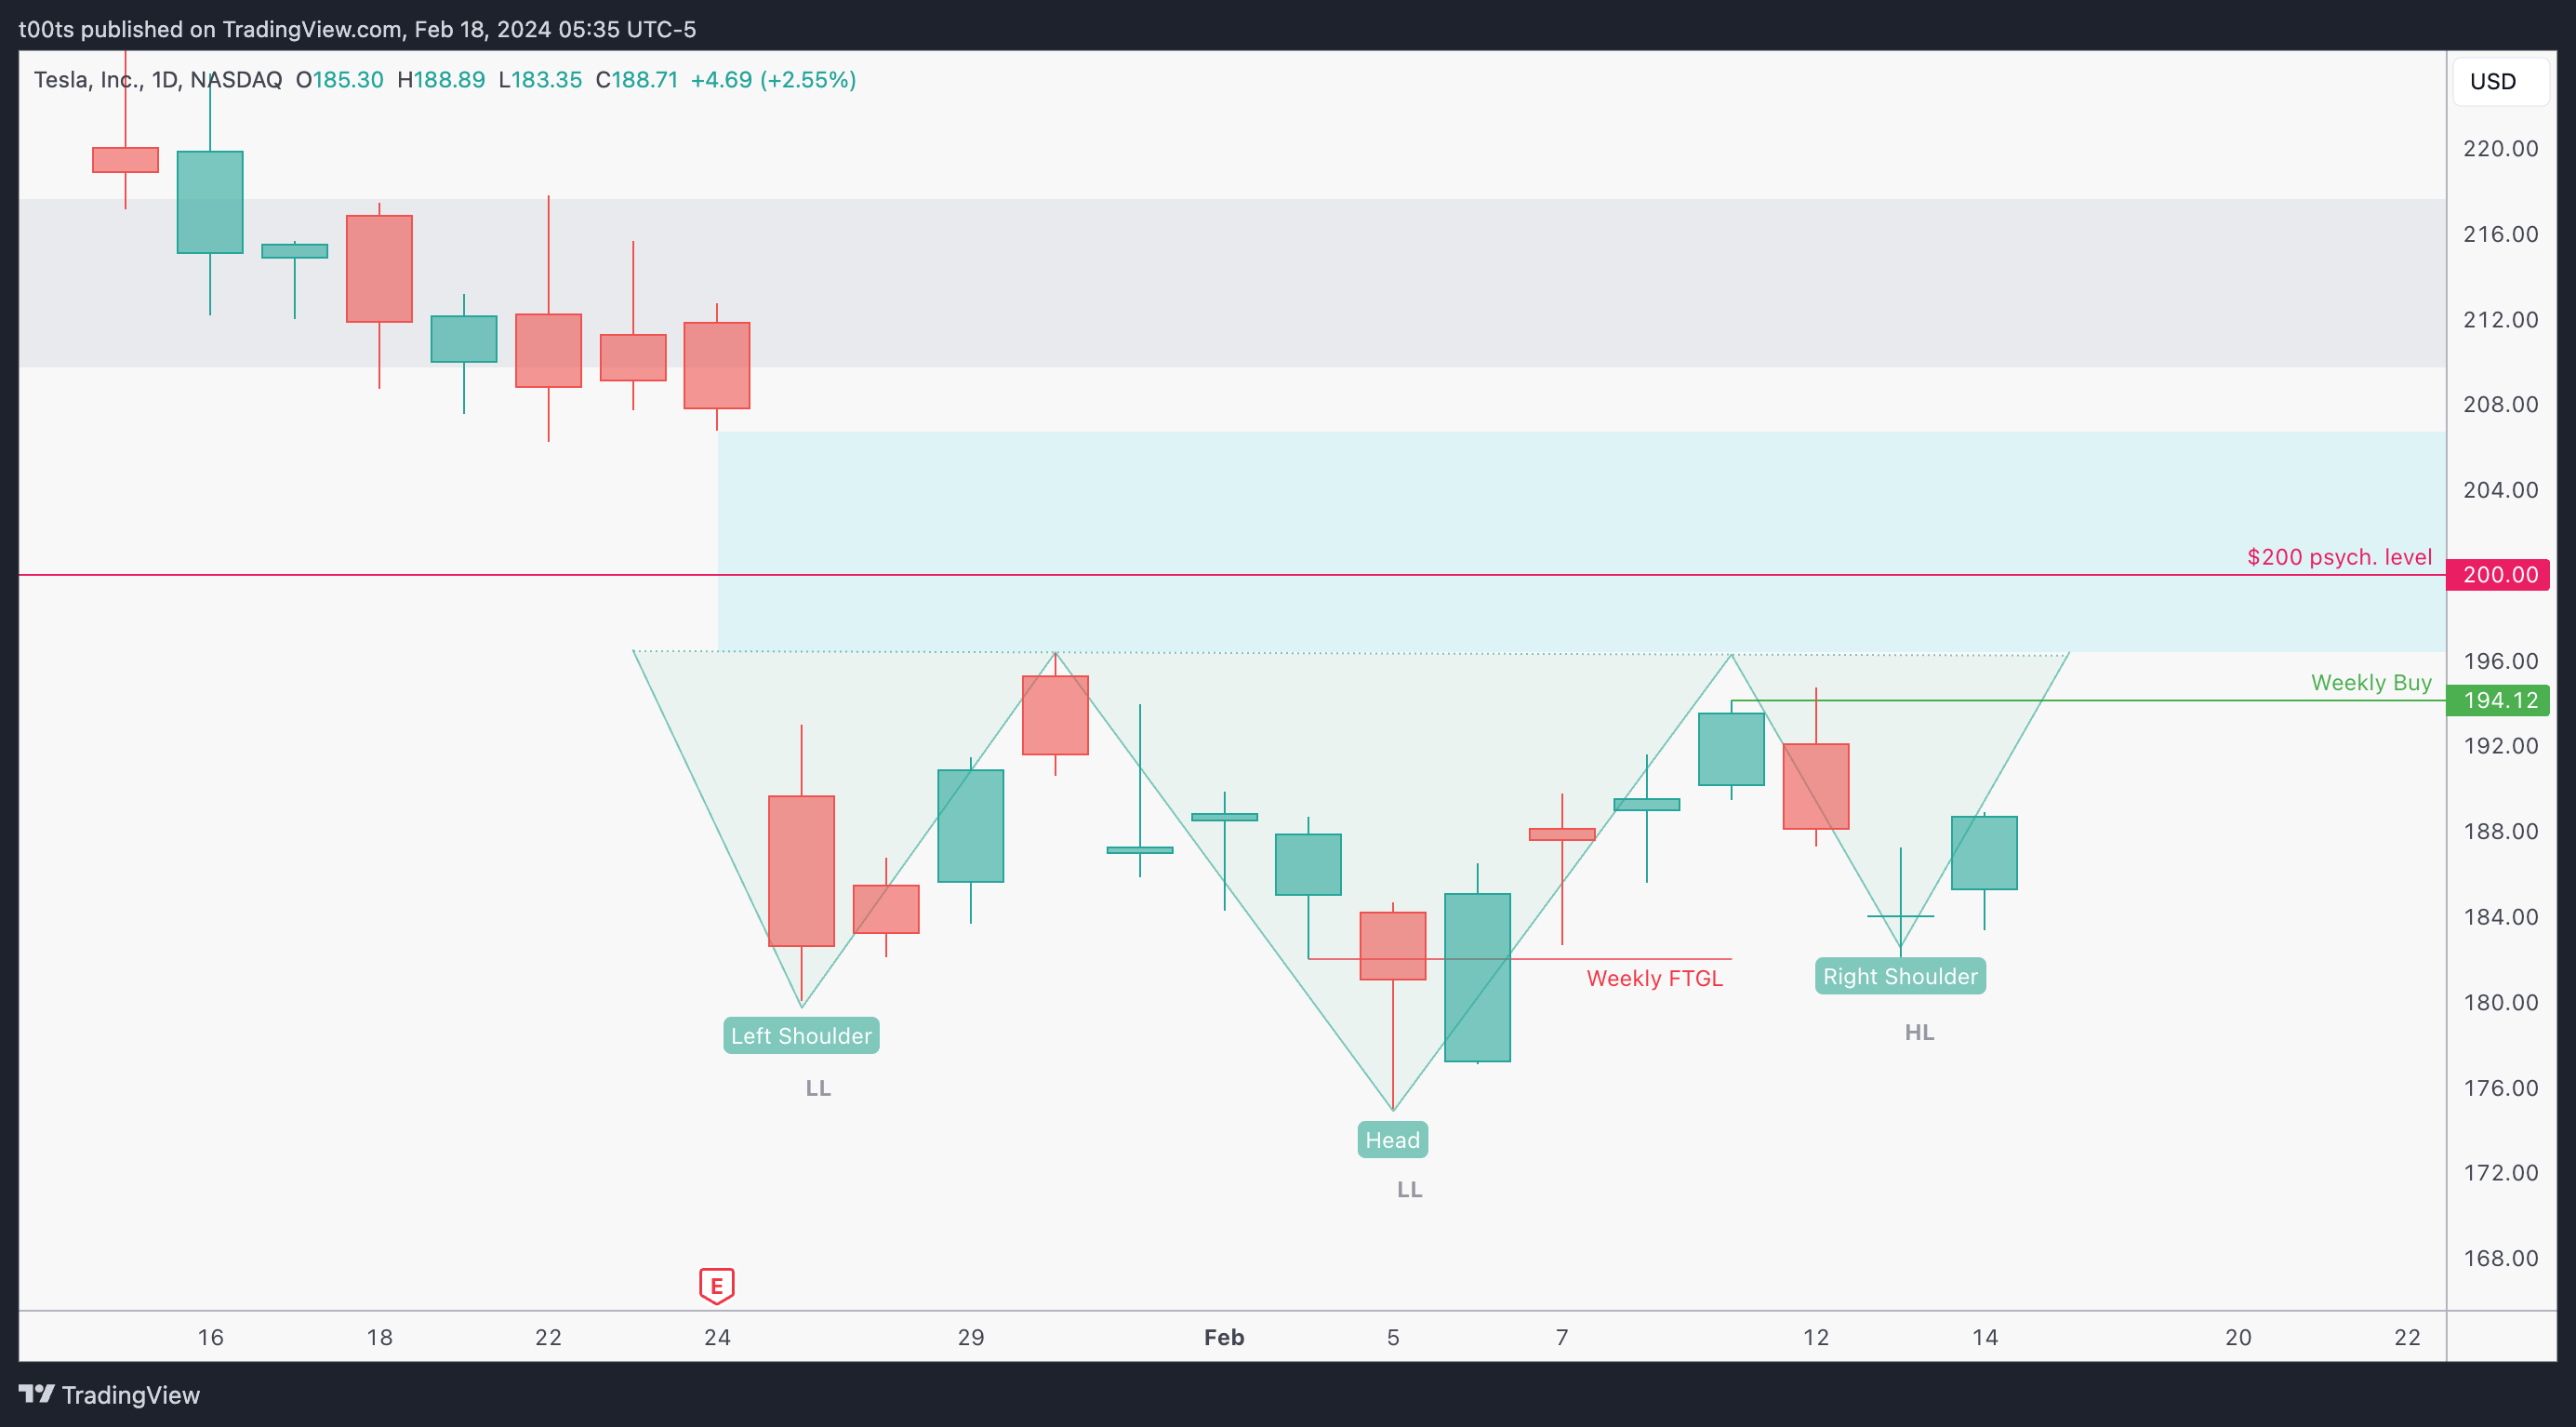
I'm not a pattern guy. I rarely if ever trade off patterns, but this one stood out to me and I figured it was worth highlighting. TSLA's daily action looks like an inverse head & shoulders formation, which is generally bullish. There's also an unfilled earnings gap above which could act as a magnet for price.
Honestly, all I care about in this chart is the daily higher low that's potentially being formed. This is the first time in a while we see a potential higher low being put in. This is what really catches my eye, which added to the weekly failure we just saw adds to a good long thesis.
Hourly chart
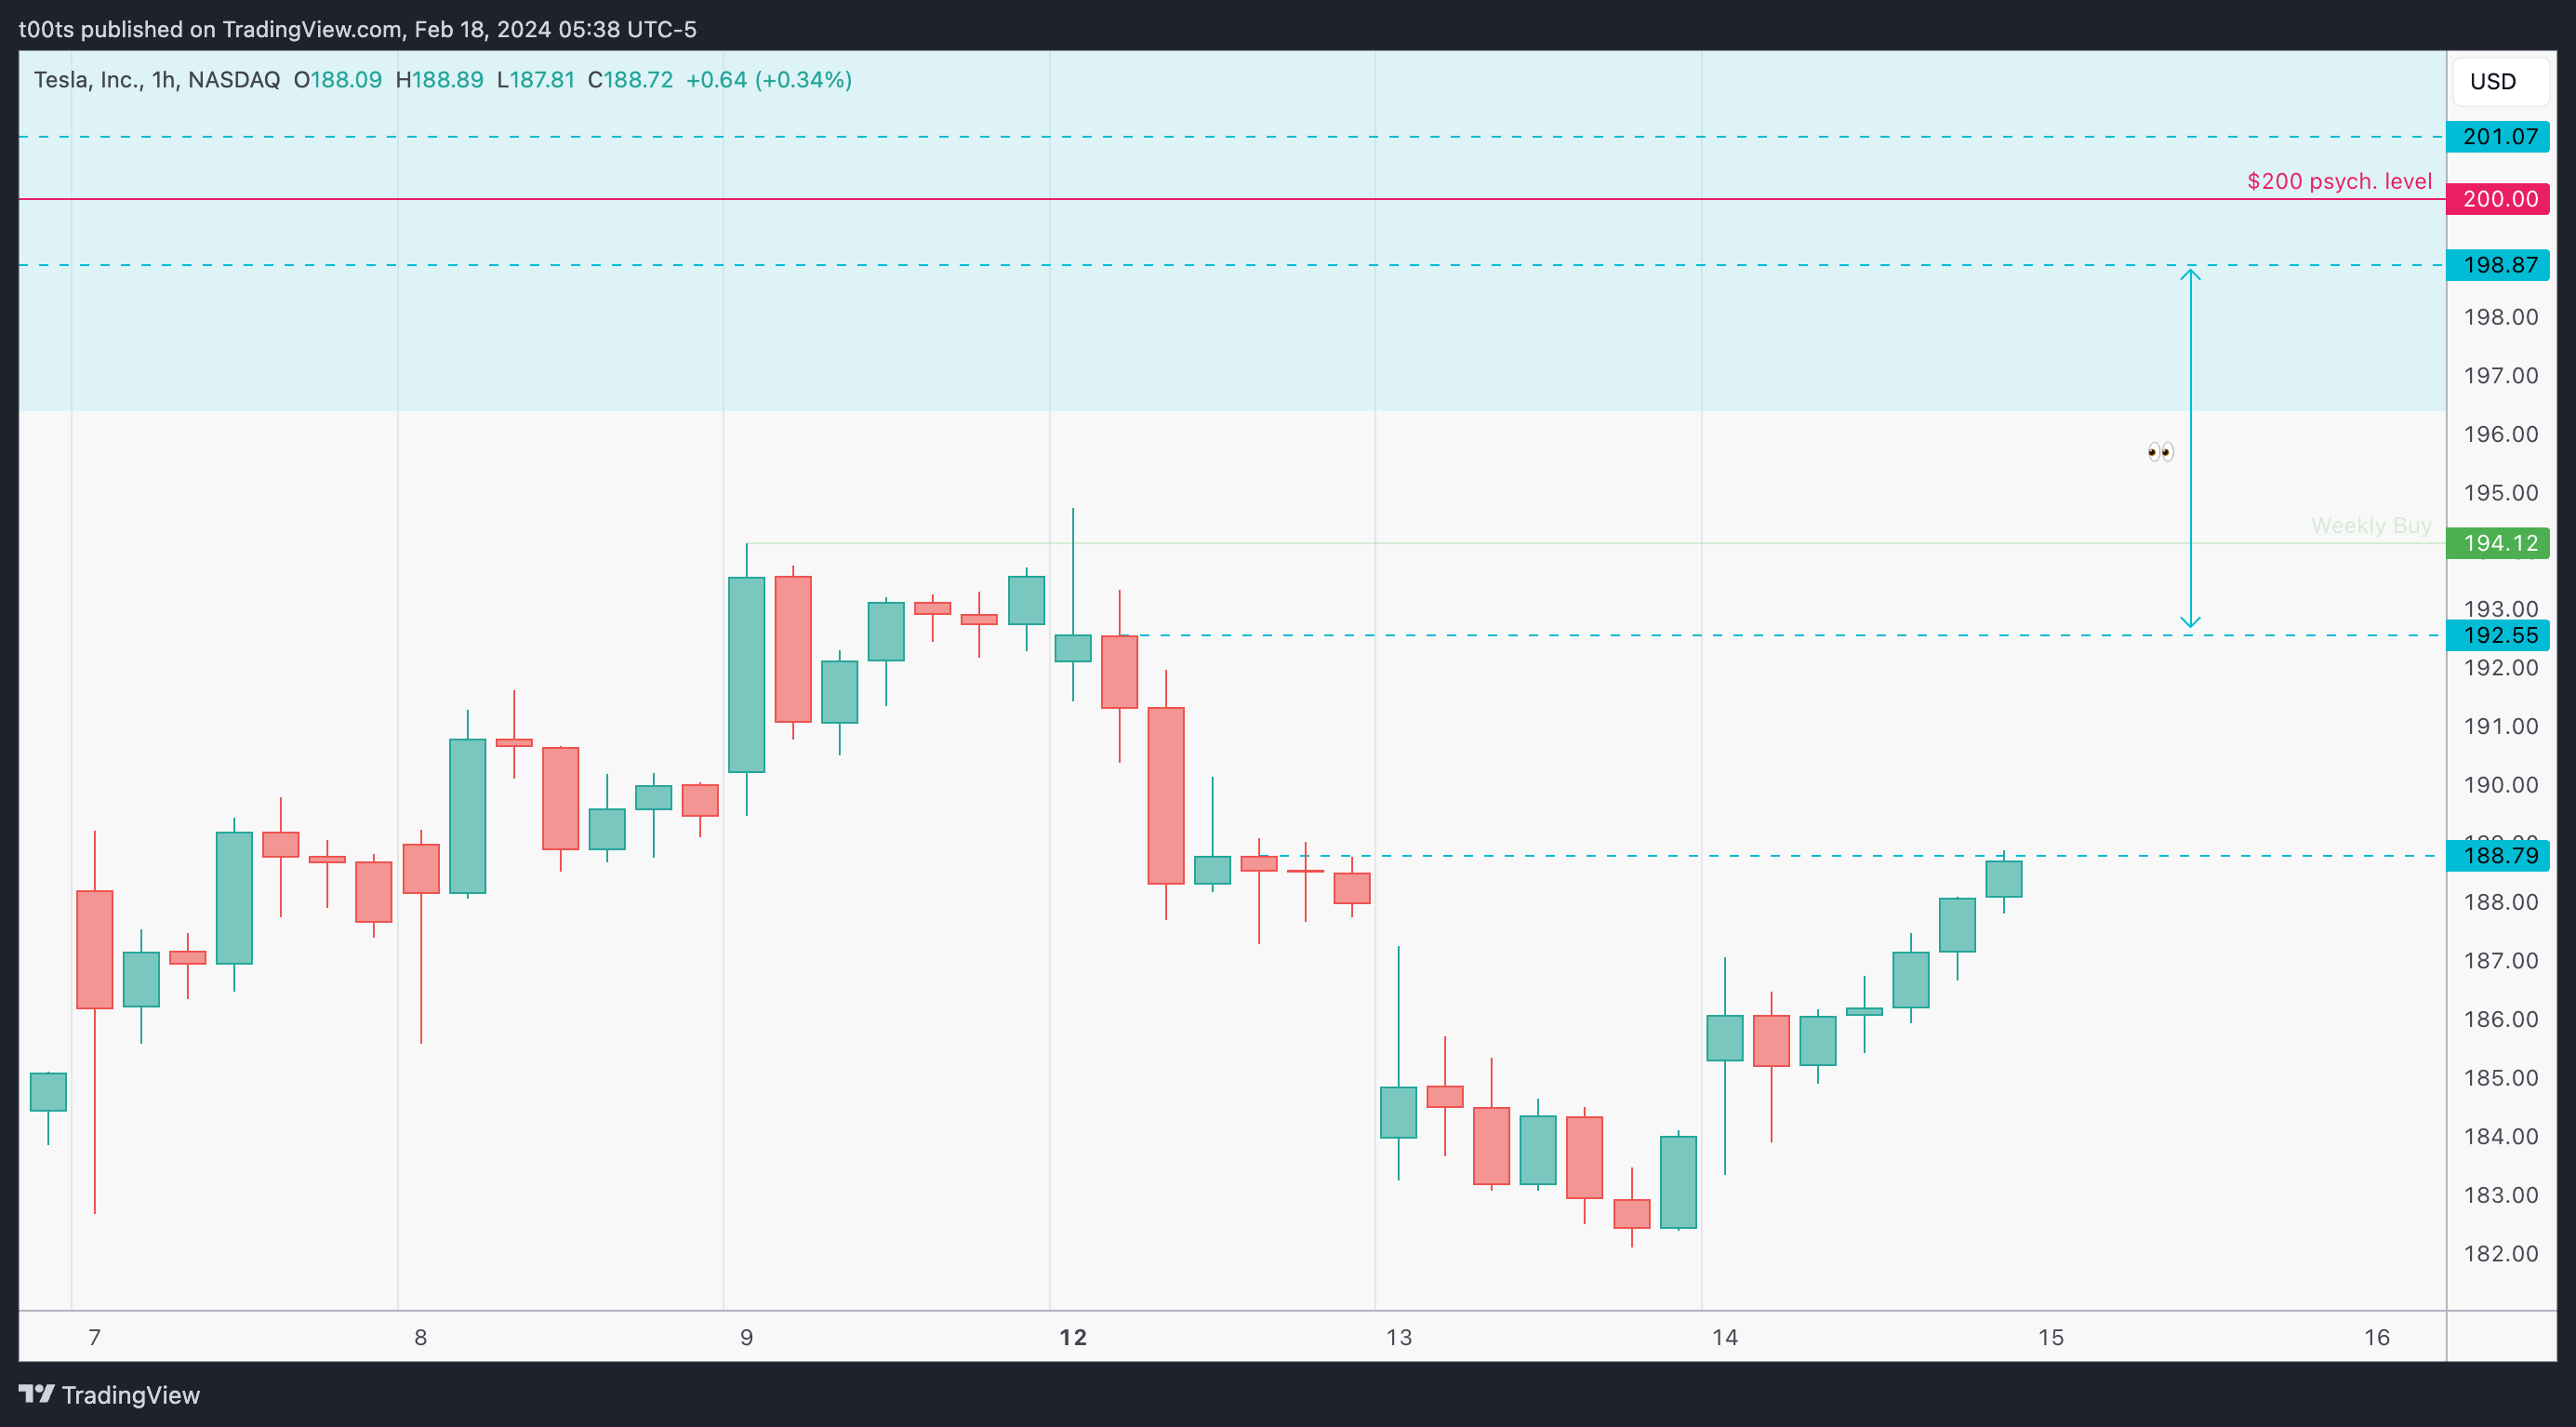
There's a few things in this hourly chart that are worth our attention. First, the lack of momentum to the downside on the 13th. Yes price is trickling down but the action is pretty choppy all day as there's no conviction from sellers. Buyers manage to even close the day slightly green, leading to the gap up on the next day where again every push down is bought back up and the day closes on a strong note.
There's a few levels of interest. The $192.55 seems strong as it started this last downturn. Also, look at how much room there is to our next level at $198.87. That's over 6pts with no levels and an unfilled daily gap....
Pre-market action
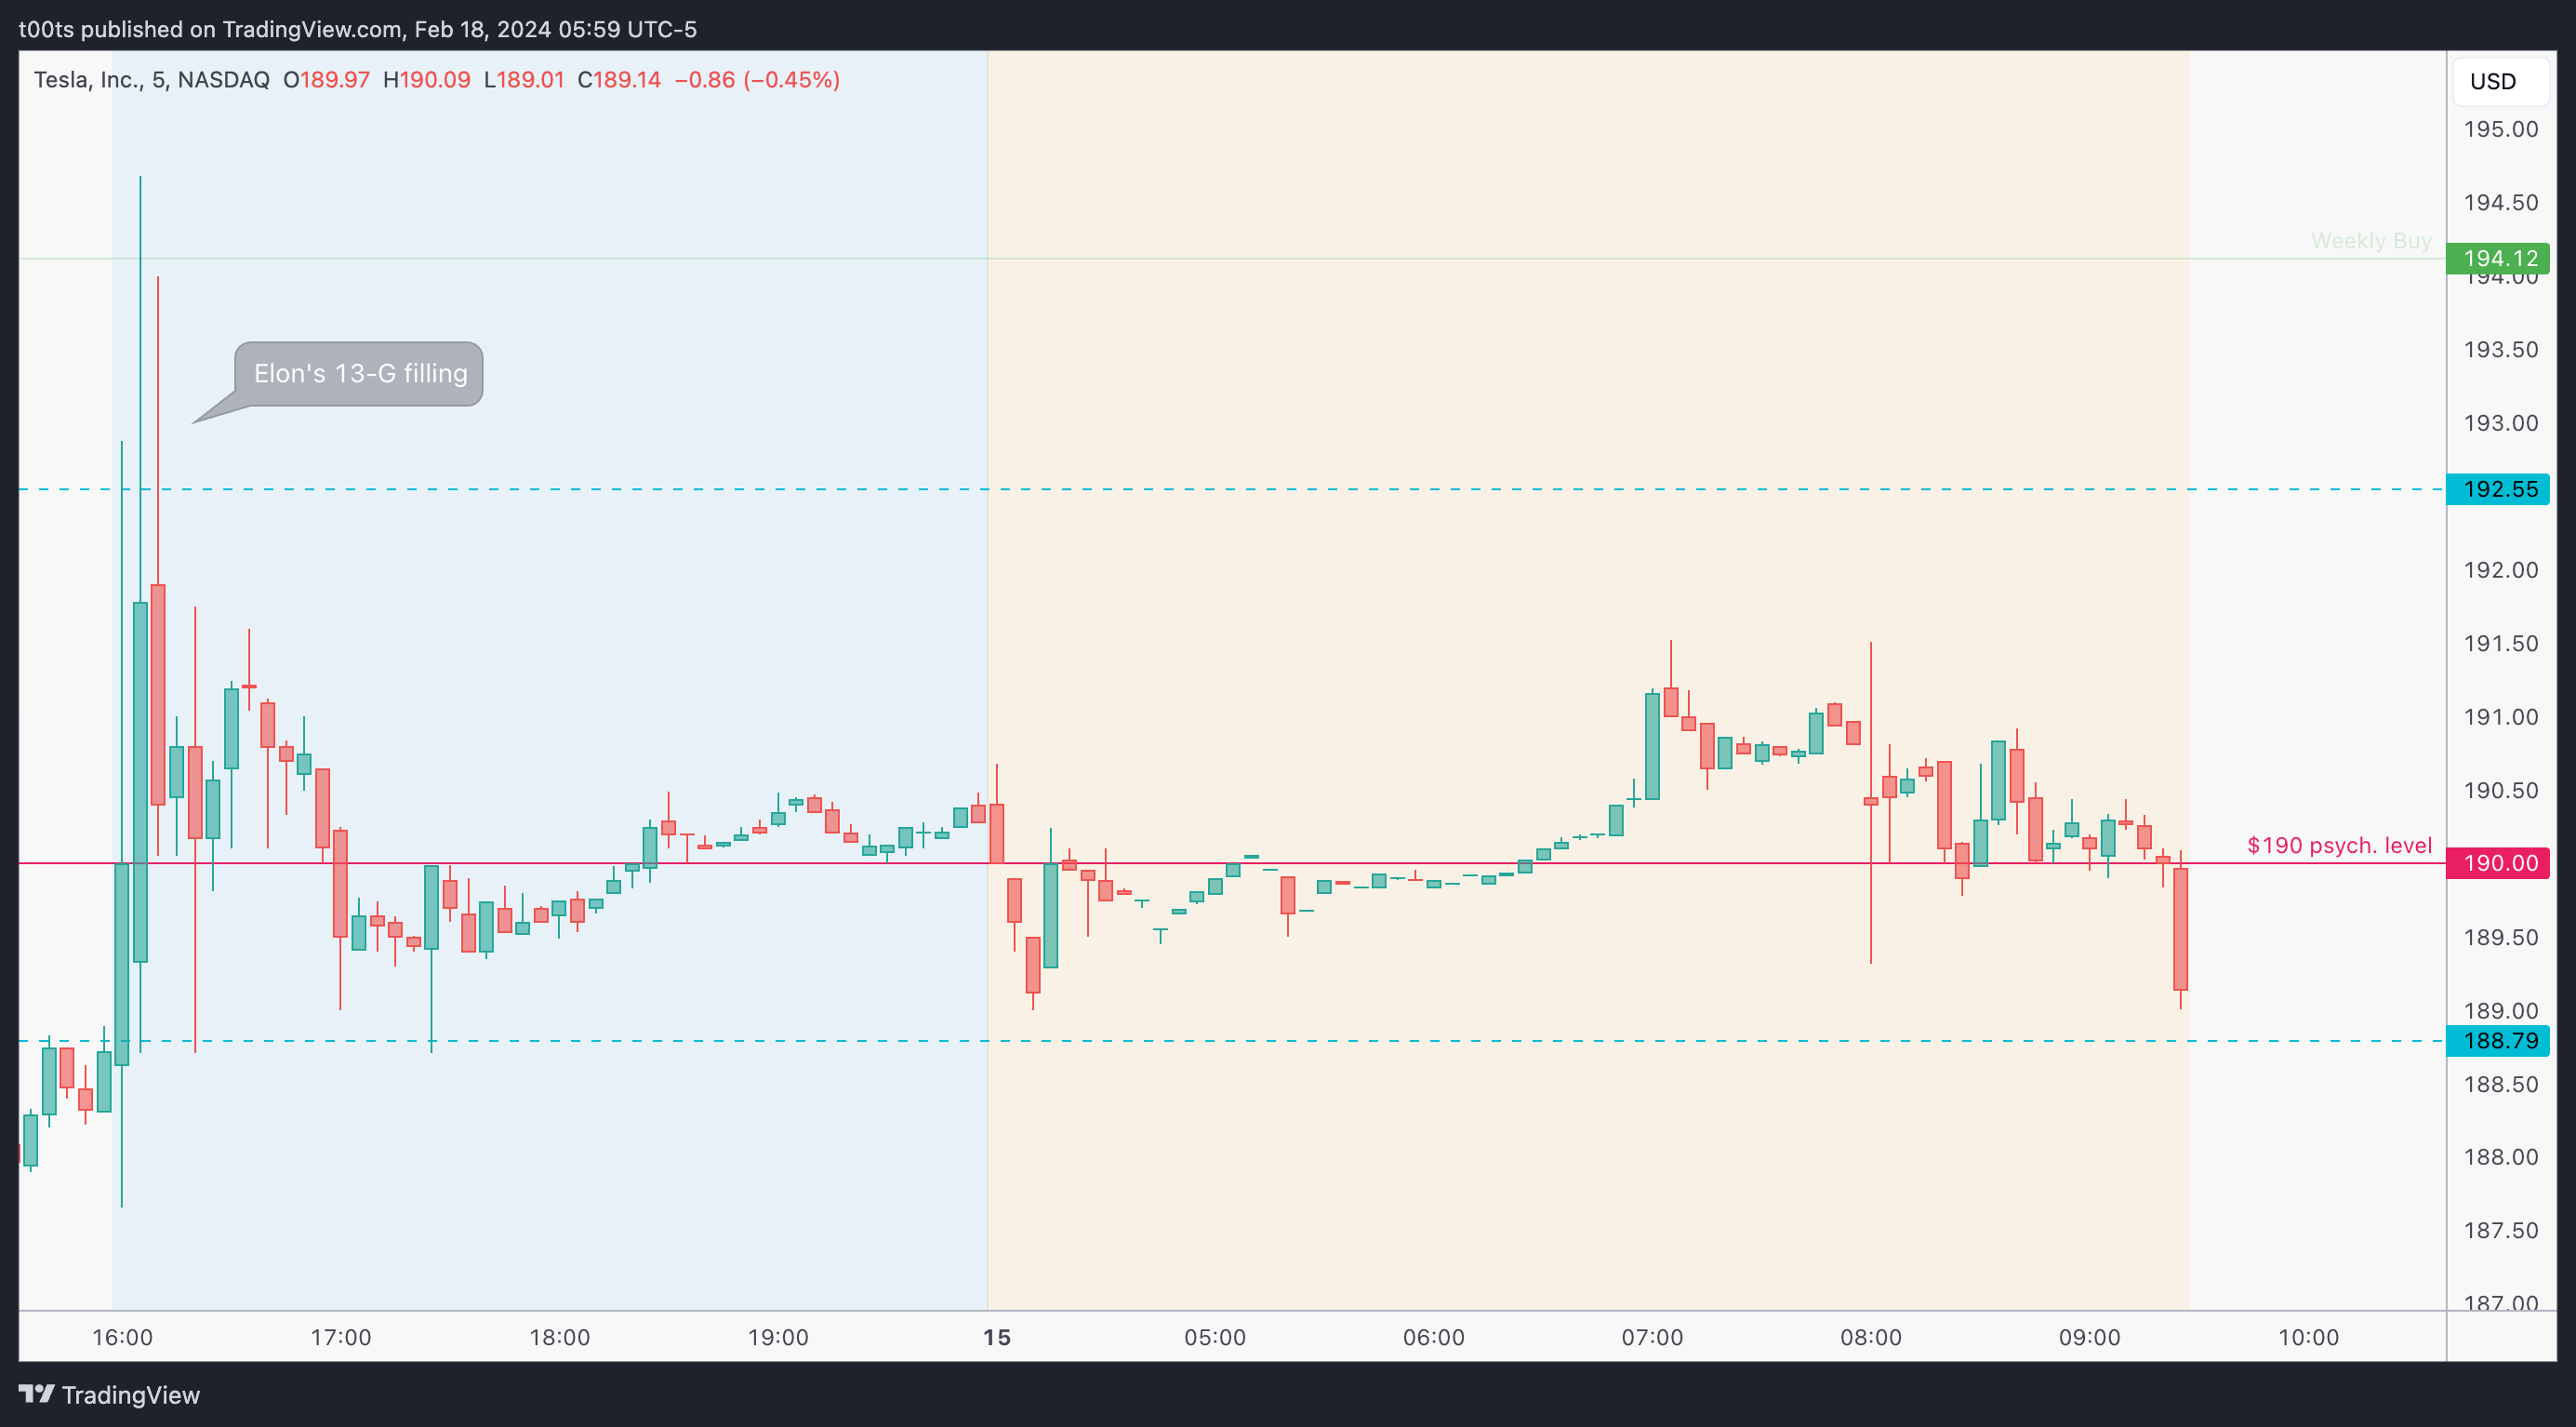
Notice the spike in after-hours leading to today's session. A 13-G filling filed after the close and led to a lot of confusion with regard to Elon increasing his stake in the company from 13% to 20%, which was finally not the case. Nevertheless, this surely brought some attention to the stock on the following day.
There's not much to highlight in the pre-market. Price keeps reacting to the $190 psych. level but that's not surprising. We're clearly set to open very close to the $188.79 level, which is fantastic because we can plan a trade off of a potential bounce there.
The trade
Those who've been reading know that the plan here would be to look for bounces off the $188.79 and buy as price reclaims the opening print risking the lows and looking for a strong opening drive push. Well, reality was that the opening drive did happen, but the entry never triggered.
Just as we saw on yesterday's post, the only thing wrong with missing that first move is disregarding the stock for a potential continuation trade. Just like ABNB, TSLA offered a continuation move that was clean and worth going over.
Here's what our CPT would look like:
Cue(s)
Multi-week base after strong drop with weekly failure
First daily potential higher low being put in after weeks of selling
Inverse H&S pattern forming on the daily chart
Unfilled earnings gap above
Intraday cue: Strong opening move reinforcing the higher timeframe thesis
Intraday cue: Trend pulling back to a strong level and setting up a buy setup
Plan
The plan all day is to look for favourable risk to reward setups to get involved, especially after missing that opening drive. First opportunity is the 3-bar play that sets up right at the next level which triggers but doesn't get immediate follow-through.
Technically it doesn't stop you out, but the moment the level is lost so aggressively I'd definitely be out.
So after that we're just waiting for any buy setup to get involved, preferably at a level we can use to gauge our risk. We get a couple at the Weekly Buy level but none trigger. Instead price comes down to test the $192.55 level once again and offers a convenient buy setup after failing to trade below prev. bar lows, putting in a perfect bullish signal bar.
Trigger
Price trading above any bullish signal bar.
5m chart
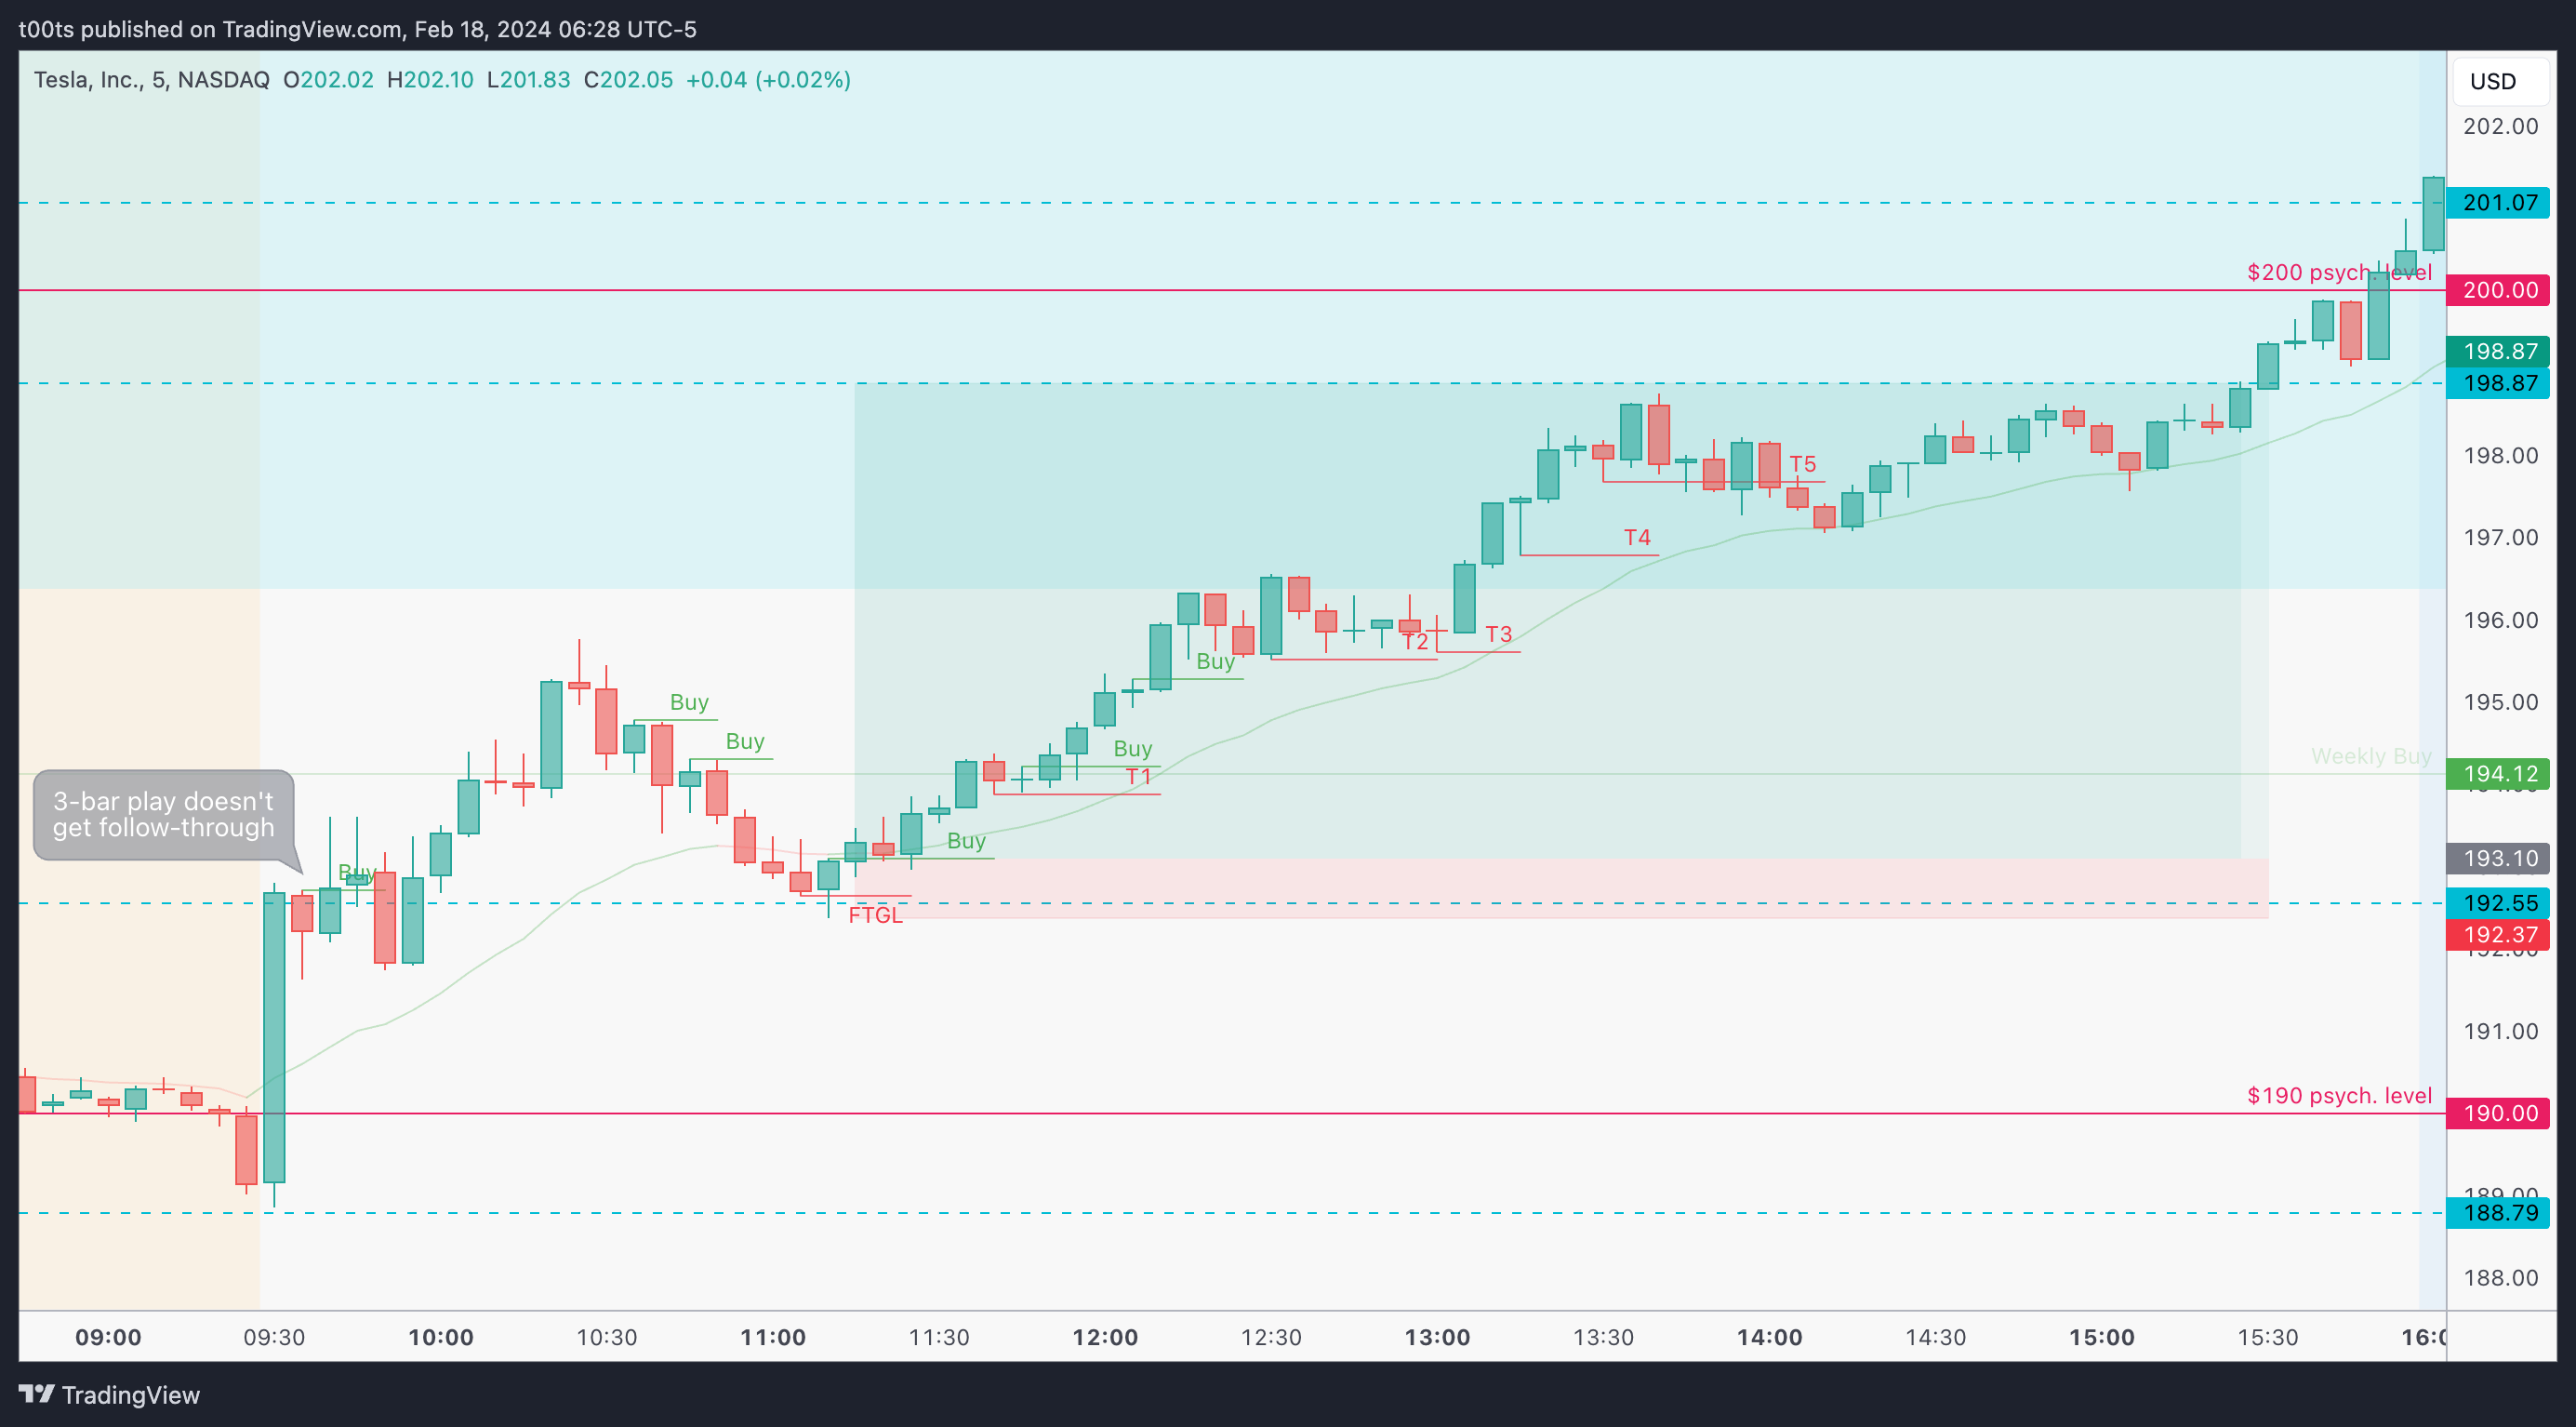
Price chops around slightly after our entry but anytime you're getting involved in a trade so late in the session you know you're likely going to sit there for a while. Volatility happens near the open, here we're expecting something different and should use the proper instrument for a longer trade. This day was a Thursday, so if you're targeting the level above, the $200 mark, or the gap fill, you should definitely consider going for at least 1-week out expirations when trading options.
Anyways, the trade works well. There's a slight consolidation on the weekly buy area which not only lets us trail our stop (T1) but also allows for a second entry with super tight risk.
Price consolidates for almost an hour when it gets to the lower bound of the gap. We've gone over this plenty of times. Gap bounds act as support/resistance levels, so this consolidation is expected. And honestly, while it may be boring, it shouldn't be stressful. There's not a single break of the first low pivot (marked T2), so you should be fine holding through.
When the next leg up starts price is officially in gap fill territory. T4 is set at the lows of that 3-bar play as soon as it triggers to the upside, just in case it fails.
T5 is somewhat aggressive but at this point, when you've been sitting through an hour-long consolidation, you'll most likely want to protect what you have. This trail does trigger and nets you a +6R trade.
We're not seeing signs of potential failure yet and price is holding well above our trend EMA, so you can leave some runners until the EMA gives up. Which it never did.
Price closed at the highs that day.
Closing notes
This trade reinforces the idea we went over yesterday, where you don't have to catch the first move to profit off a trending day. First moves are quicker and arguably less stressful as they're a lot more binary in their outcome, but a solid entry for a second leg can prove to be very profitable as we've seen today.
Of course, there's a bigger picture thesis that must be in play for this to happen. Today we had a bunch of higher timeframe cues that led us to believe the intraday trend could continue, thus leading us to take this trade.
I am posting one trade writeup every day throughout 2024. I focus on large caps using levels and price action. The subscription is absolutely free and will always be. I will strive to provide value by offering clues and ideas for you to enhance your edge. Let’s grow together!