

Higher timeframe context
The cybersecurity sector has been on an absolute tear for the past couple years. We haven't really had the chance to go over any of these names so far in this blog, so I'd like to finally kickstart it with today's entry.
Palo Alto Networks offers an enterprise cybersecurity platform that provides network security solutions to companies. If we remove companies with broader offerings like IBM or Cisco and focus solely on cybersecurity, Palo Alto Networks is currently the market leader by far.
Weekly chart
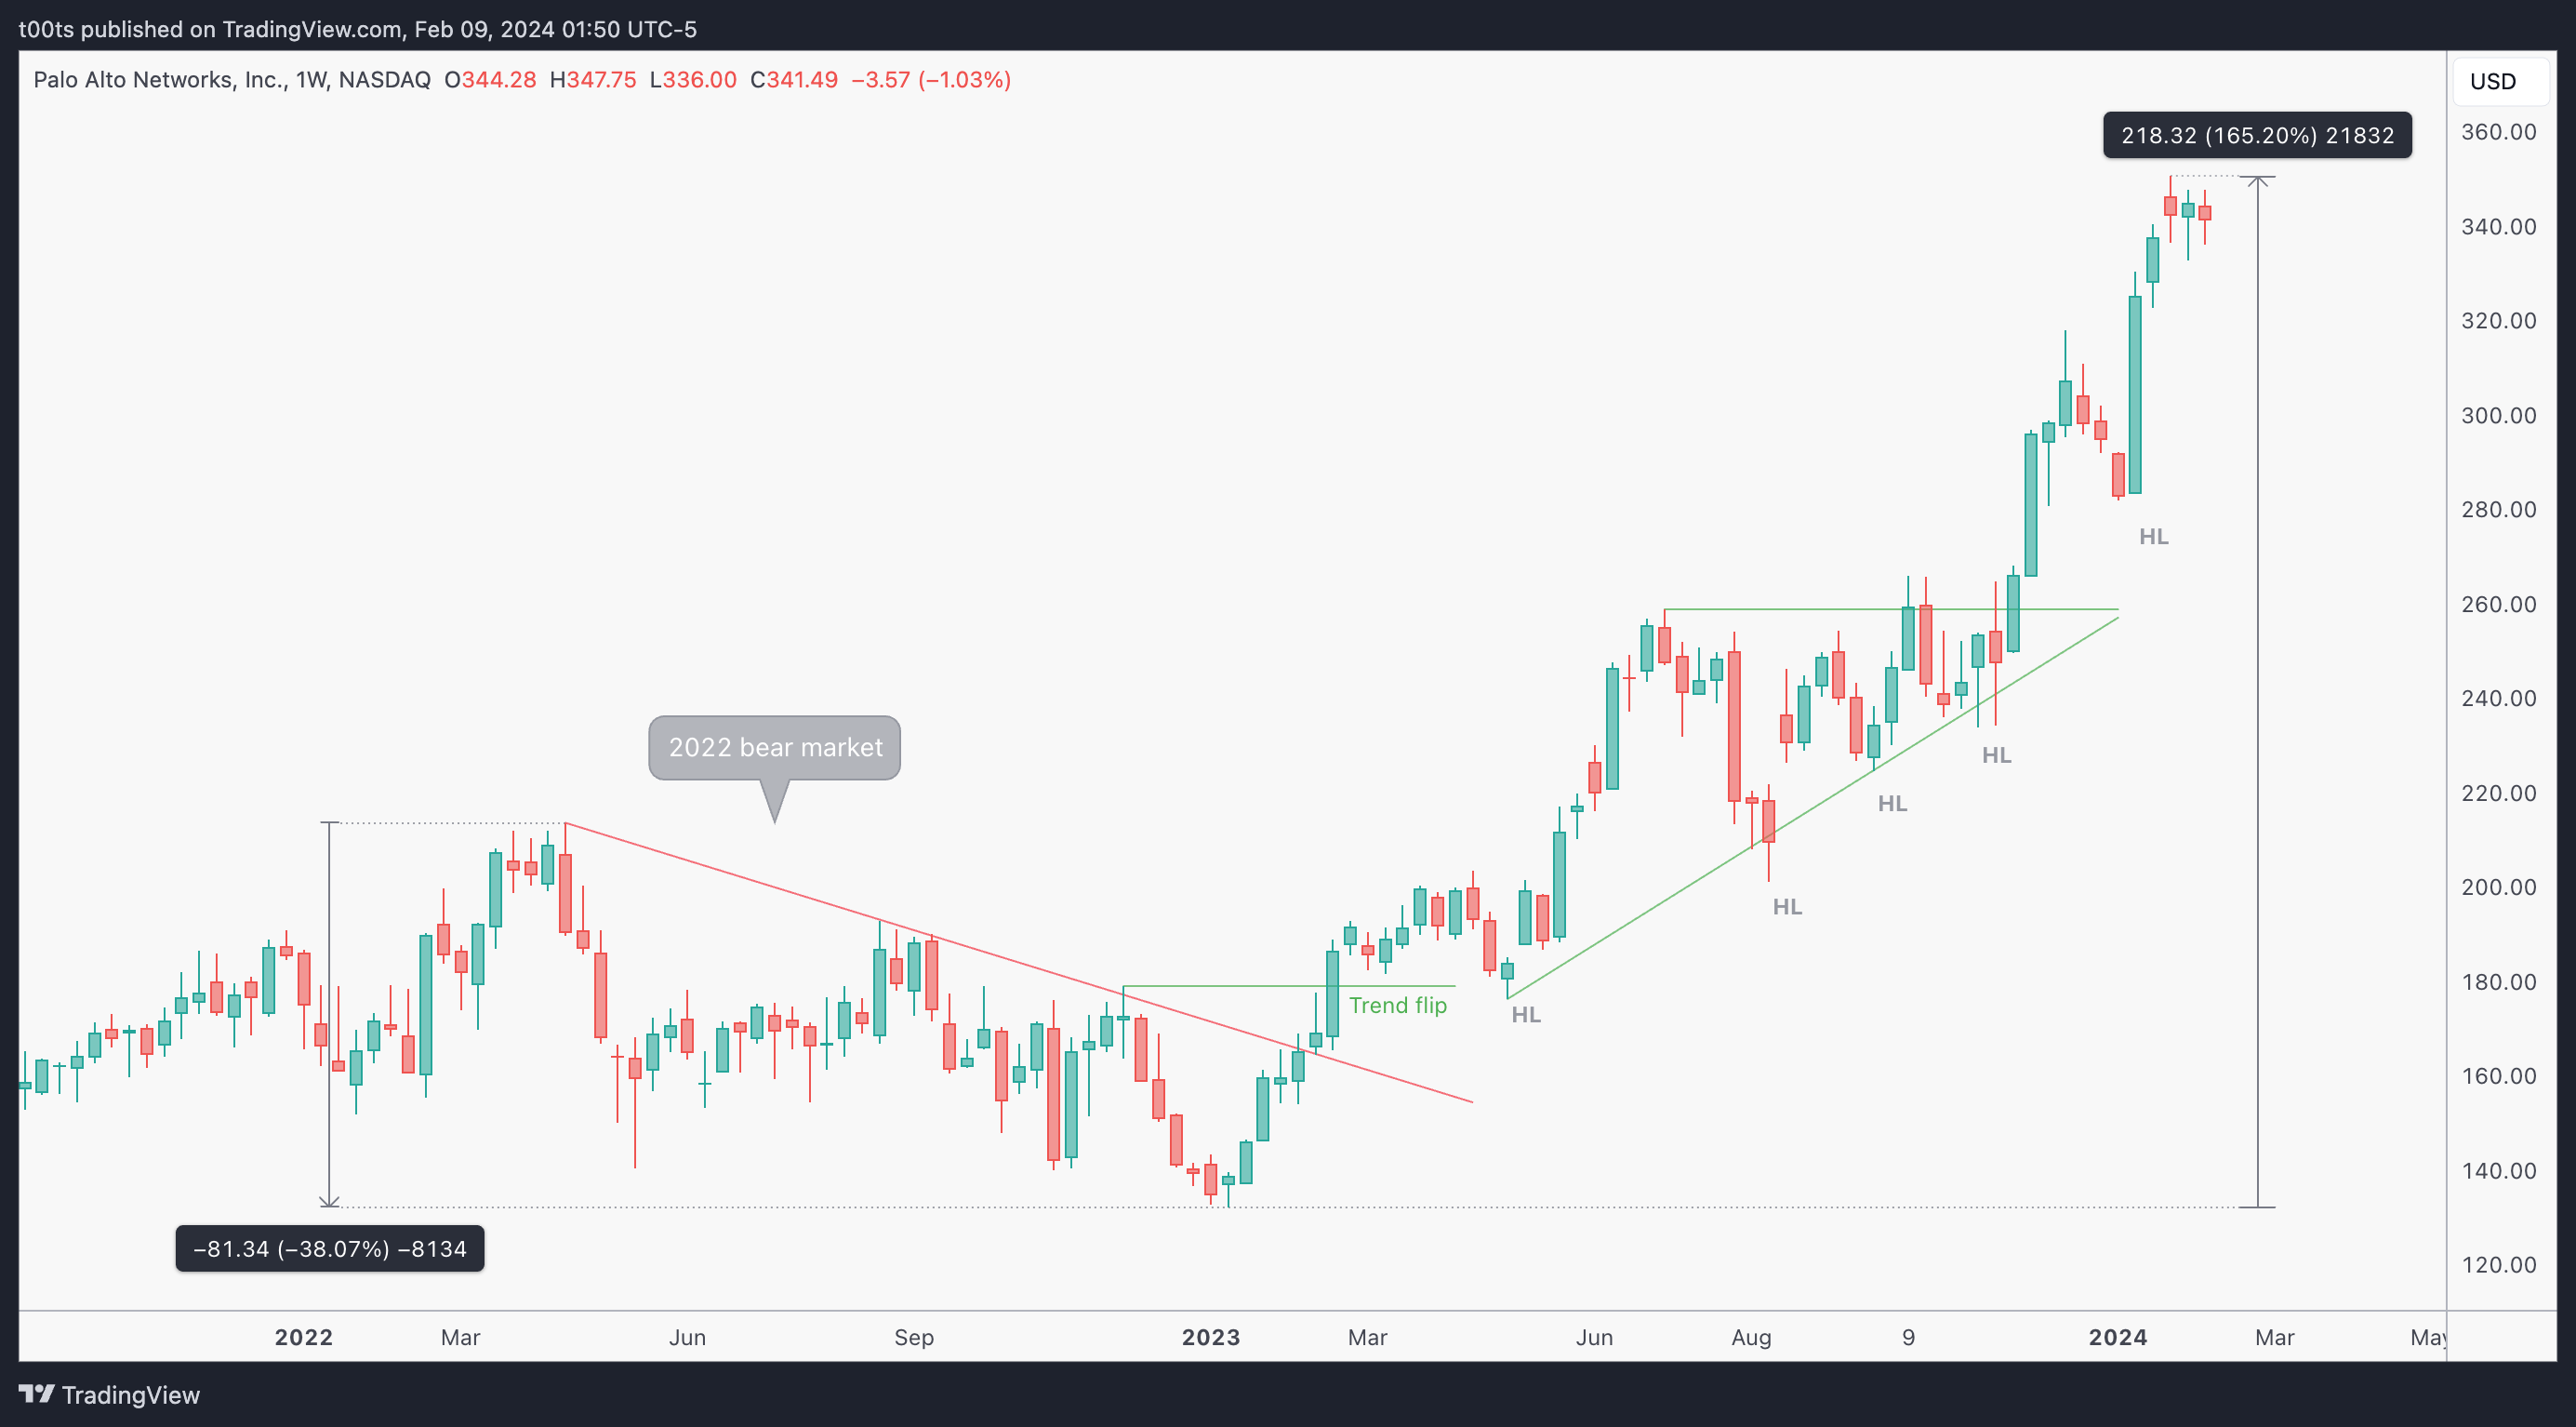
Gave ourselves a couple years of price history to get a feel of the overall strength of this name. The chart speaks for itself, but I do want to point out a few key things.
First off, the near 40% decline in the 2022 bear market. While this may seem daunting at first, let me give you a few other stats from the same period: AAPL: -32%, MSFT: -38%, AMD: -66%, NVDA: -68%, NFLX: -68%, TSLA: -74%, META: -77%...
The list goes on, but I believe the point is taken. PANW stock ranked among the best performing tech stocks during the 2022 bear market.
The stock bottoms early 2023 and is currently up 165% ever since, but unlike META with it's bizarre V-shaped recovery, this one shows a very organic and balanced uptrend with plenty of trading opportunities.
Daily chart
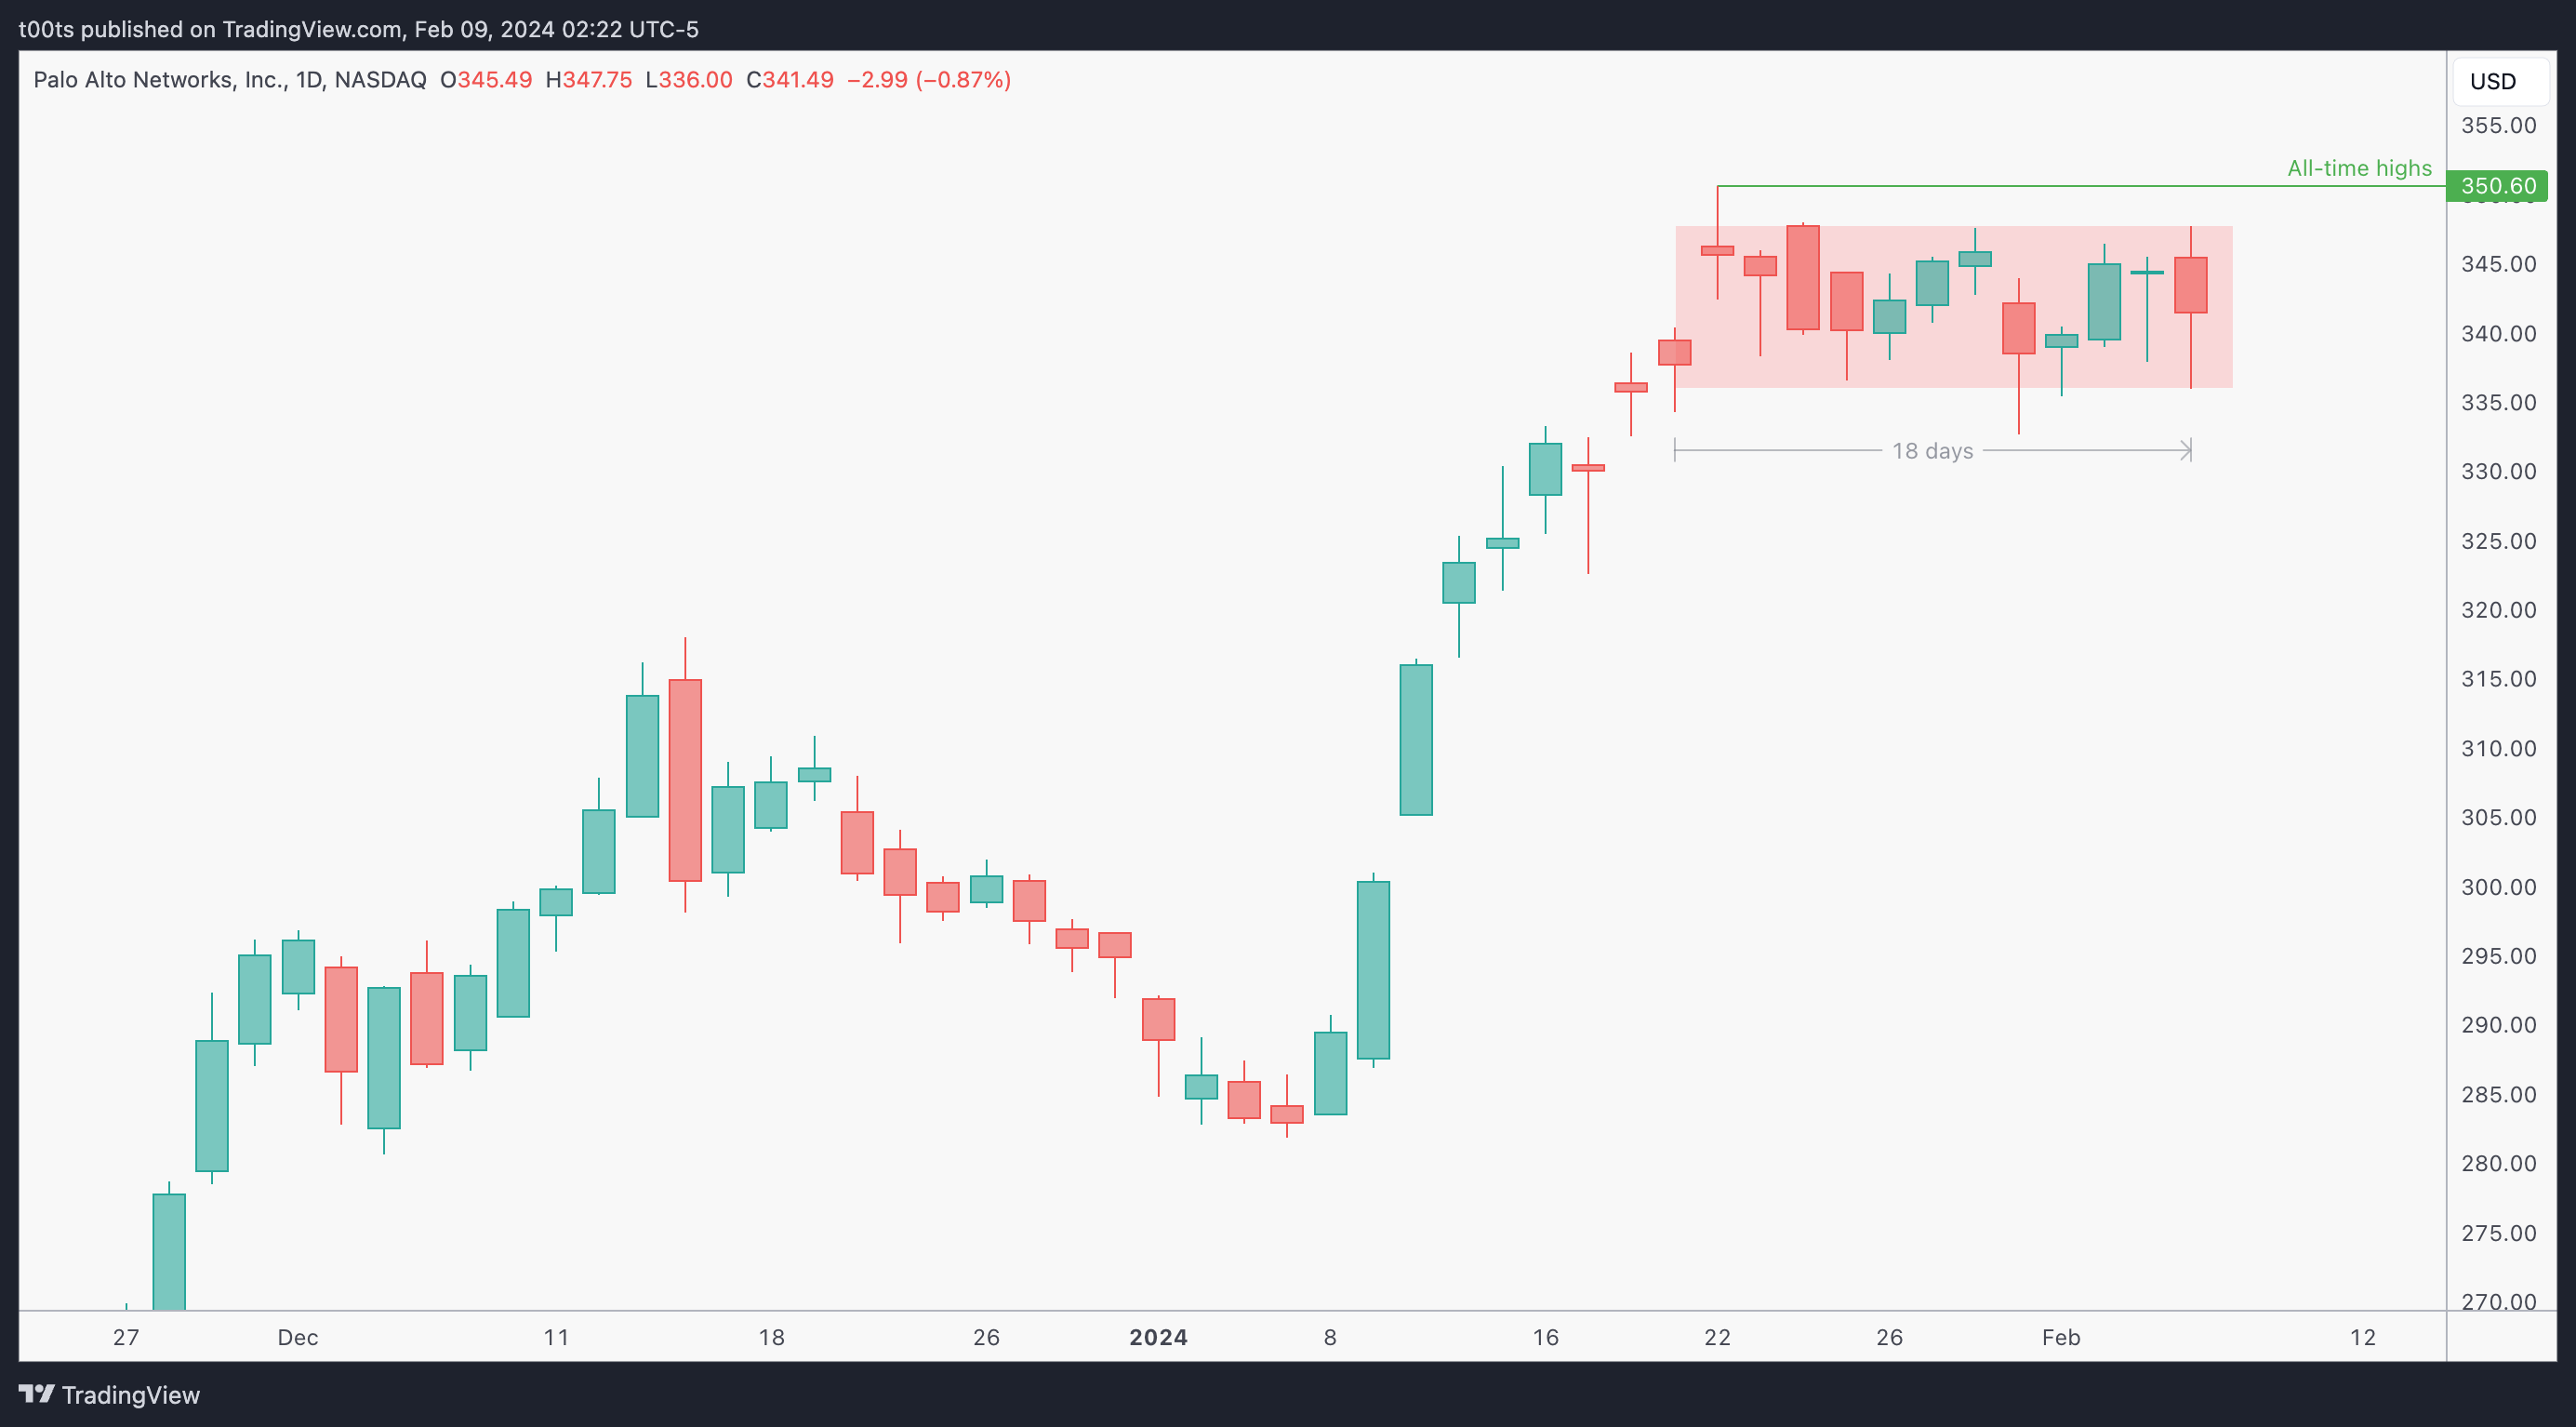
Kept this chart simple for a reason. Notice how price has been in a tight ~10pt range for the past 18 days, while sitting at all-time highs.
This consolidation is setting us up for a continuation move higher, and all we had to do was set alerts around the $350 area, which is not only a psych. level but also the current all-time high level for this stock.
Hourly chart
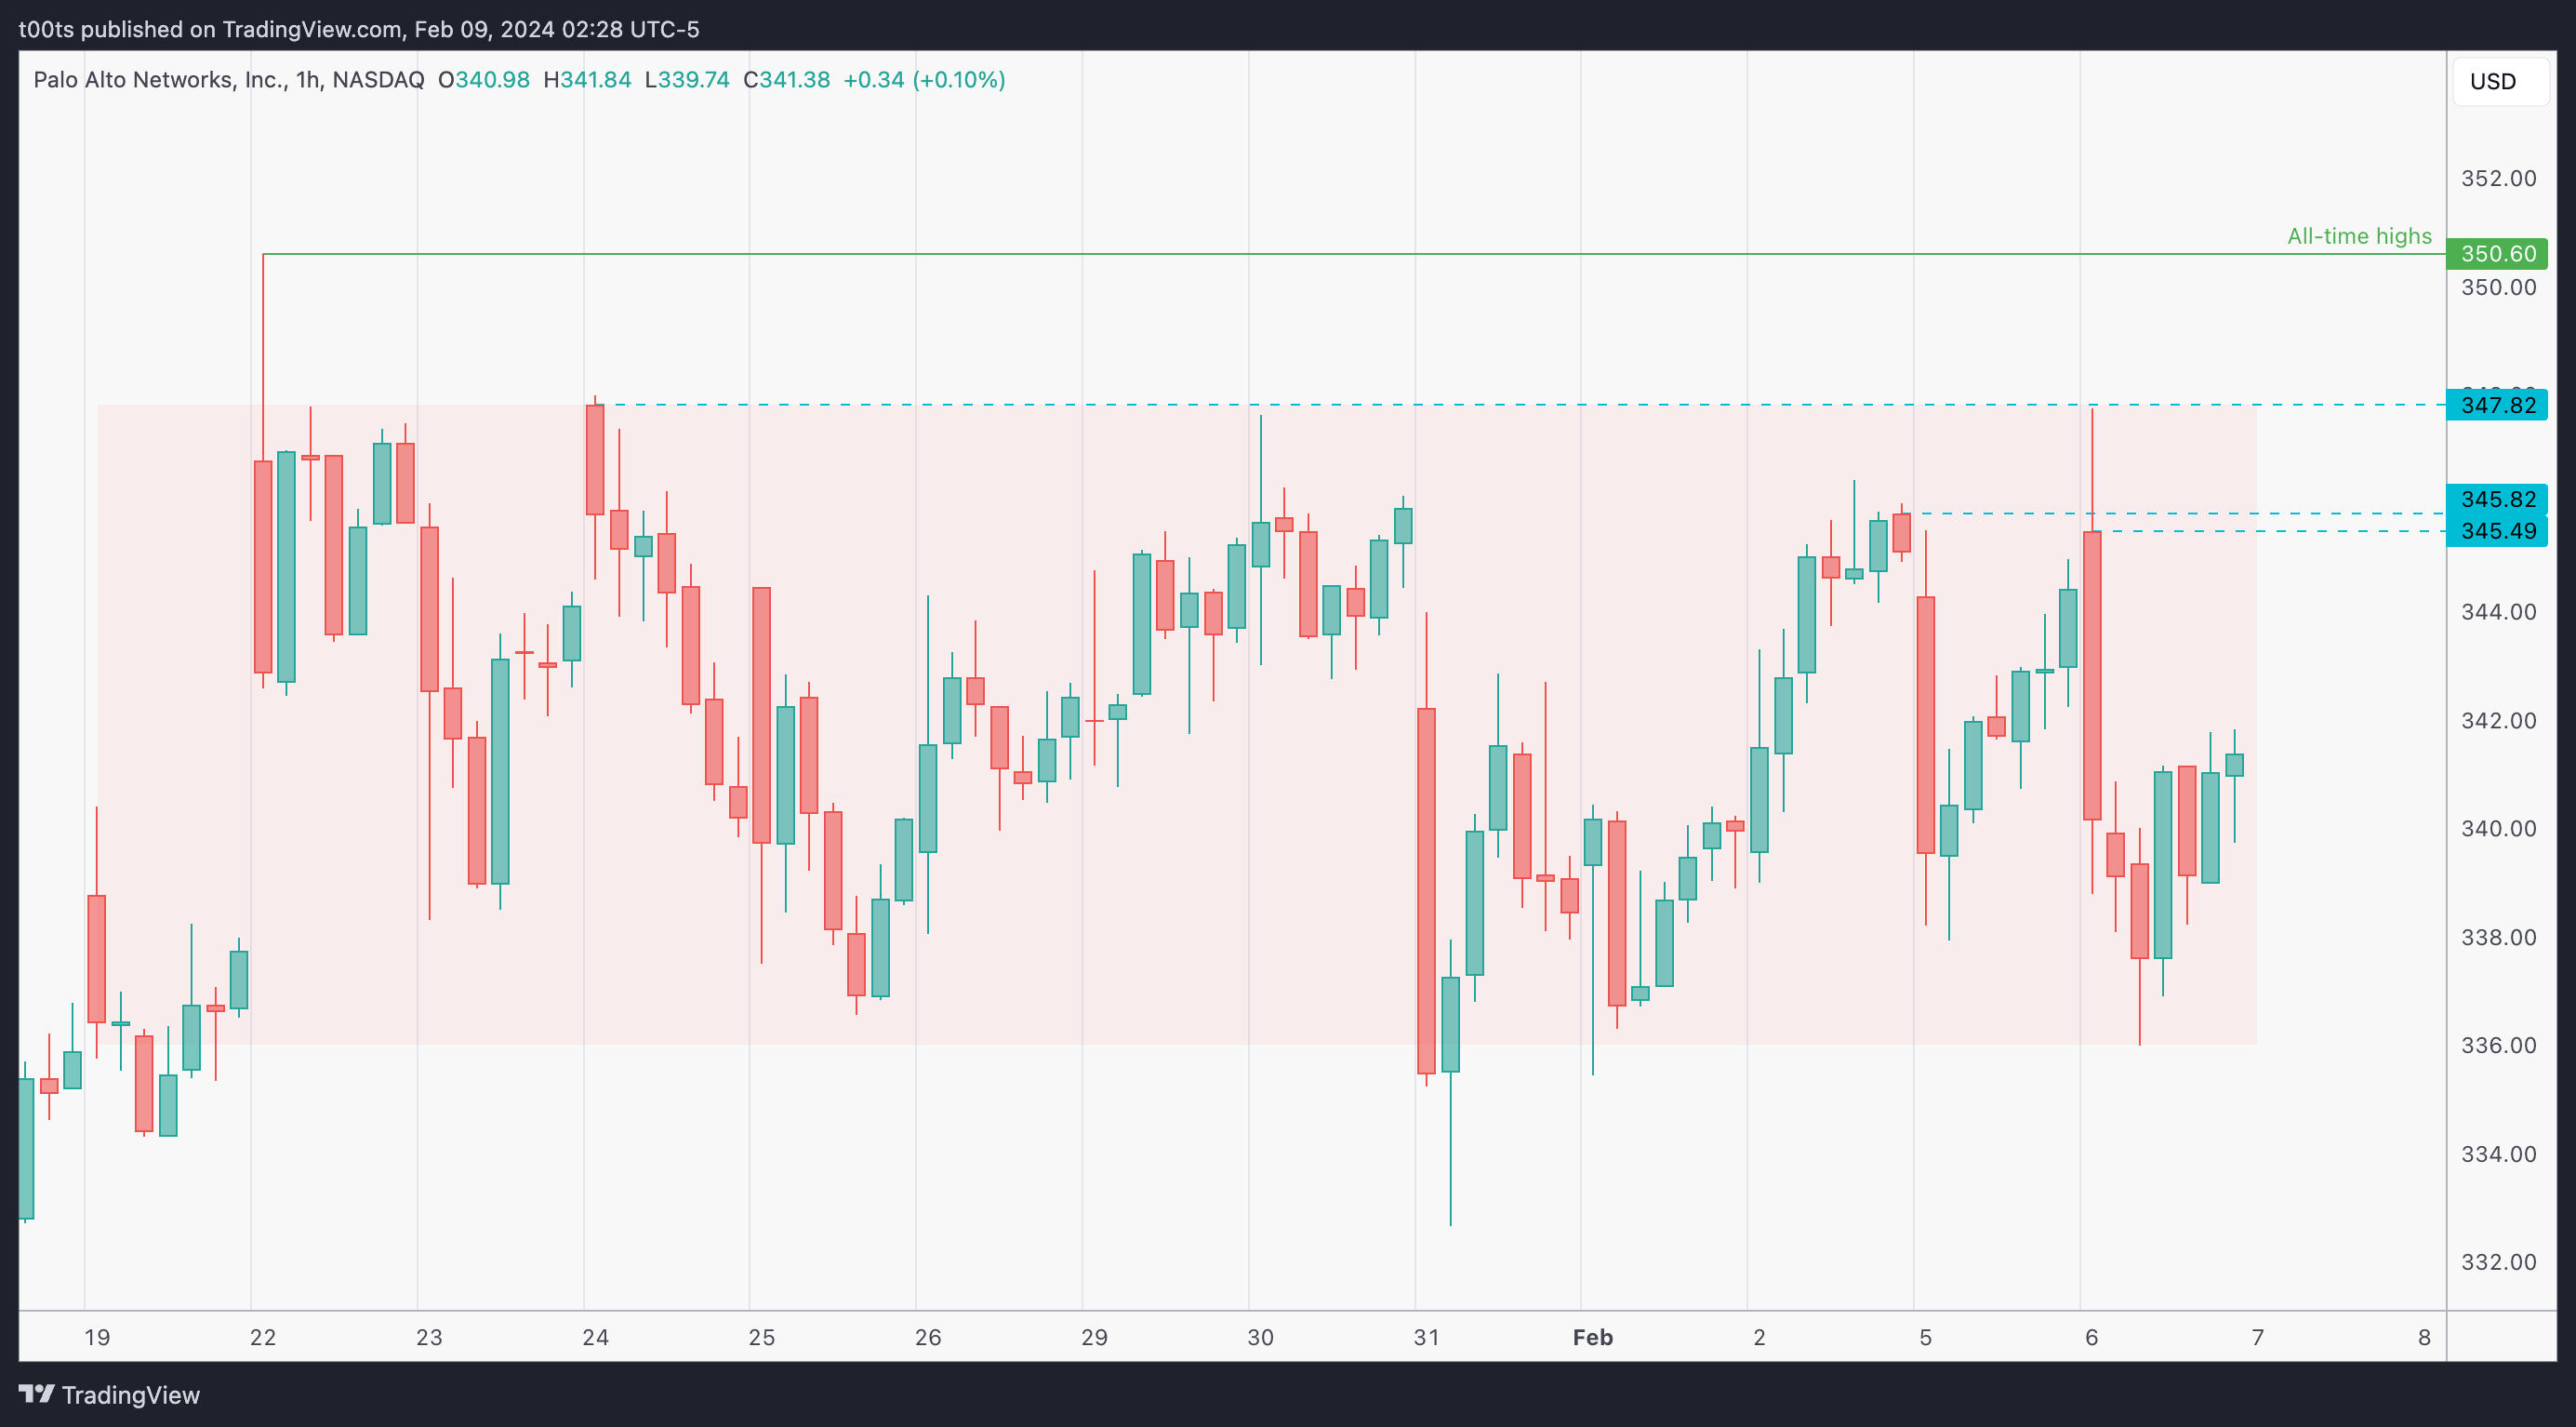
This hourly chart just highlights the range we just saw on the daily chart above. Our main level of interest is $347.82, marking the top of the range, and of course the $350 psych. level that is very close to the current all-time highs at $350.60.
Pre-market action
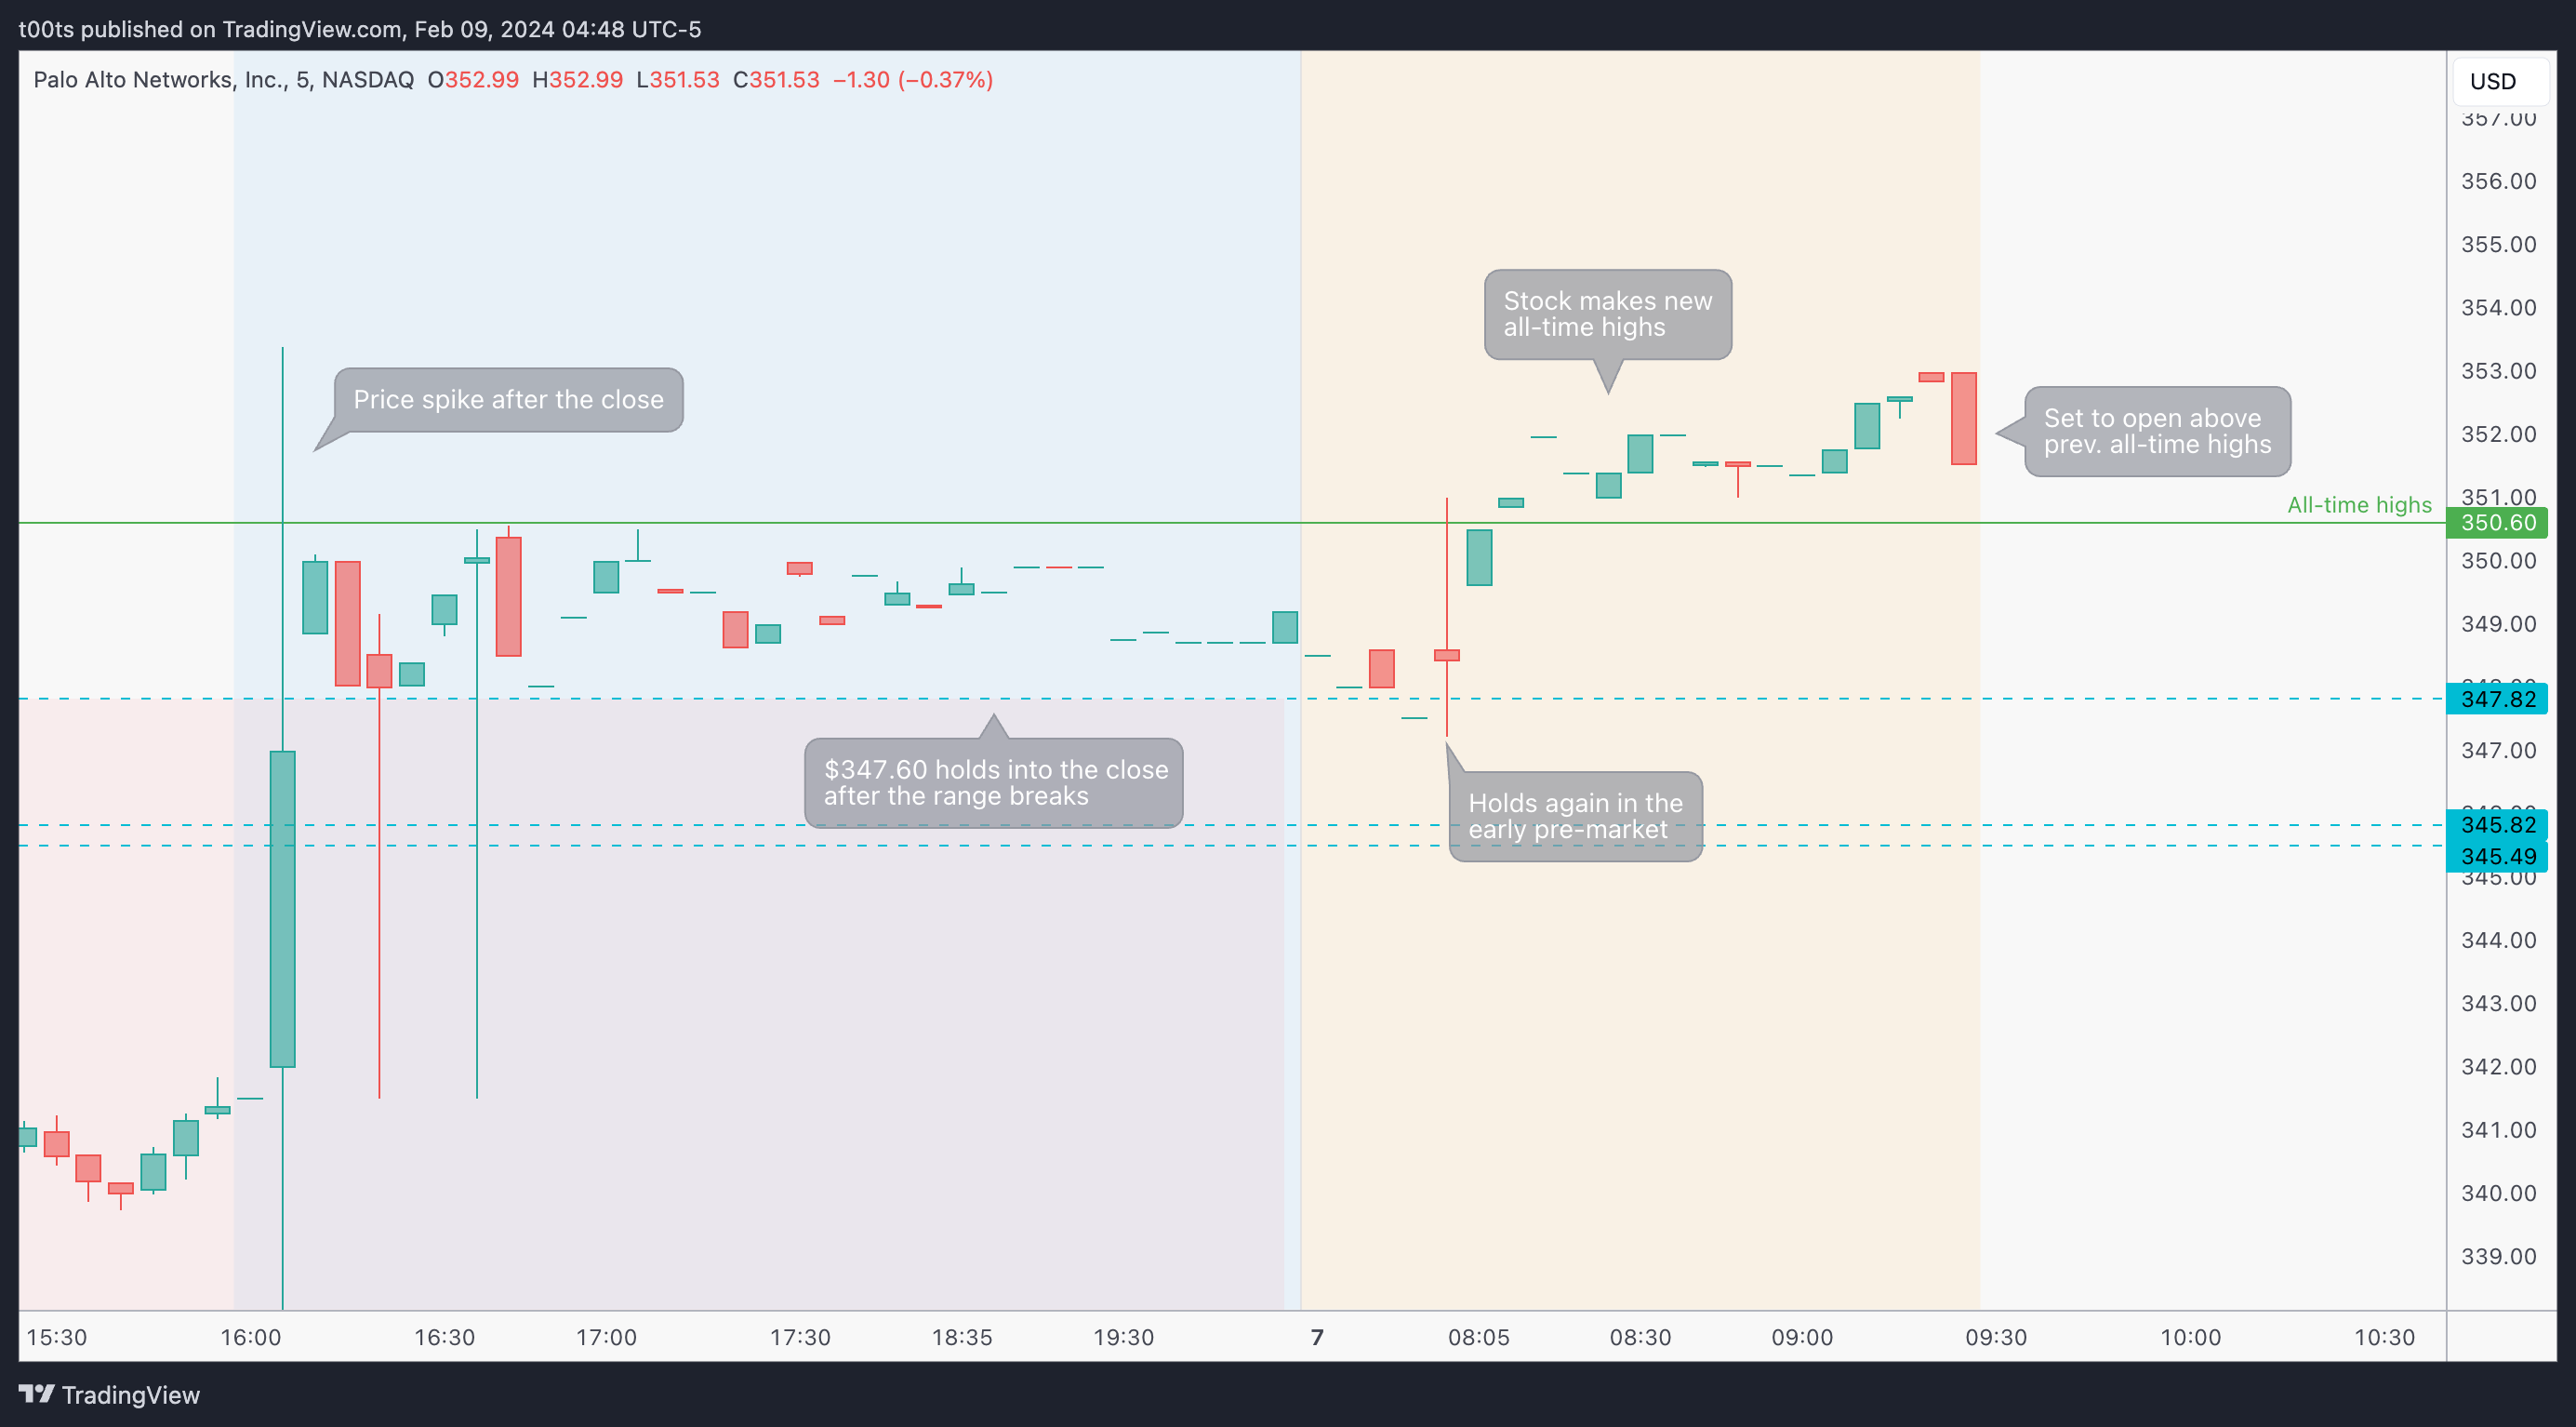
This is what brings the chart to our attention. Two things are important:
Price breaks out of the range in the after hours and our $347.82 level holds all the way into the close.
Price is set to open above the previous all-time highs (and the $350 psych. mark)
The trade
Using our CPT Framework:
Cue(s)
Sector leading stock
Weekly chart in a strong uptrend
Long and tight consolidation at all-time highs
Daily range breakout in the after-hours session
Gapping above a red day (leaving sellers trapped)
Gapping above previous all-time highs and $350 psych. mark
Intraday cue: Strong bounce at the $350 area
Plan
We're gapping up above all-time highs and breaking out of a long consolidation. We're obviously only interested in longs, and we have two levels we can trade off of: $347.82 and the $350 psych. mark. Any bounce of either of those levels is a strong candidate for an entry.
Trigger(s)
If price bounces off the $347.82, buy if/when $350 is reclaimed.
If price bounces off the $350 psych. mark buy immediately risking the lows.
2m chart (entry details)
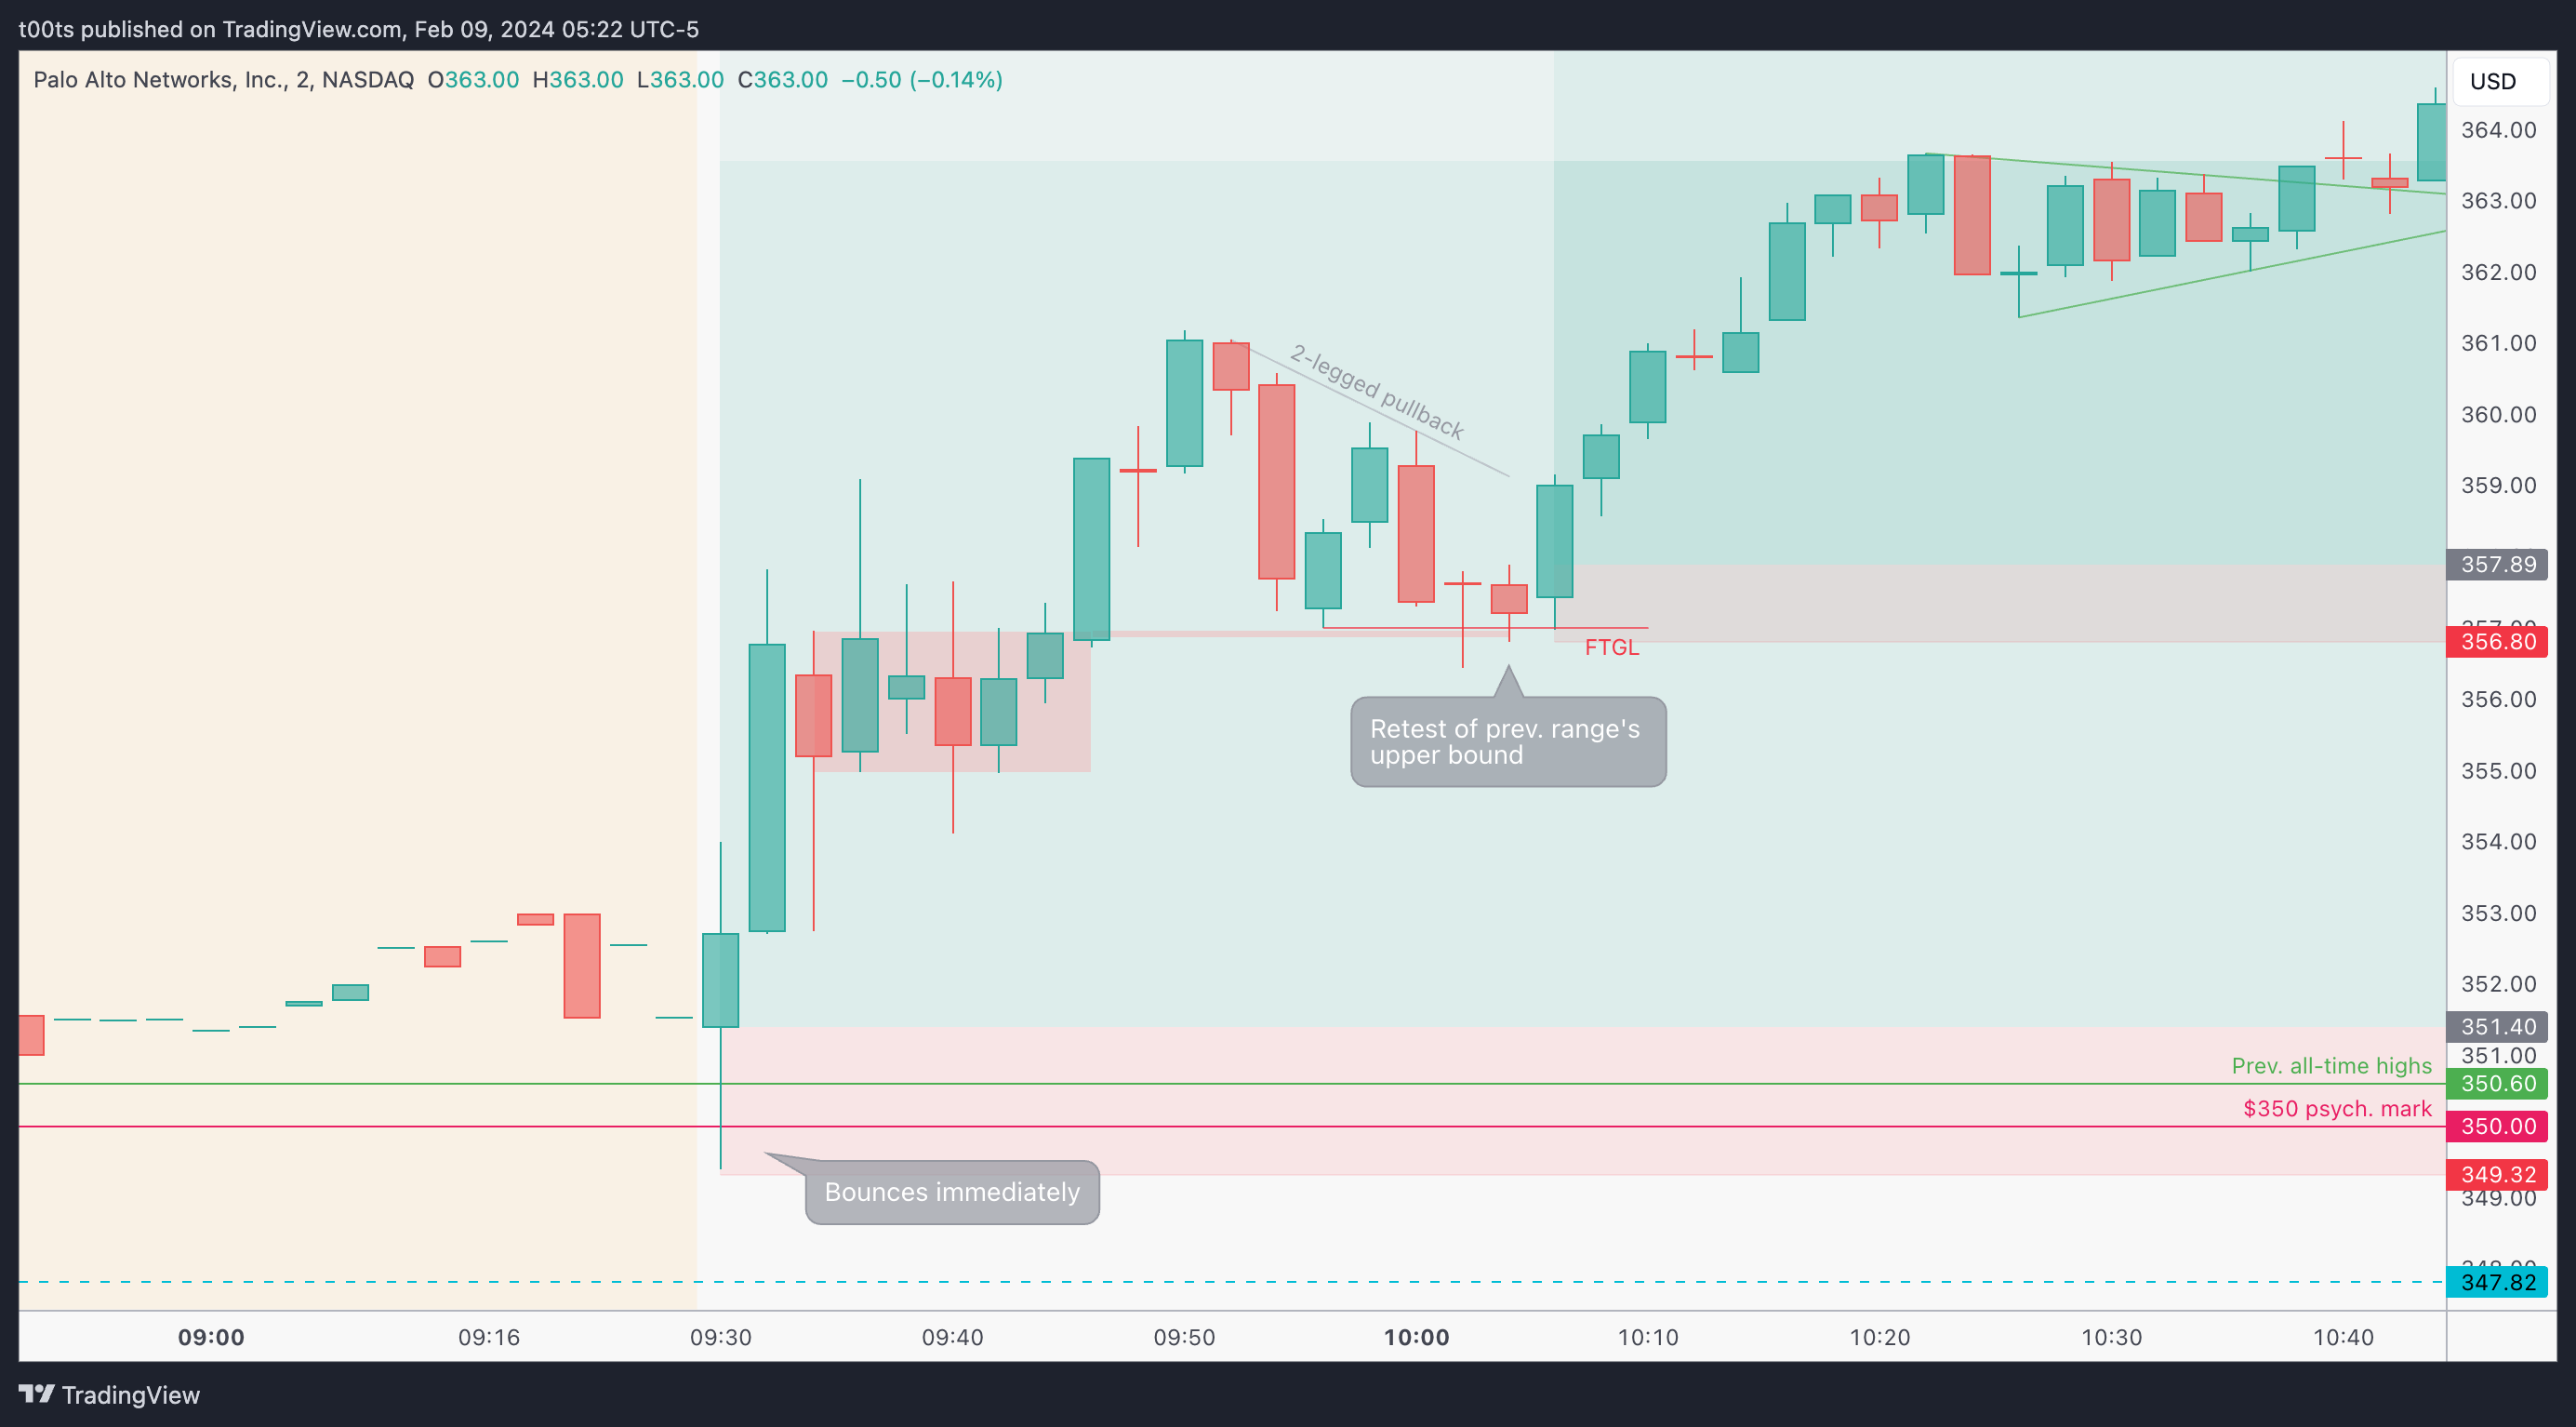
No one should be surprised on how quickly price bounced at the $350 area. We've covered similar setups and honestly the conditions for buyers are extremely favourable (see all the cues listed above), especially as we break out of this tight long range into new unexplored territory.
The immediate reference everyone is watching is that previous all-time high level, which very conveniently matches a round psych. number.
Our first entry should be somewhere around there. Especially the moment price reclaims the opening print you're all set to jump in, risking a couple points to the low of the day at that time. That's a very acceptable risk given the conditions we've outlined.
The trade works immediately and leaves us in a comfortable position to manage our trade. We do get a fair bit of chop for a few minutes but no one should be worried yet. If we have all these conditions aligned, zoom out and let your trade work.
I used to watch every tick and jump out of good trades early because I was focusing on the wrong thing. This 2m chart is just to highlight entries, don't drown yourself in this action or you're likely to make a decision off the wrong information.
Before moving to the 5m chart, I'd like to bring to your attention that second entry the stock offered after 10am. We're coming from a two-legged pullback (you know how much I love these by now) and price fails to close under the first low, setting the stage for a next leg higher. This was a great place to either add or get involved if you were not in.
5m chart
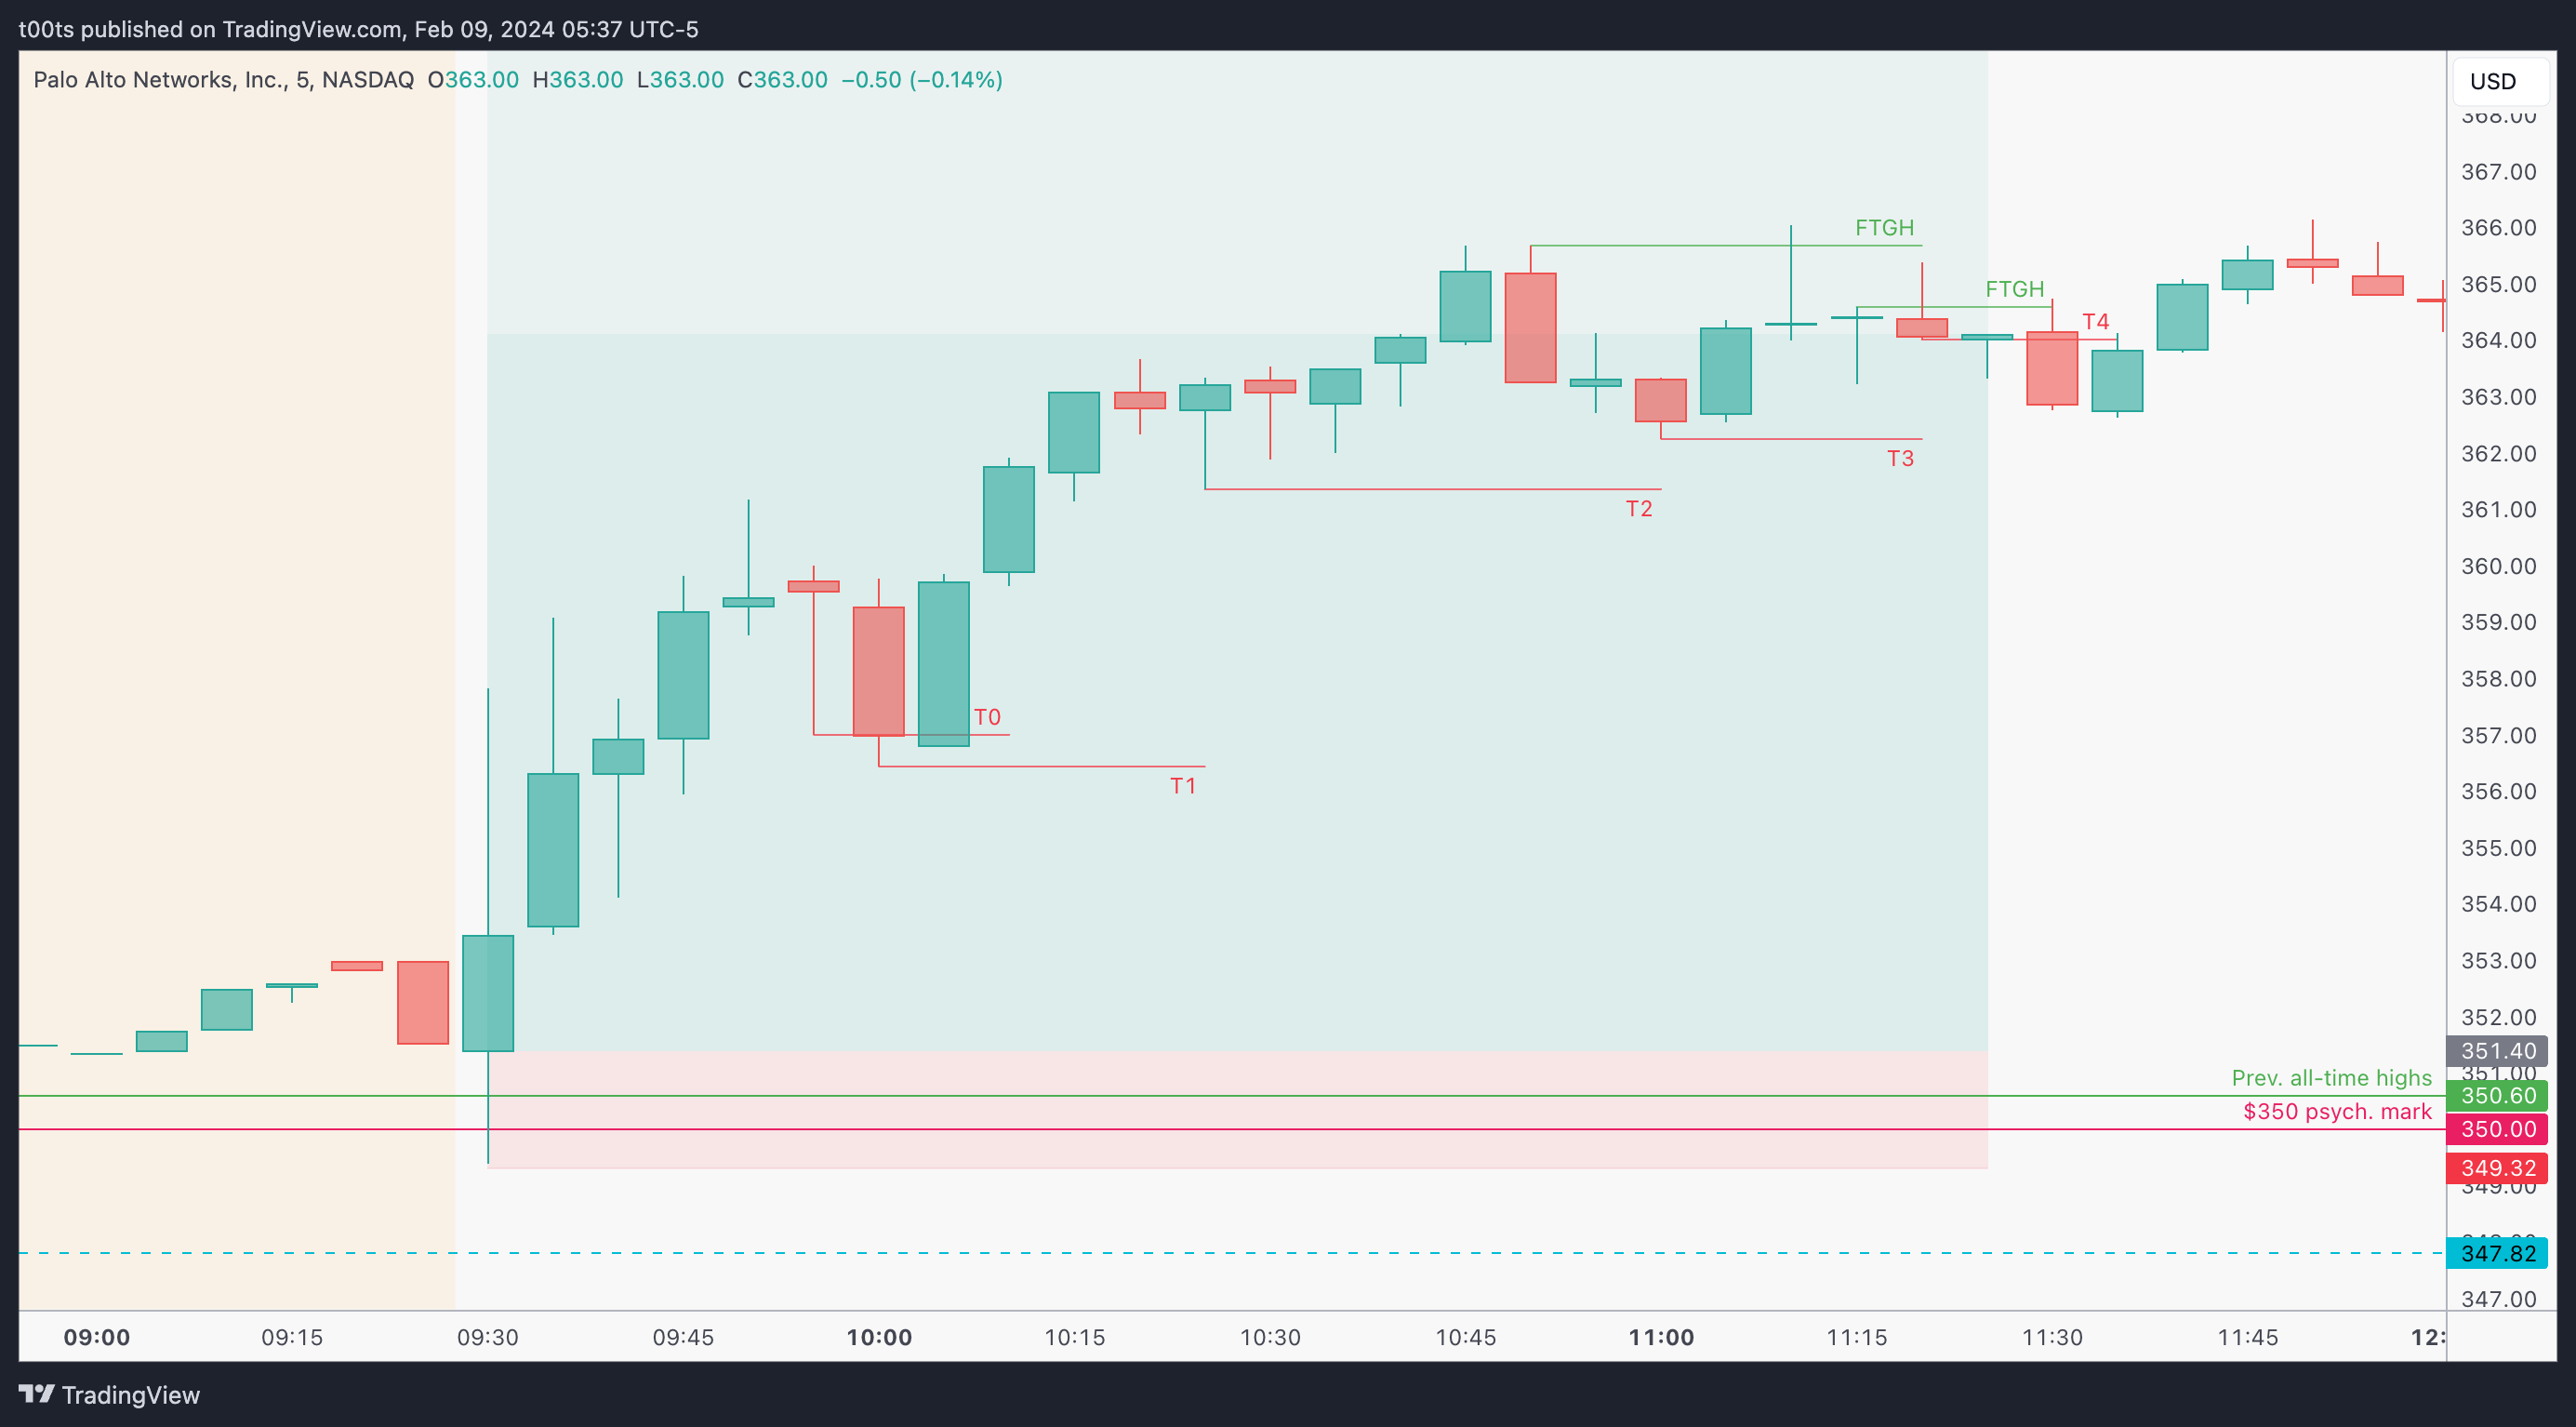
This 5m chart as it shows the trend more clearly and allows us to make better decisions while managing our position. I'll solely add a note on our trails:
T0 is the obvious first stop you'd place after that strong wick. And while it technically gets triggered, if you were watching the lower timeframes it's likely you'd be waiting to see the reaction on that confluence area. Regardless, if you did take your stop here, the 2m chart offered a great follow-up entry immediately after.
T1 is then the first stop we place after our second entry or add.
T2 is the first time we get a pullback after 3 green trend bars. When there's momentum, we want to avoid giving back, thus it makes sense to trail there.
T3 corresponds to the low of the first significant pullback we get after our second entry. As soon as we get the quick bounce, we trail our stop to that low.
T4 is our final exit after two consecutive failures. The first failure is at daily highs. The second failure is a failed failed failure (lol!). We know failed failures usually lead to great trades. This one fails, which makes a strong signal for us to close our position.
Closing notes
In this post we saw one of those trades that you just can't miss. It had all the ingredients to deserve your attention and it offered a couple great entries to get involved.
When a stock holds well during a market-wide pullback, expect it to lead and outperform when the trend resumes. This is an apparently obvious concept, but most of us don't seem to give it the importance it deserves. I learned this a while back watching one of Kristjan Kullamägi's streams and it stuck with me. It was simple and easy to understand. In trading, simple and easy can take you very far. Palo Alto Networks is a great example of that concept in practice. That weekly chart we saw above speaks volumes of how well this played out.
I am posting one trade writeup every day throughout 2024. I focus on large caps using levels and price action. The subscription is absolutely free and will always be. I will strive to provide value by offering clues and ideas for you to enhance your edge. Let’s grow together!