
Palo Alto Networks (PANW) - Feb 9th 2024
A simple bounce play using previous resistance turned support

Higher timeframe context
Palo Alto Networks is the leading stock in the cybersecurity sector, which as a whole has experienced phenomenal growth during the past few years. I dove further into this topic in a recent PANW post (which I strongly suggest you read), so I won’t waste your time here with the details.
Weekly chart
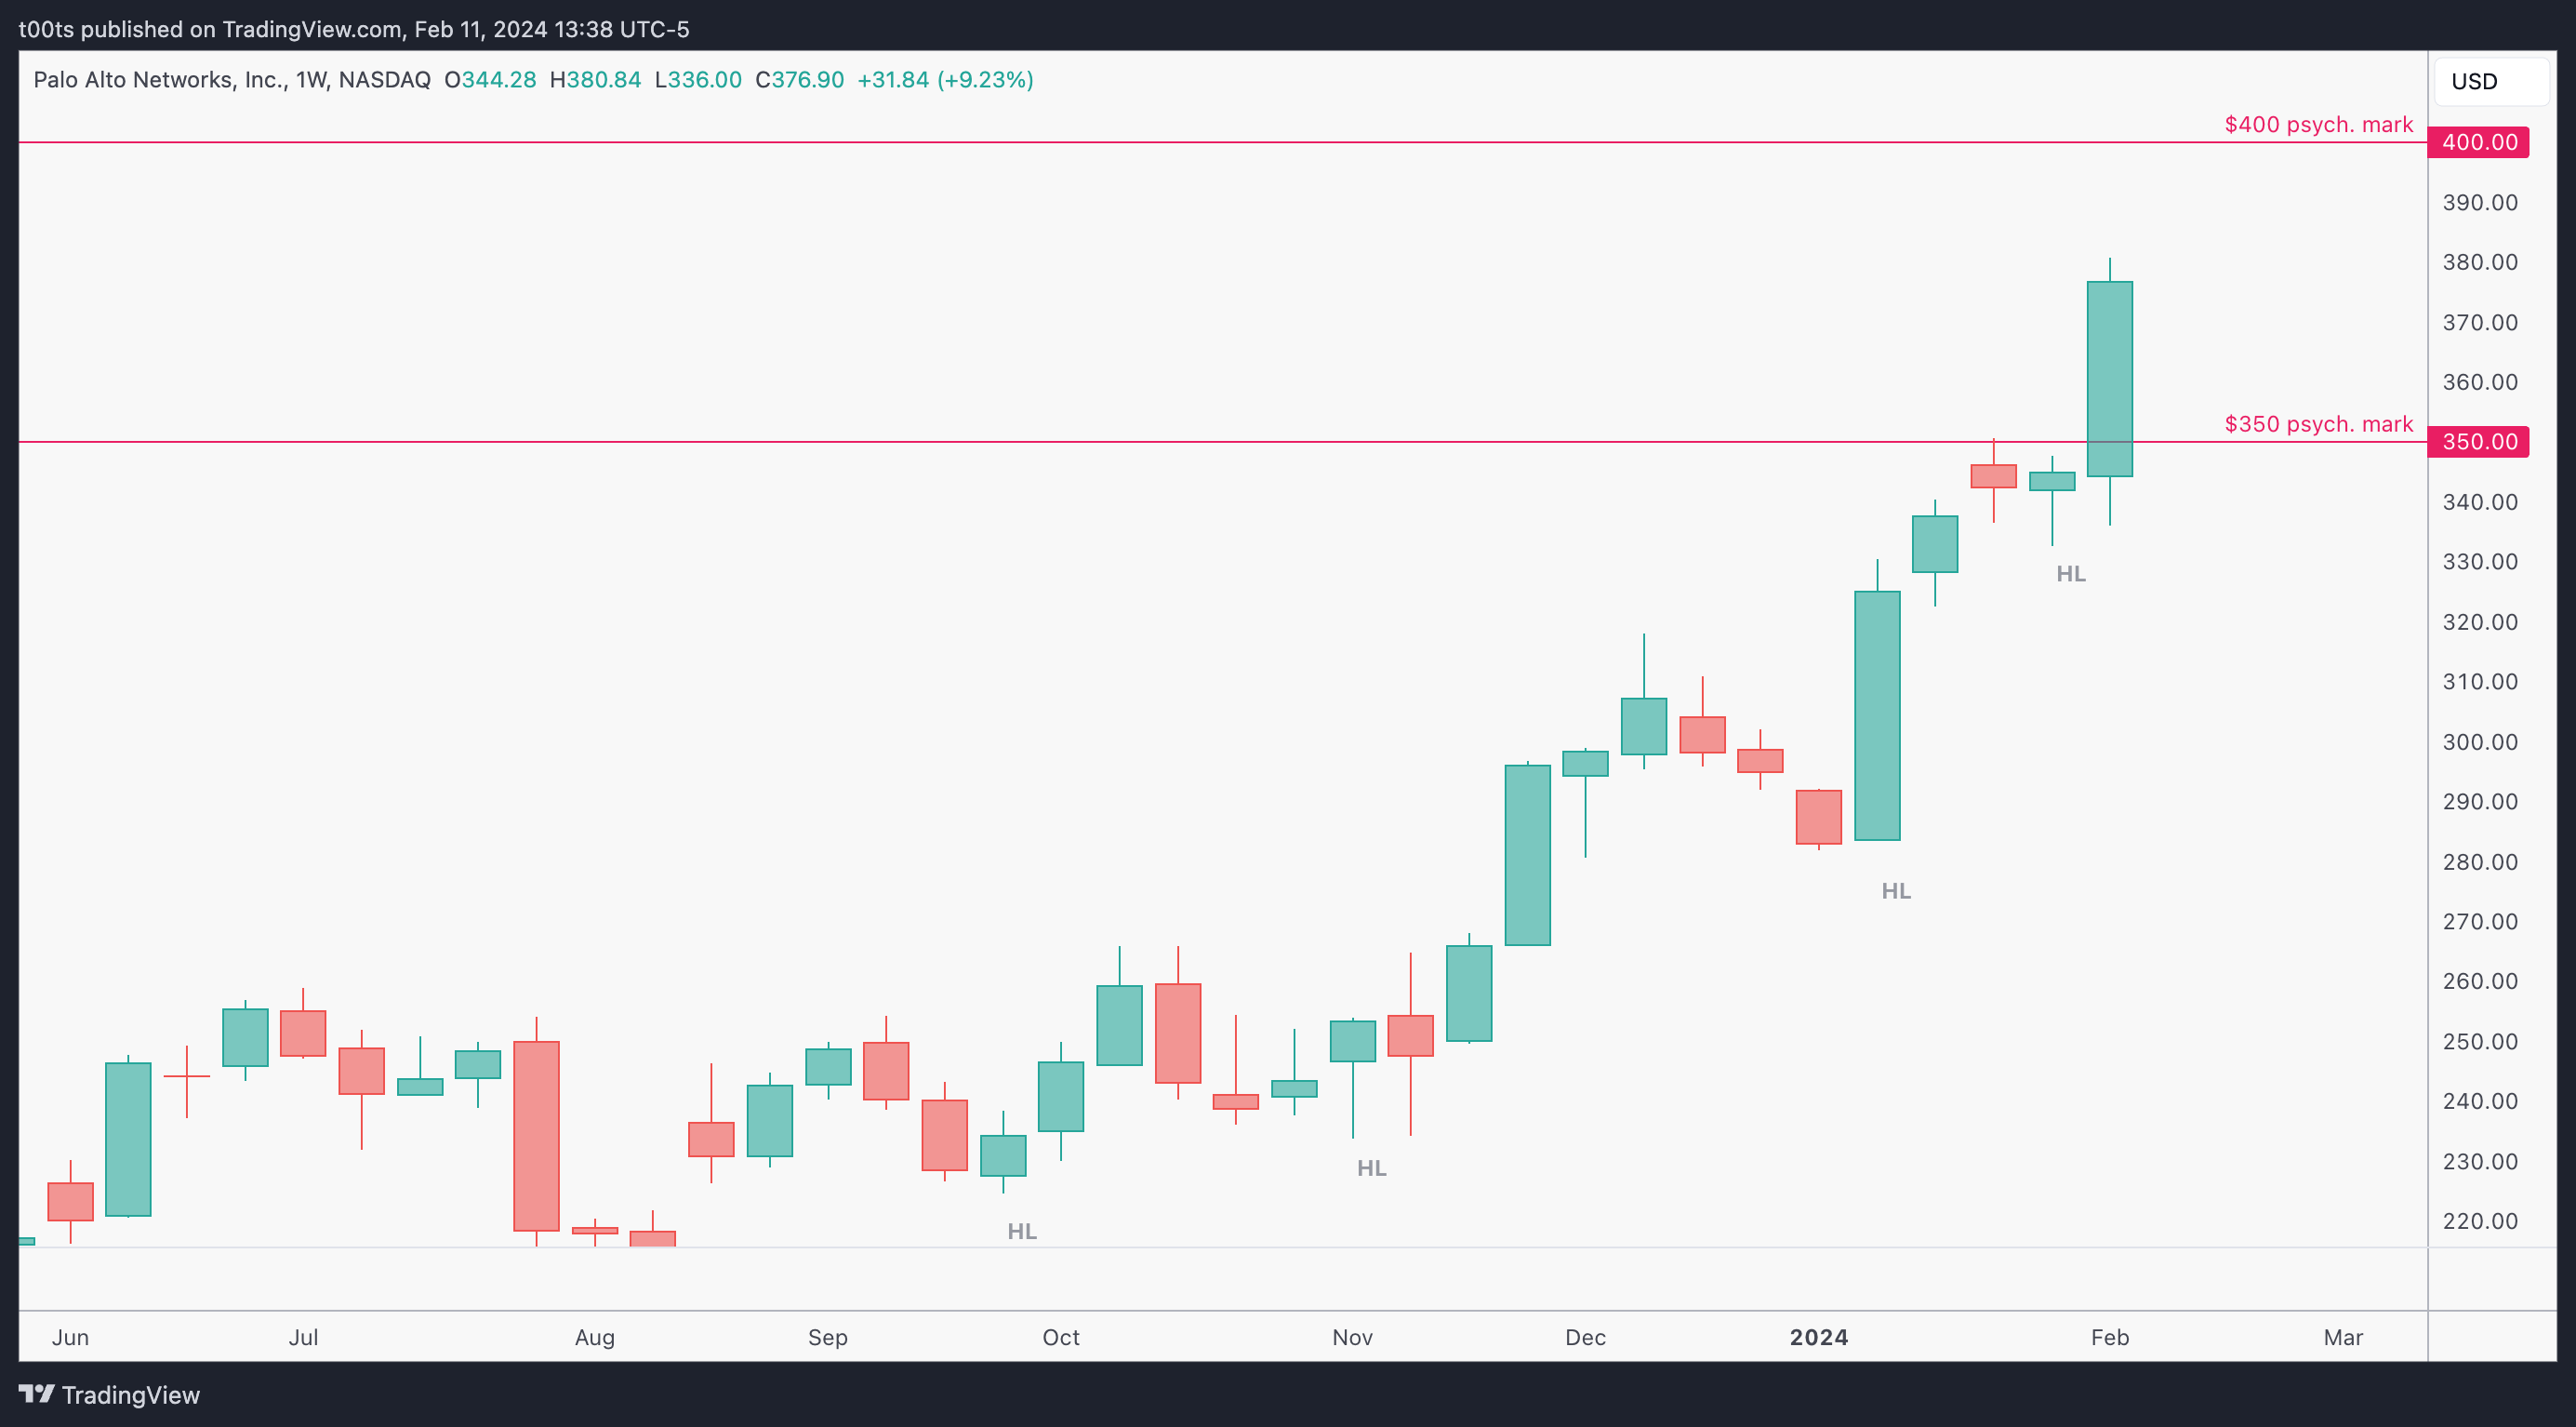
This weekly chart is as strong as it gets. The trend is clean and looks healthy. The stock has been putting in higher lows, giving itself time to rest before every leg up. We recently crossed the $350 mark and judging by the strong momentum, could very well be headed to the $400 next. If this was a 5m chart you wouldn't be surprised to see another green bar.
Daily chart
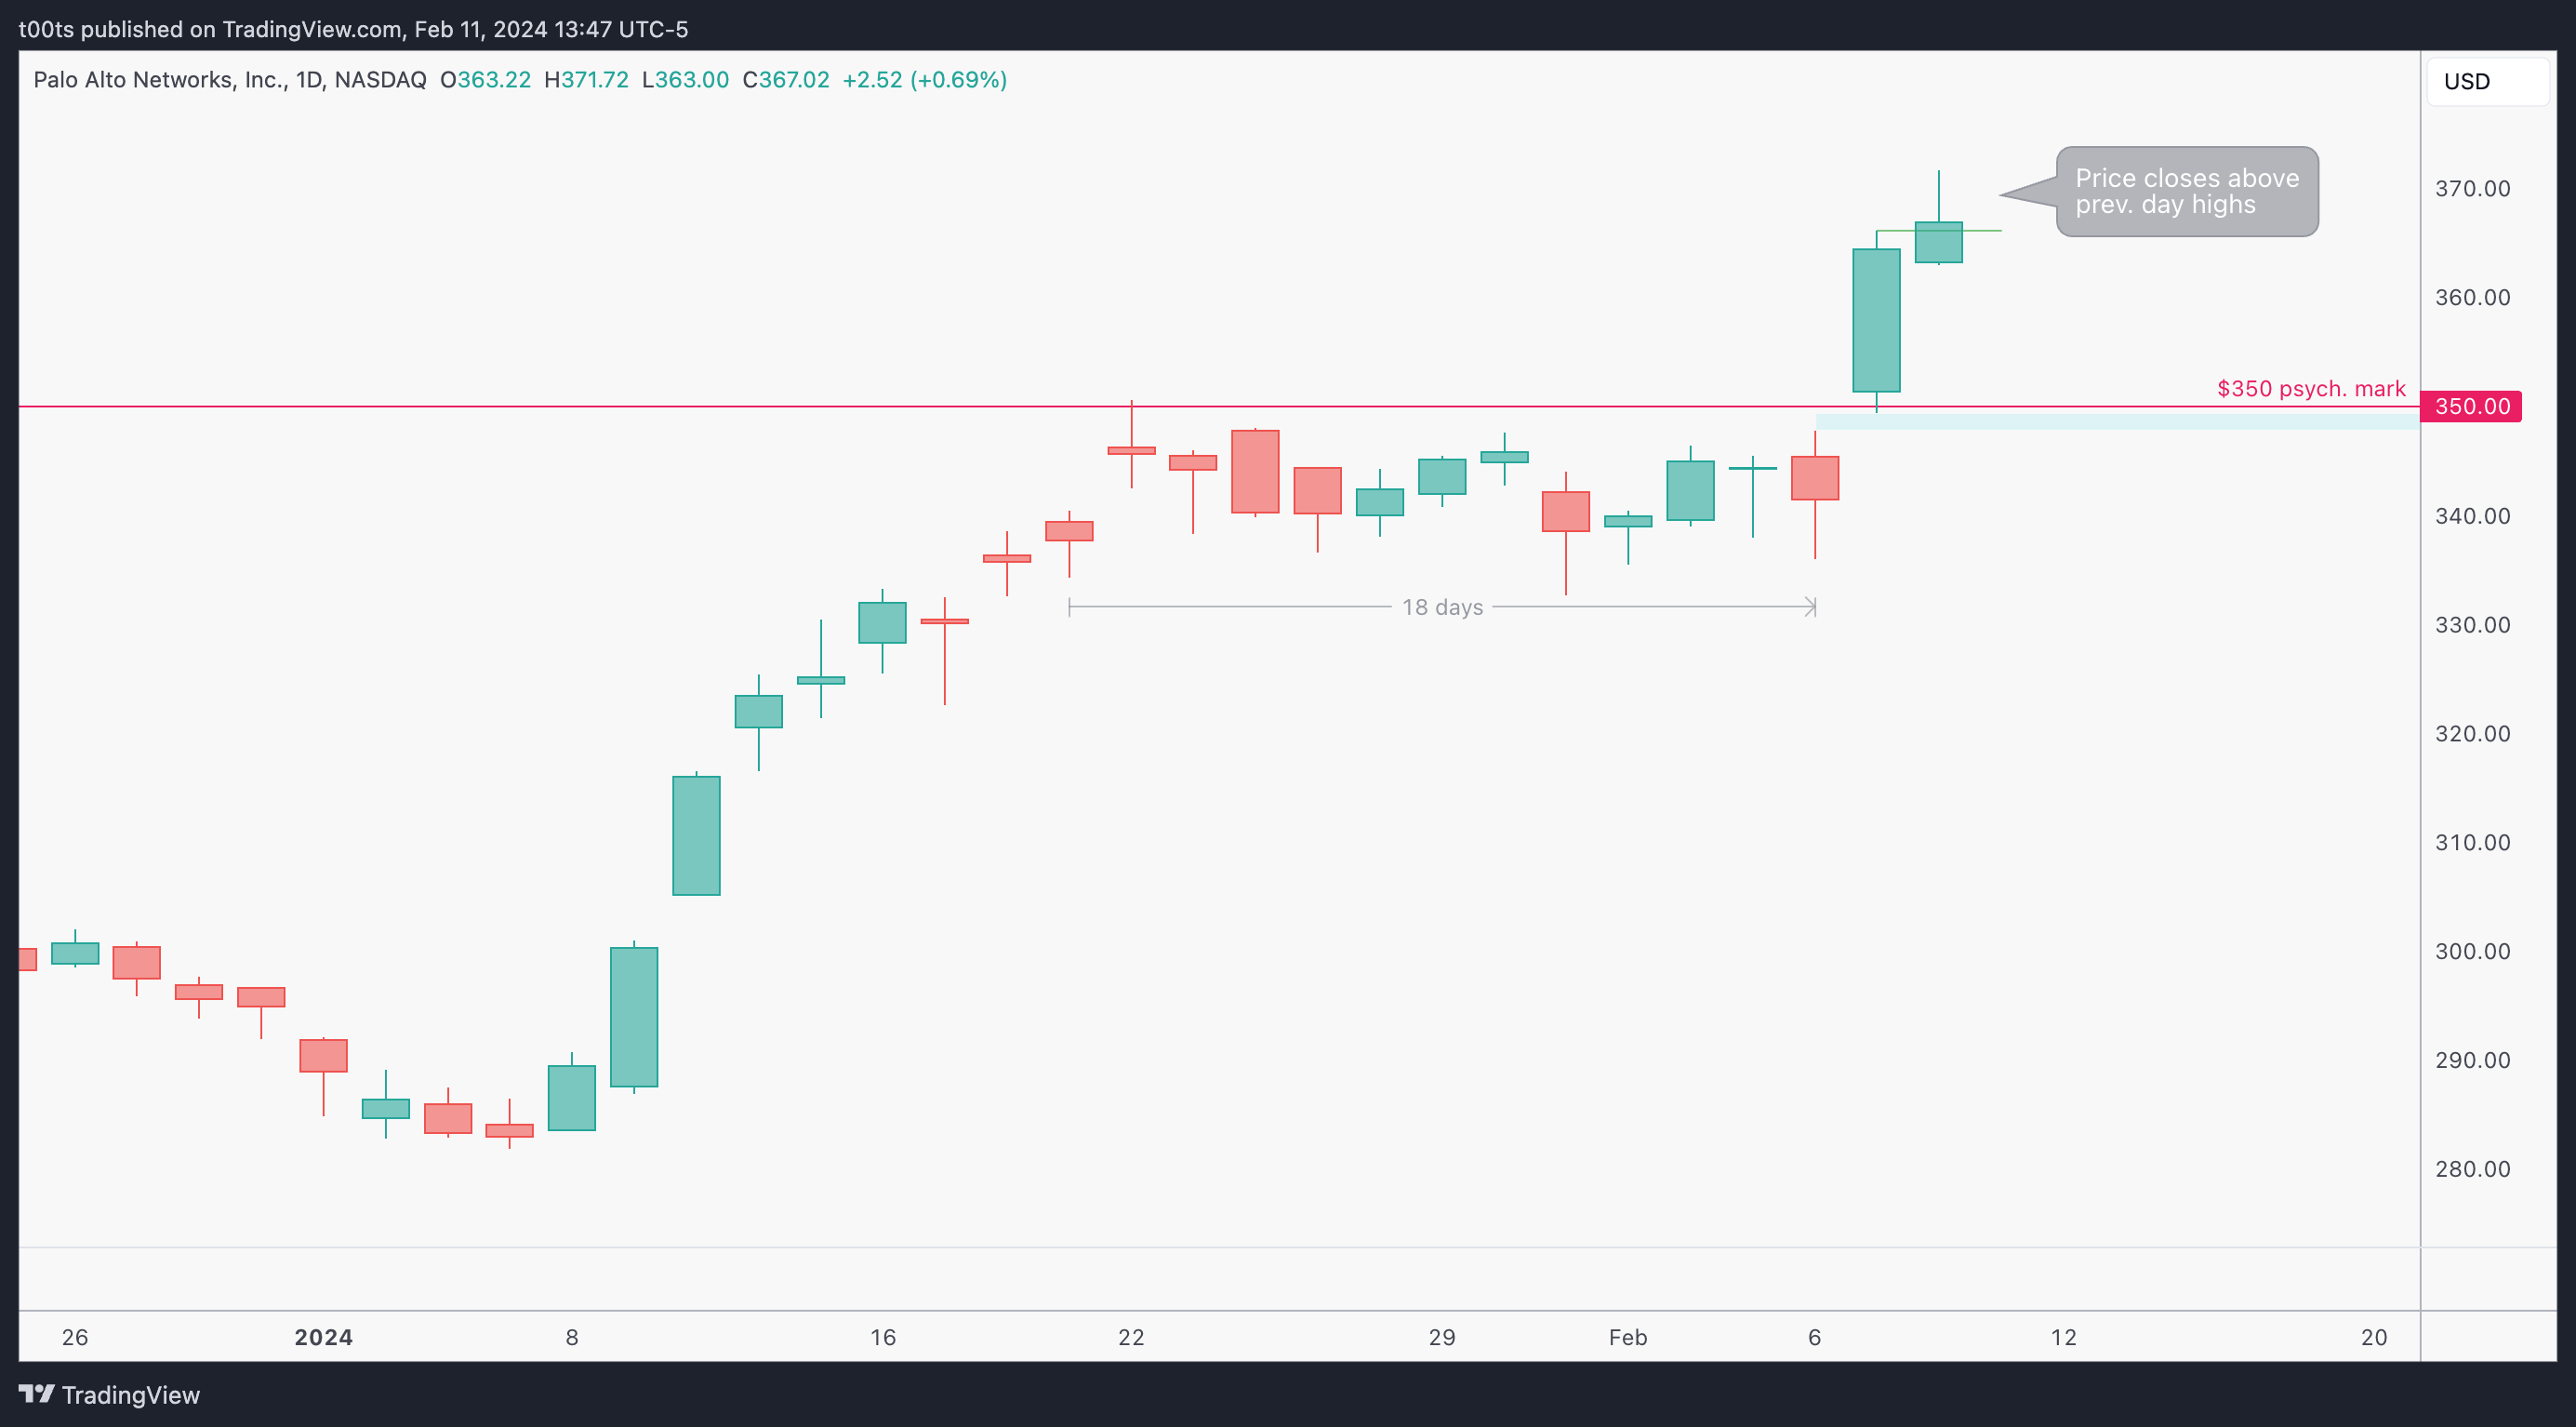
The breakout is still very recent, but remember price consolidated for a little over 3 weeks. This last daily bar, despite not being as strong as the previous one, still closed above previous day highs. So either buyers are still in control or there's not much interest to sell this name.
Think about it: Who would want to sell? Sure, there's going to be big players taking profits into strength. But with the stock at all-time highs, everyone who is long is sitting in profit. Why would they chose to sell? Is there a reason to sell? Not at all!
Hourly chart
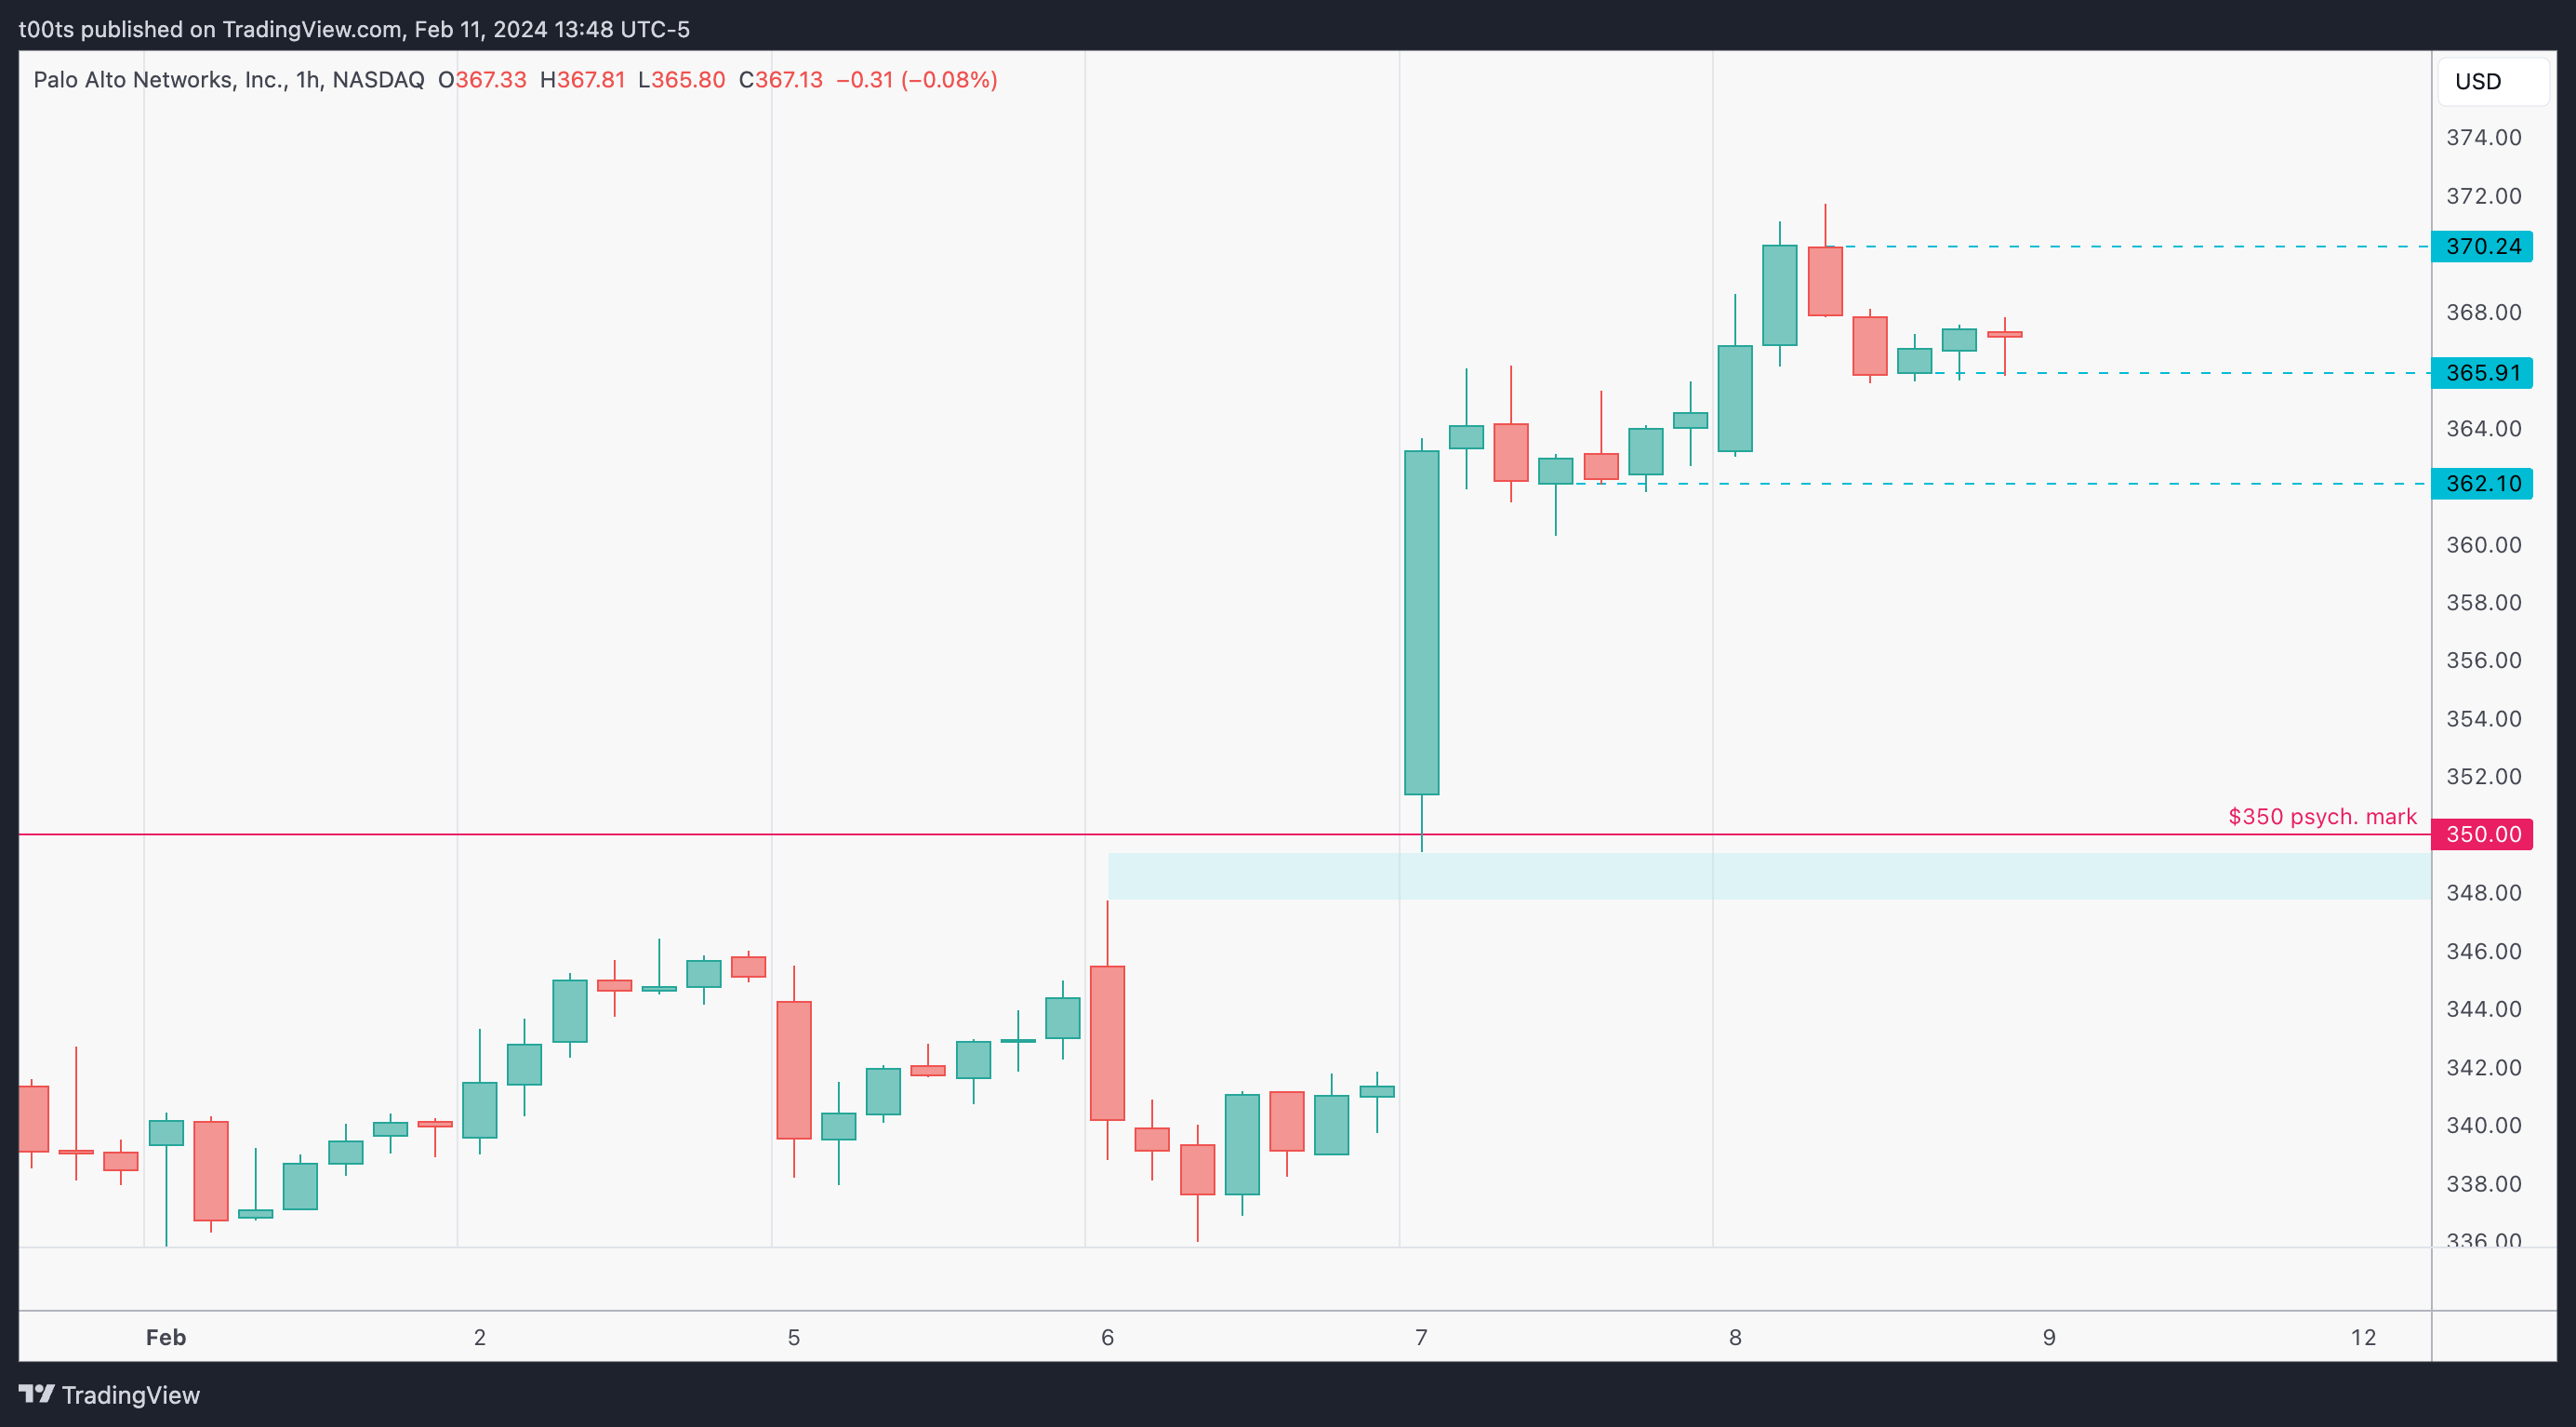
In this zoomed-in chart we can appreciate how price was rejected at the $370 area and left us with a level at $370.24. We're in price discovery mode as the stock keeps climbing into new highs, so round numbers can often act as resistance along the way. Looks like this was the case here.
Pre-market action
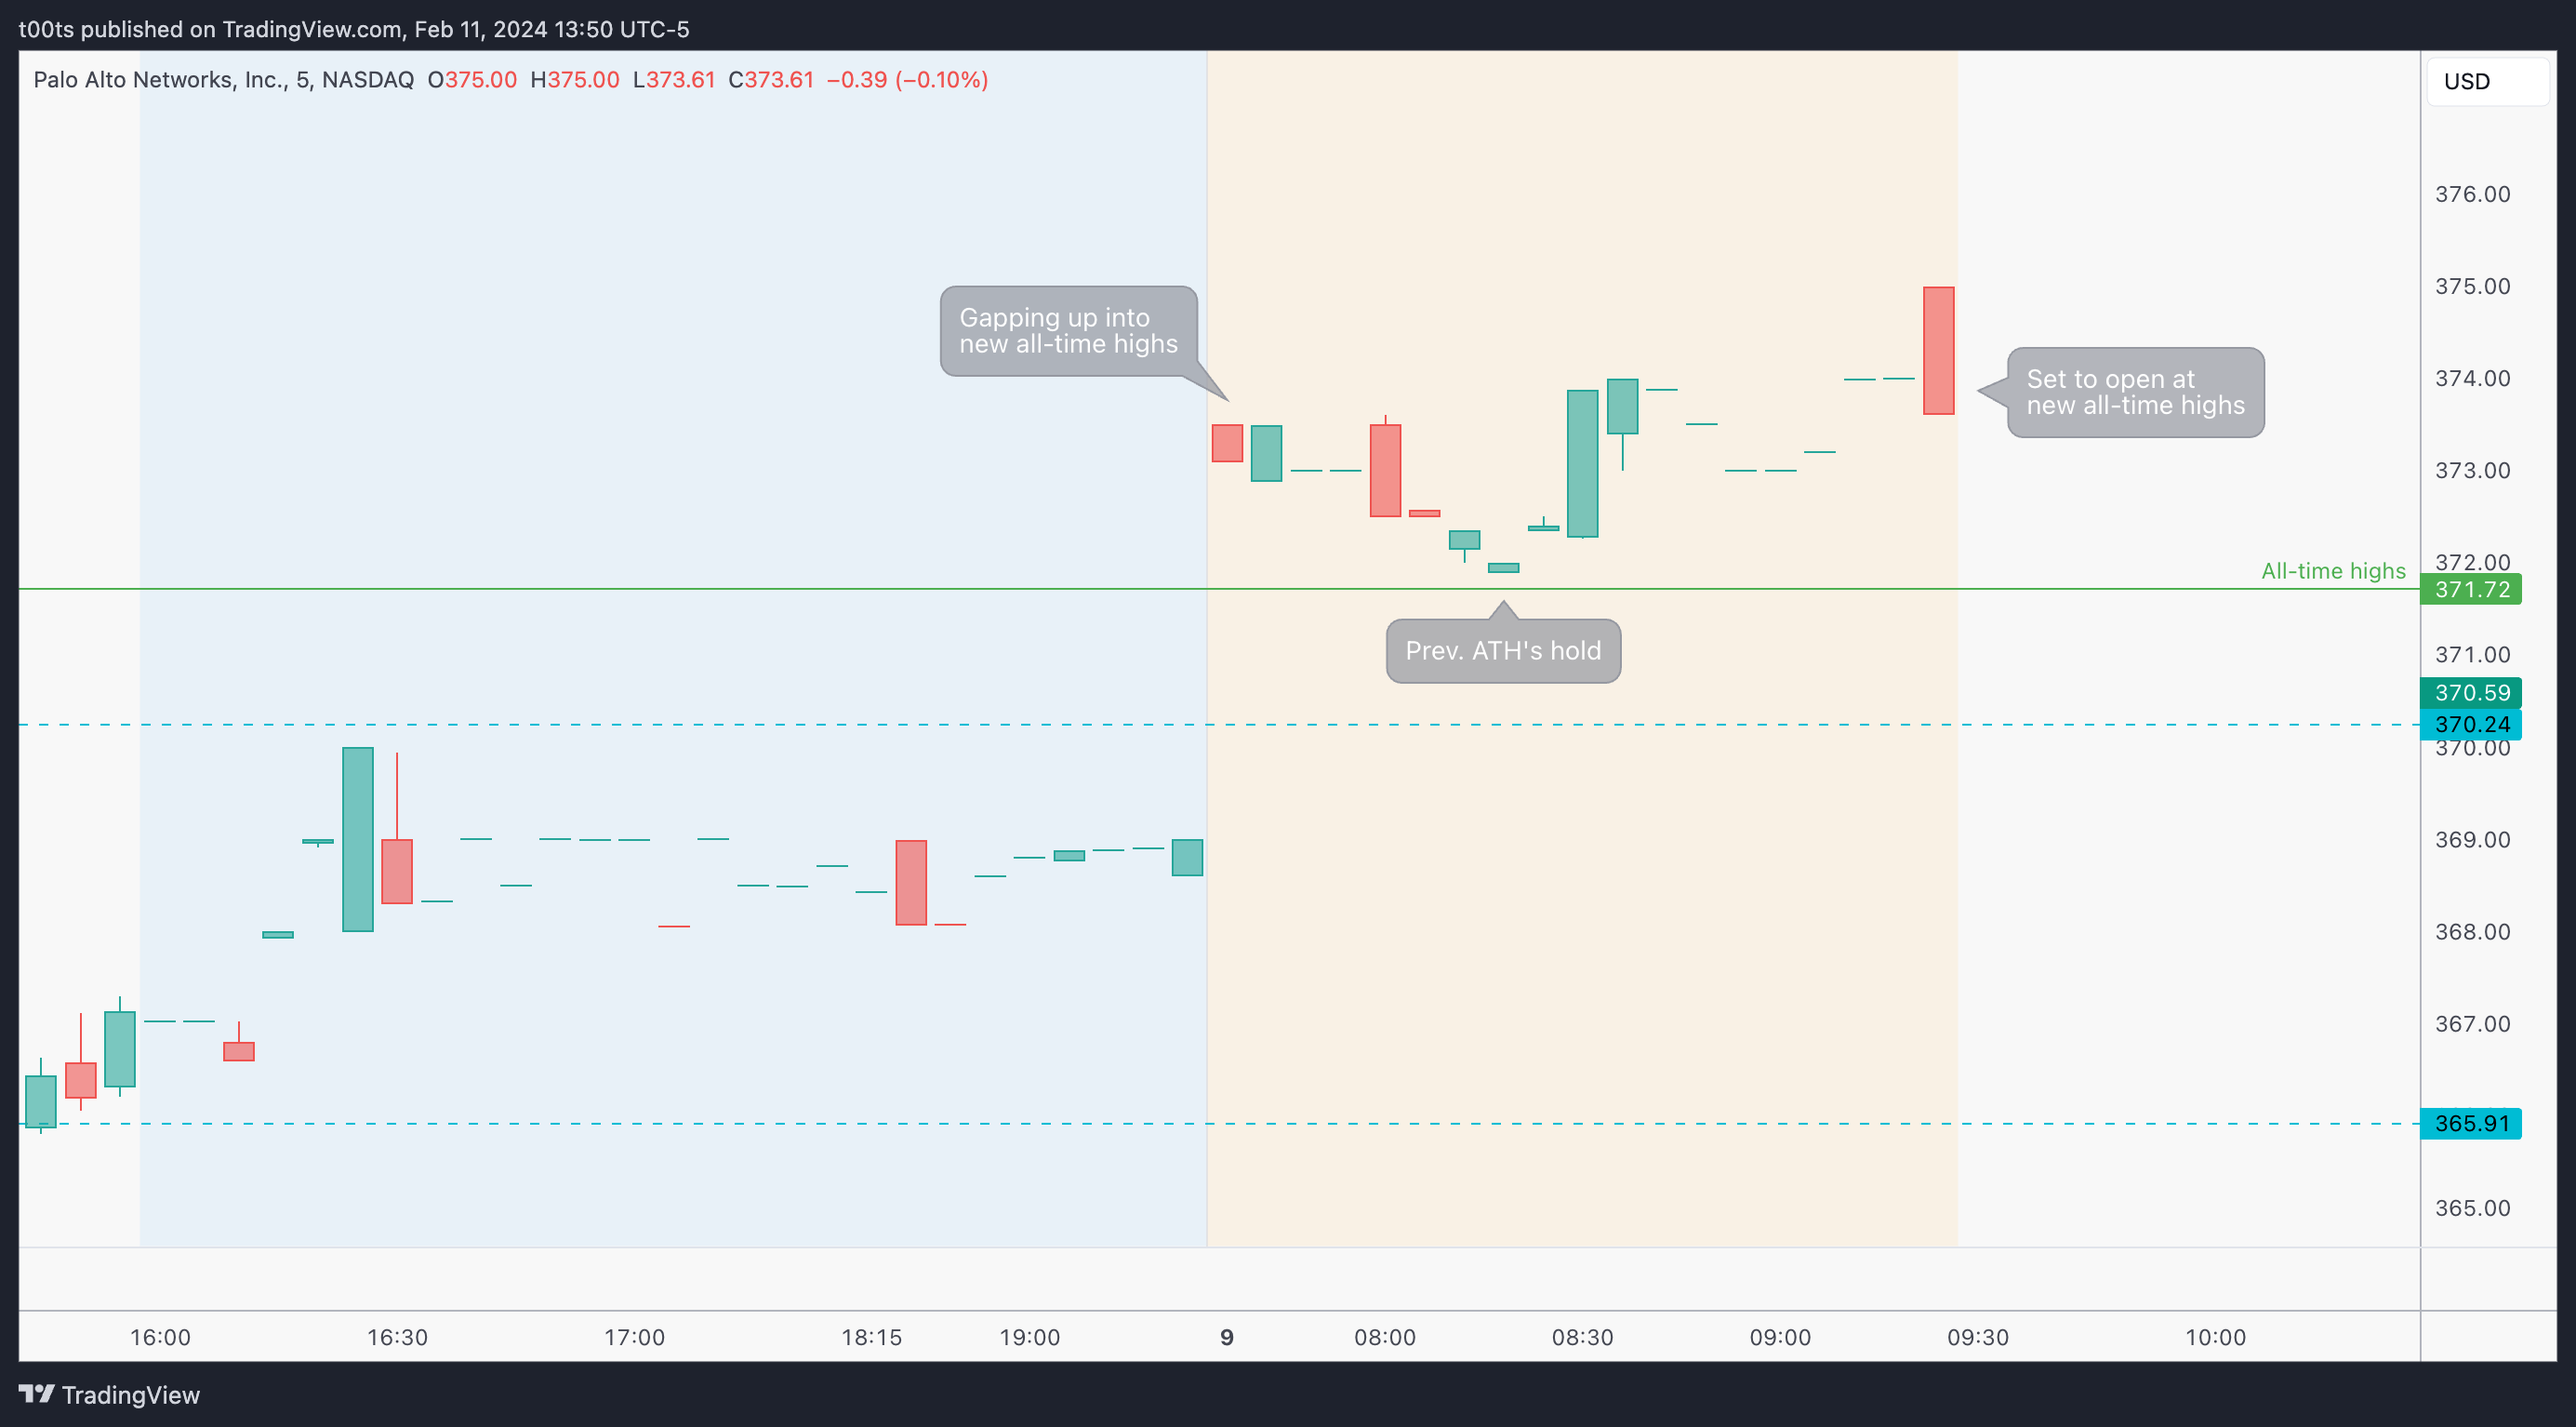
Despite the low liquidity, this pre-market action should catch our attention. Stock is gapping up into new all-time highs. Even on that slight pullback, the previous all-time high level (prev. day high) holds well leading us into the open.
The trade
Using our CPT Framework:
Cue(s)
Sector leading stock
Weekly chart in a strong uptrend
Breaking out of a 3 week long consolidation
Gapping above all-time highs
Intraday cue: Price trading below $370 and bouncing back above $370.24
Plan
In an ideal world we'd like to see price retest the $370 area before continuing higher. It's our previous resistance area and we have a level there we can trade off of. The $380 area seems like a logical target if we do get an entry around $370.
If price doesn't hold the $370 we're not interested in trading this name.
Trigger
Price bouncing off the $370 area near the open
2m chart (entry details)
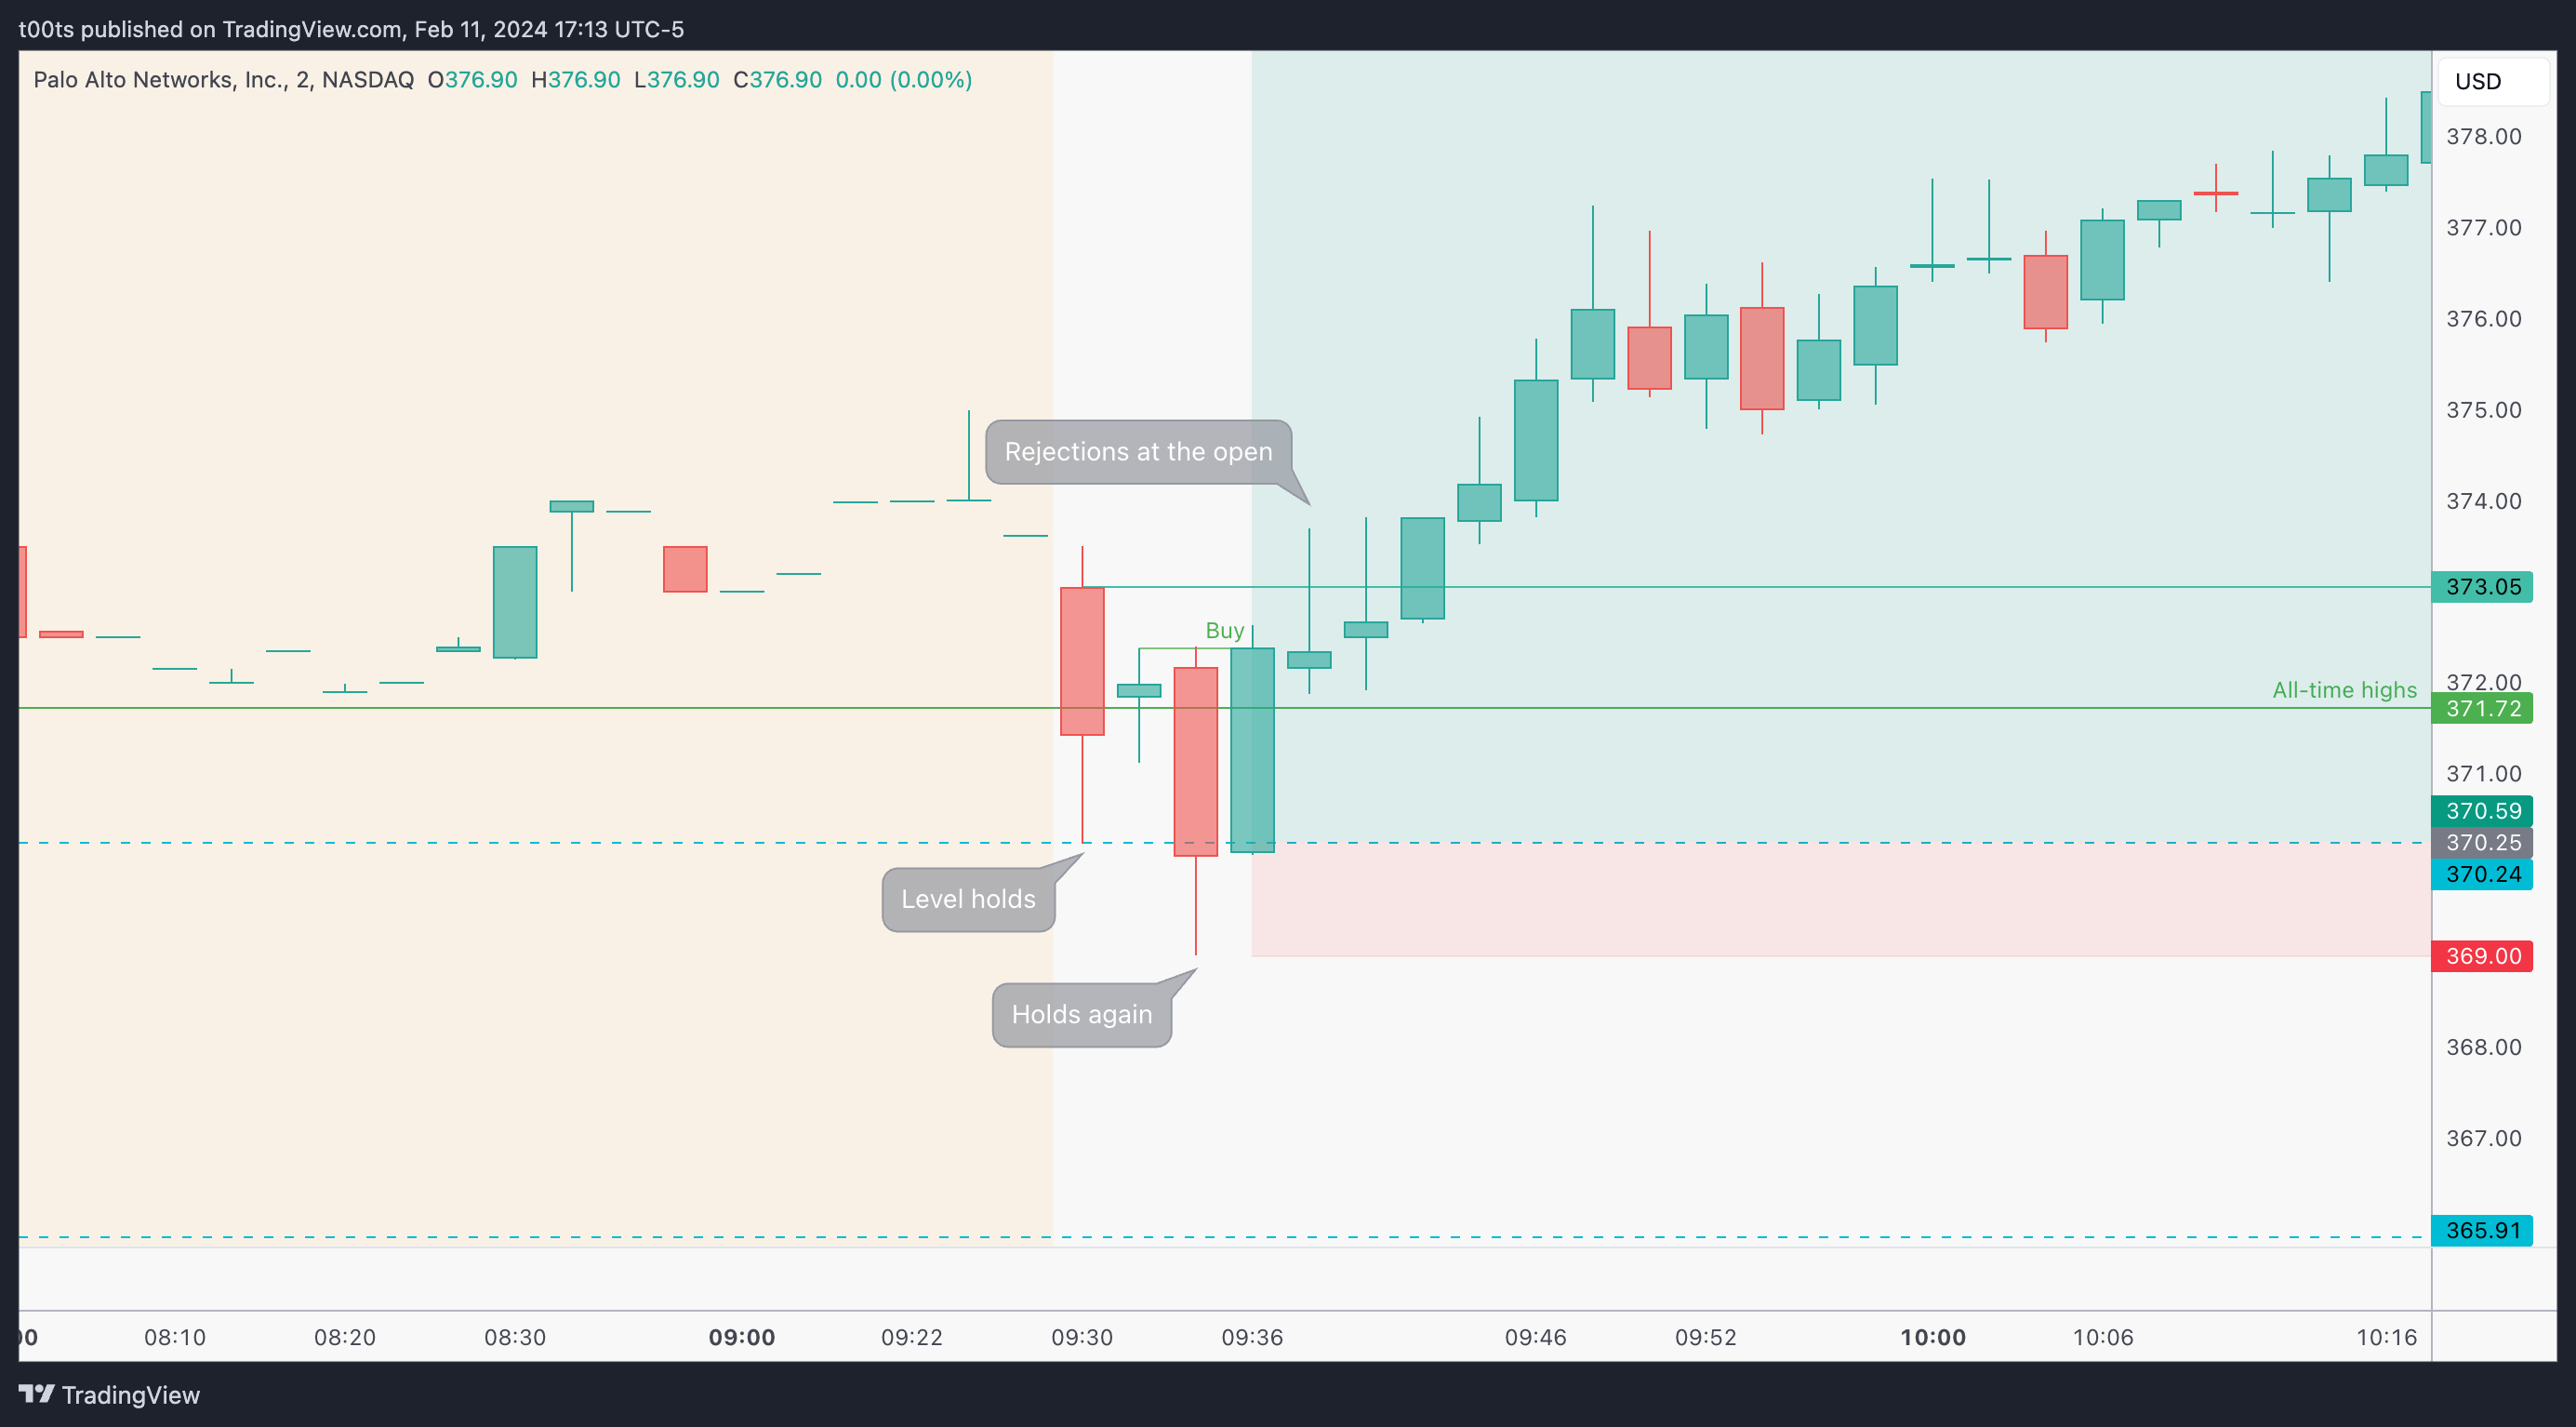
Straight off the open, price comes down to test our level and quickly bounces to reclaim the previous all-time high mark the stock had set on the previous day. That second 2m bar holds there and sets us up for a potential buy, but it never triggers. Price pulls back into the level and briefly trades below it. This time, however, the bounce looks strong. Buyers are there.
The entries were not ideal unless you got involved near the $370 area risking the lows, which was essentially what we outlined in our plan.
Now, with the benefit of hindsight, looks like that's what most traders did, hence the bounce. After all, it was the straightforward play. Previous resistance turned support.
Despite not offering a clear buy setup, the moment $370 was reclaimed served us a great starter entry trigger, especially as we have a level there that offers us further confluence.
5m chart
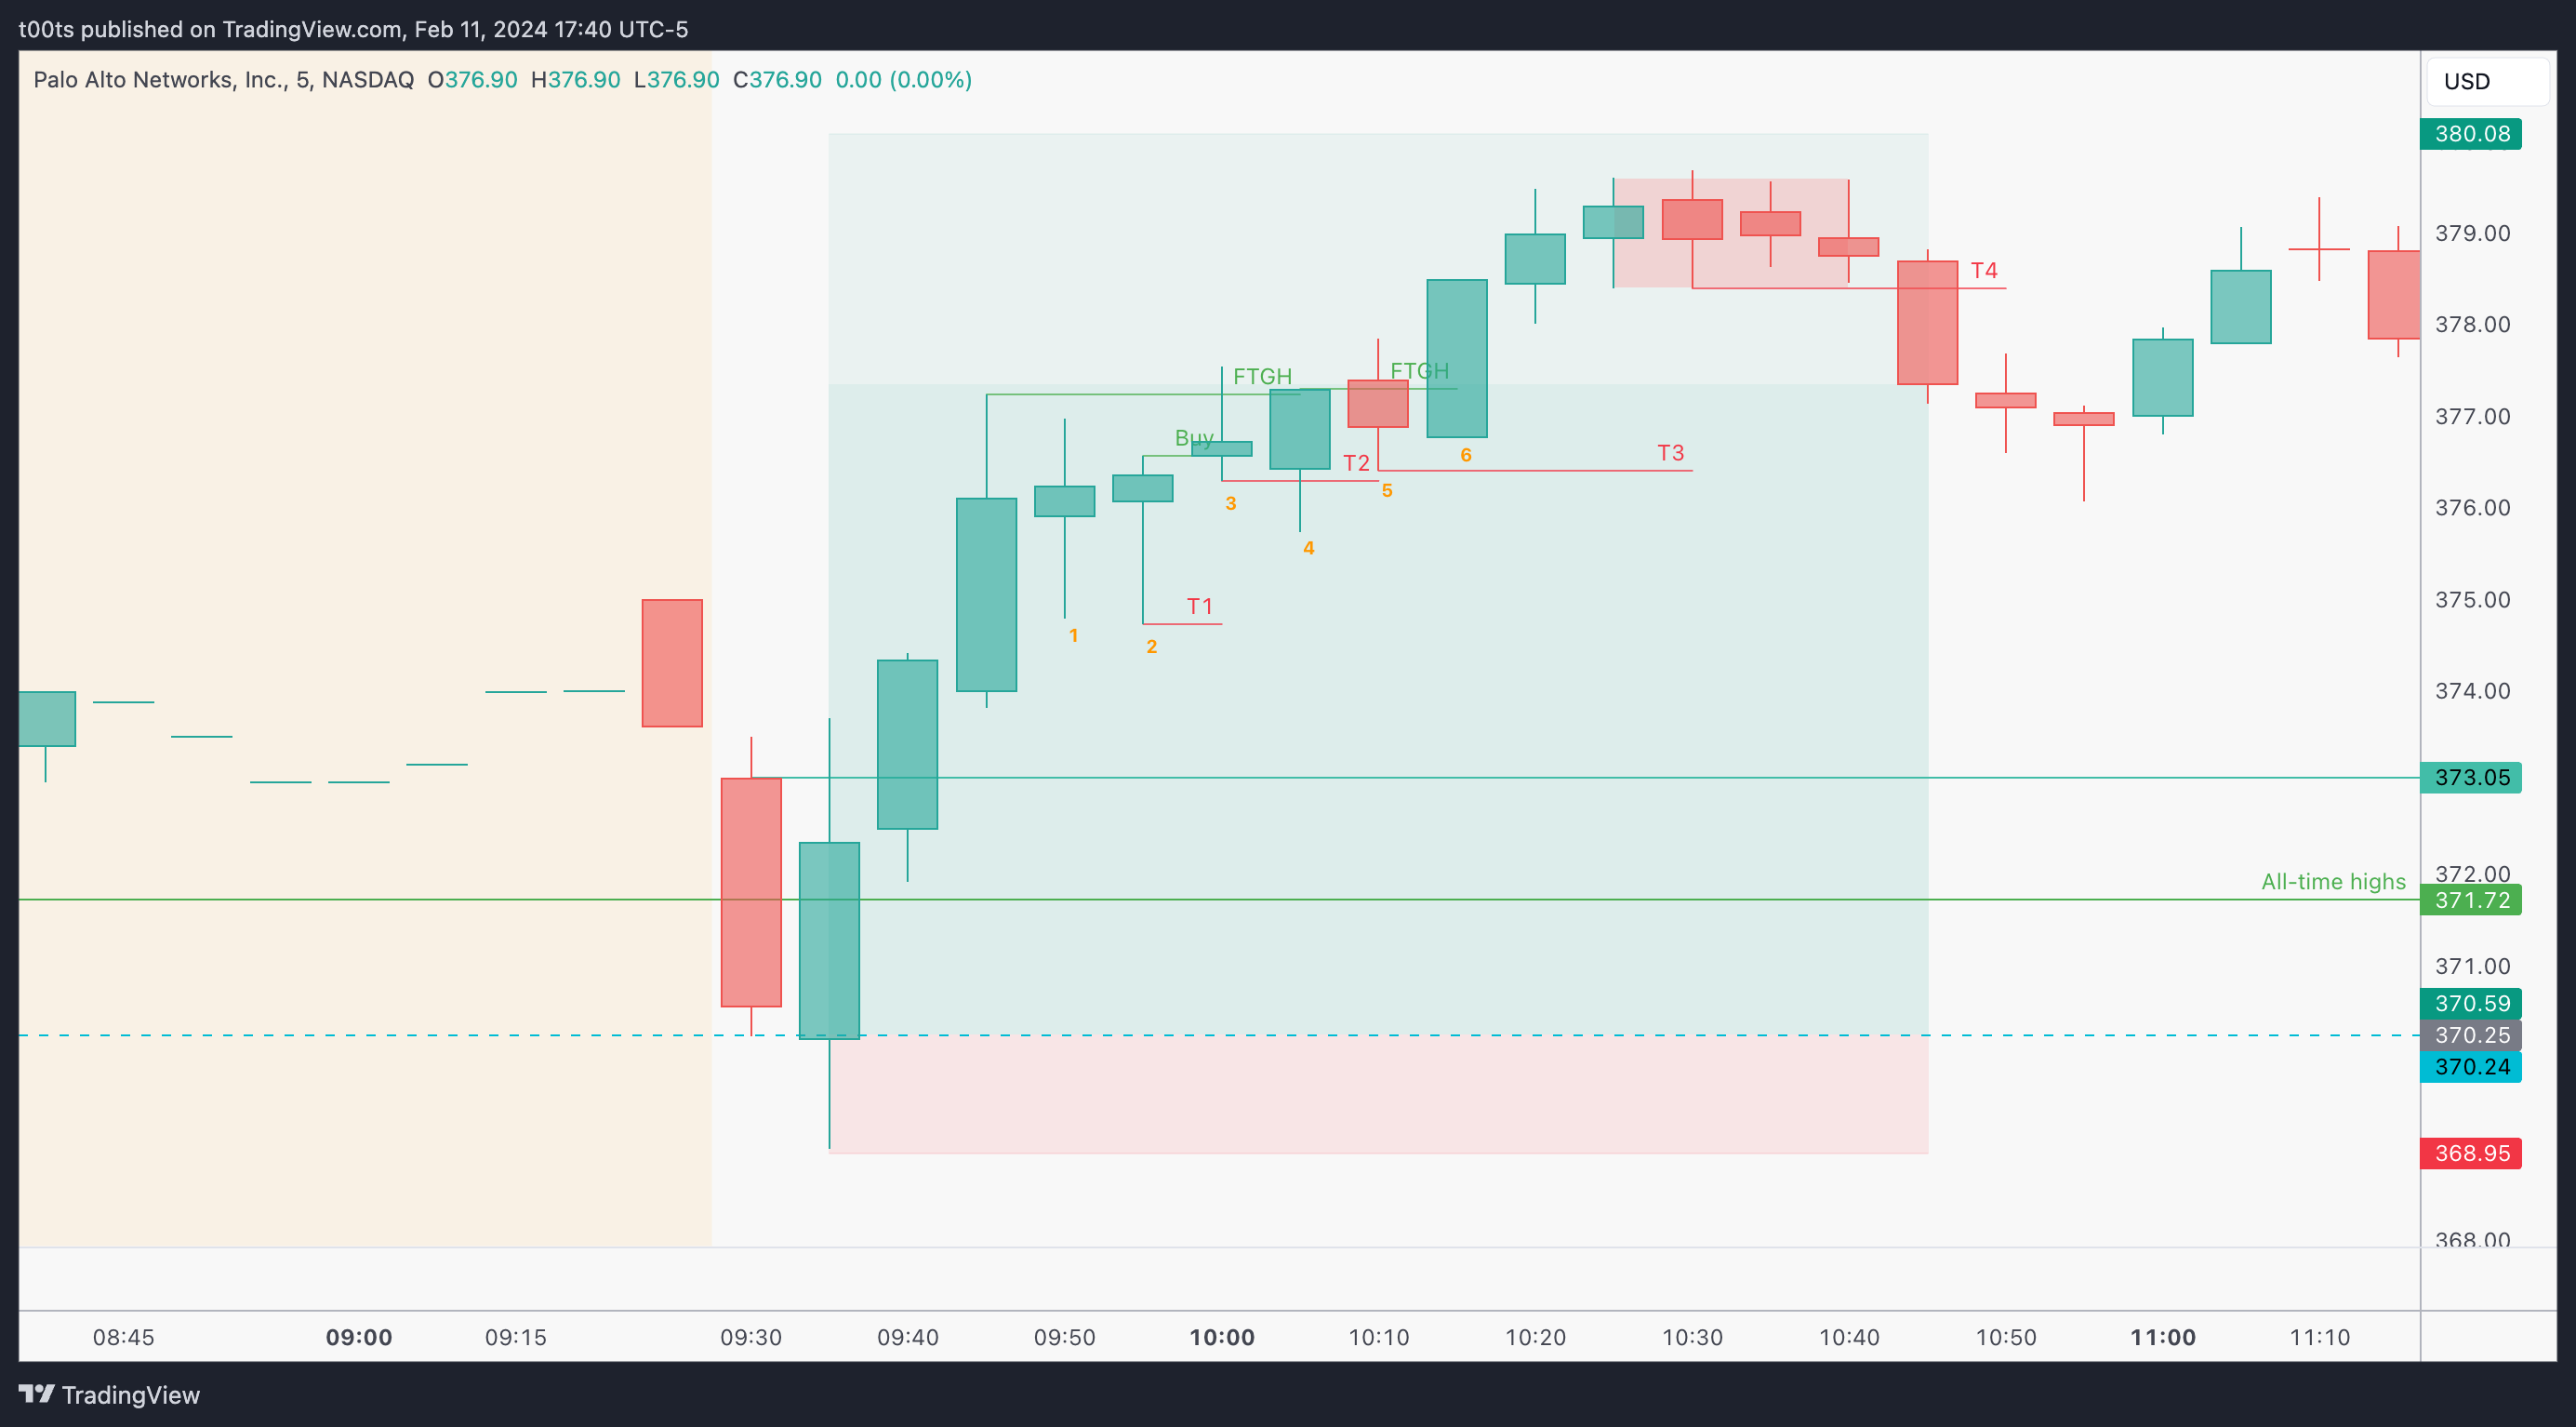
Price action was not the easiest on this trade, but at least it starts getting choppy when we're 5 points in the money, so it shouldn't be too stressful. If you waited to get involved on the reclaim of the opening print, I then would agree that the trade was uncomfortable.
Bar 1 is an inside doji bar after those 3 trend bars after the $370 bounce.
Bar 2 is (almost) a double inside bar, which trades below bar 1's lows and bounces back up, setting up another potential entry at the break of its highs and giving us a reference for our first stop trail at T1.
Bar 3 breaks out of that flag and makes a new high of day, but fails to hold and wicks back down. This is not enough to trail our stop, but I still trailed T2 to its lows as this was not the action we were expecting, especially if we took that second entry.
Bar 4 triggers the trailing stop but buyers bid the stock back up and the bar closes strong, creating a failed failure pattern that offers yet another entry to go long at the break of its highs.
Bar 5 triggers that entry but again lacks follow through, leading us to trail again at T3.
Bar 6 is a strong trend bar that finally breaks out of the range and starts this short leg up into the highs of the day.
Price never gets to our $380 target. It starts ranging at the $379s and eventually pulls back, triggering our last trail T4 as it breaks the bottom of the range.
Closing notes
We've been going over a lot of clean price action lately. This is a good example of a setup that met all the criteria to be traded but once in it we find ourselves less comfortable than usual. Buyers lacked conviction after $375. The slower momentum led to choppy action. Sometimes that's just the way it is.
When trading options, especially weeklies nearing expiration, you can't afford to hold through chop. Unless you're scalping, buying time choosing further out expirations is always a good idea. The stress relief is real, and you might find yourself trading better.
I am posting one trade writeup every day throughout 2024. I focus on large caps using levels and price action. The subscription is absolutely free and will always be. I will strive to provide value by offering clues and ideas for you to enhance your edge. Let’s grow together!