

Higher timeframe context
I'd like to start today's entry with a quick note about ASML earnings: They tripled previous quarter orders. Shares of the company are up 10% following the announcement.
Why is this important?
ASML is a Dutch company and currently the only supplier of the photolithography equipment used in the semiconductor manufacturing process. They specialize in the development and production of photolithography machines, which enable a crucial step in the manufacturing process of many cutting-edge integrated circuits used in a wide range of electronic devices, including the smartphone or computer you're using to read this.
They've recently received €5.6 billion worth of new orders for these machines.
Wait but… Who cares?
Well, their largest client is TSMC. If that still doesn’t ring a bell, TSMC is the main chip supplier for Apple and (drum roll…)
You guessed it, NVIDIA.
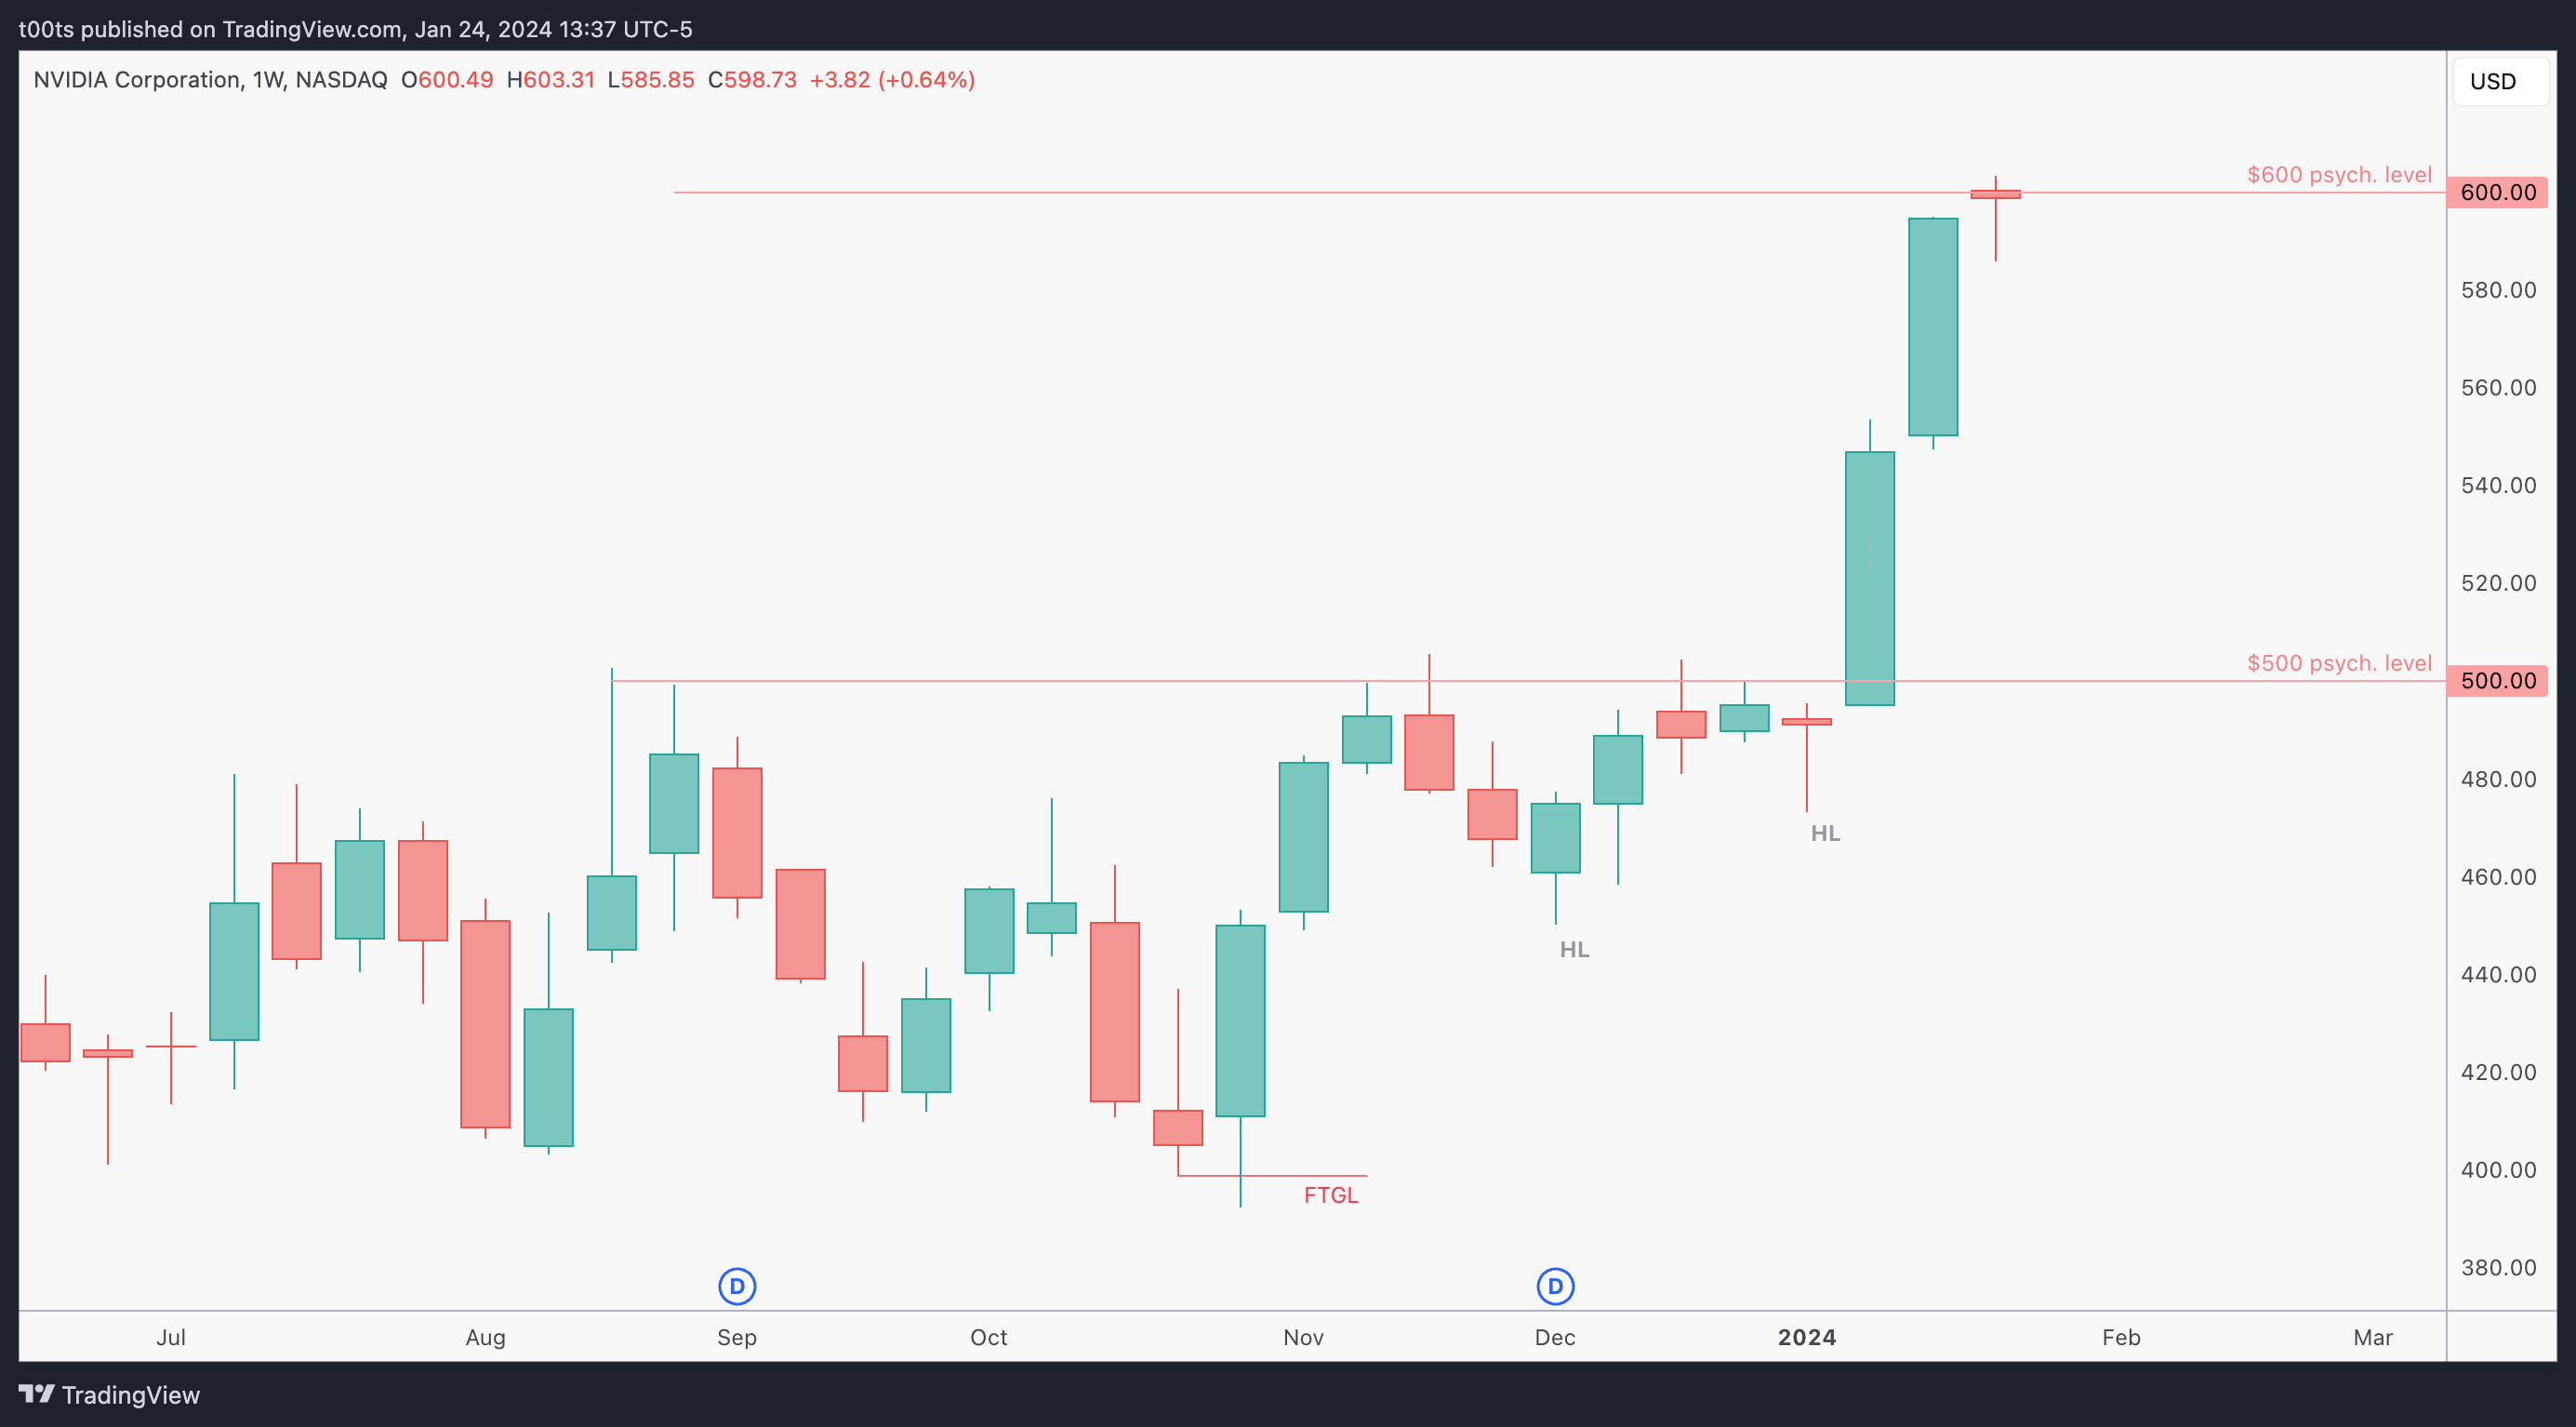
Weekly chart
NVDA shares have surged 100pts in just two weeks. That translates to a 20% increase in market capitalization. Again, two weeks. Two weeks! We're talking about a trillion dollar company. The momentum is real and doesn't show any sign of stopping any time soon. If you're looking for shorts on this name you're oblivious to the trend that's in front of you. If you're waiting for it to take a break or don't feel comfortable taking longs without a pullback, I suggest using other names as sympathy plays.
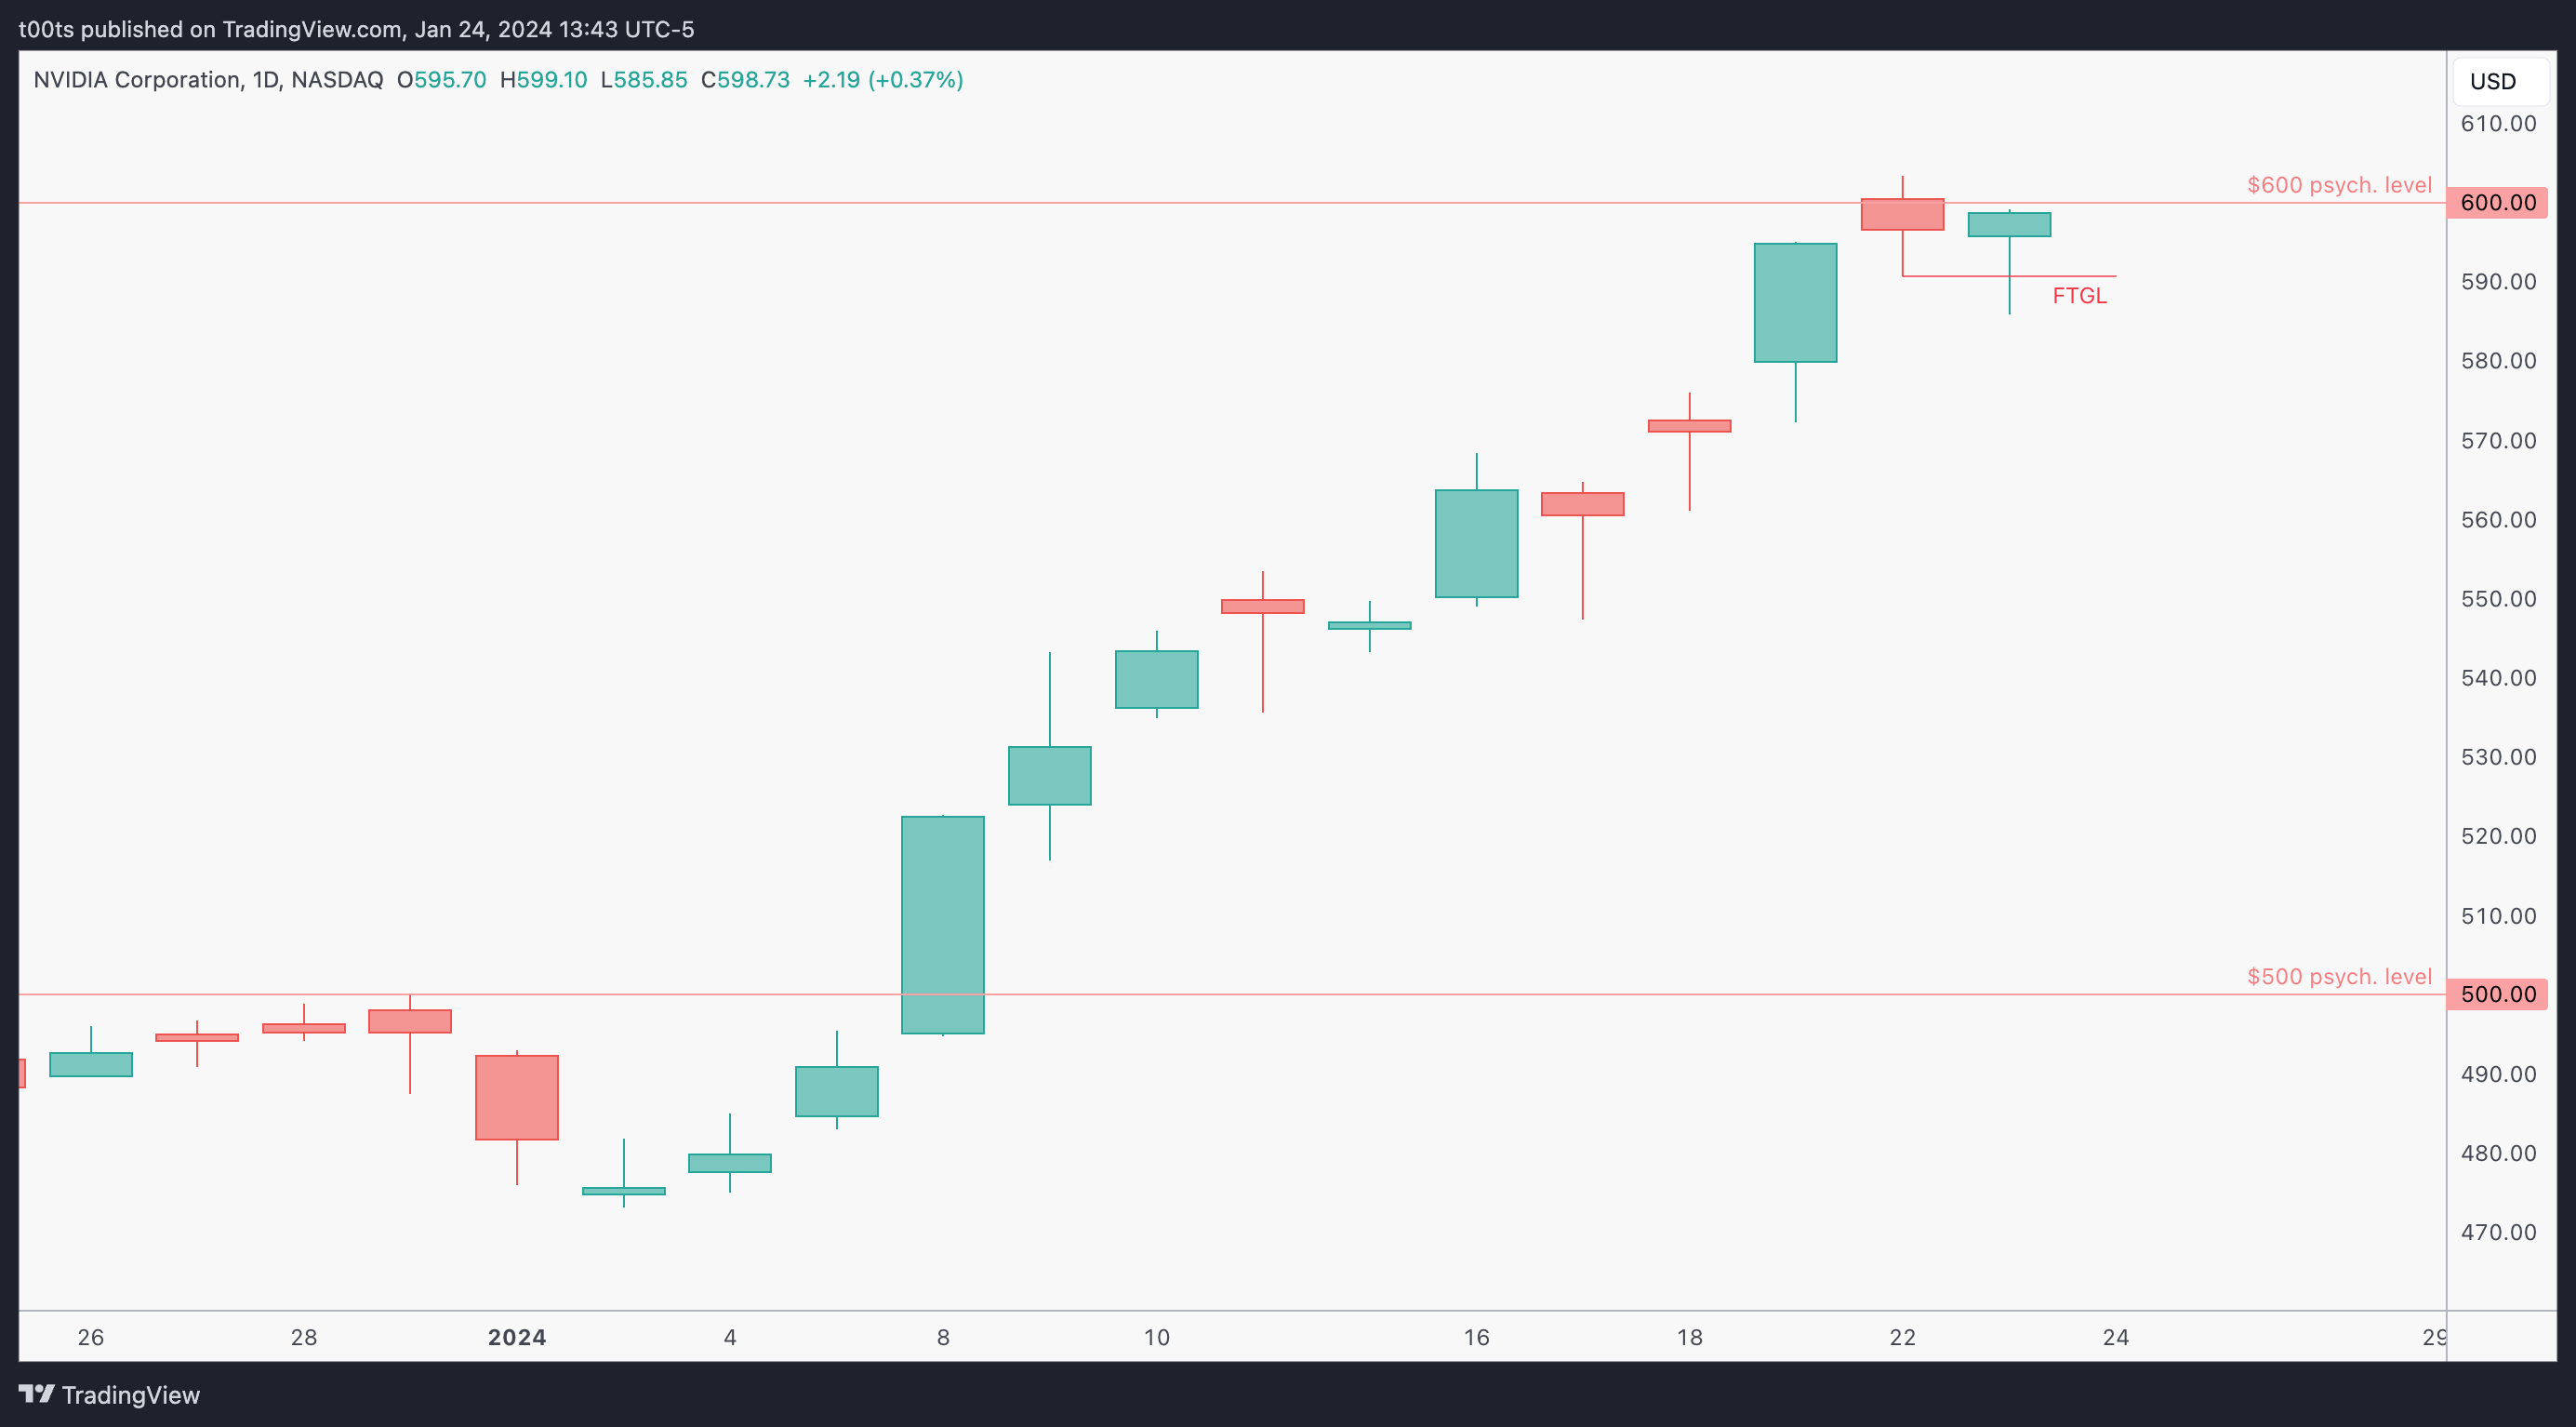
Daily chart
Luckily we recently got a bit of a pullback, or let's just say some rest. The $600 level acted as resistance and price so far hasn't been able to break it. Nevertheless, recent price action hints that buyers are not done. The moment price began to pull back and broke the lows of the $600 rejection bar, buyers immediately stepped in and manage to close the day with a very bullish green hammer.
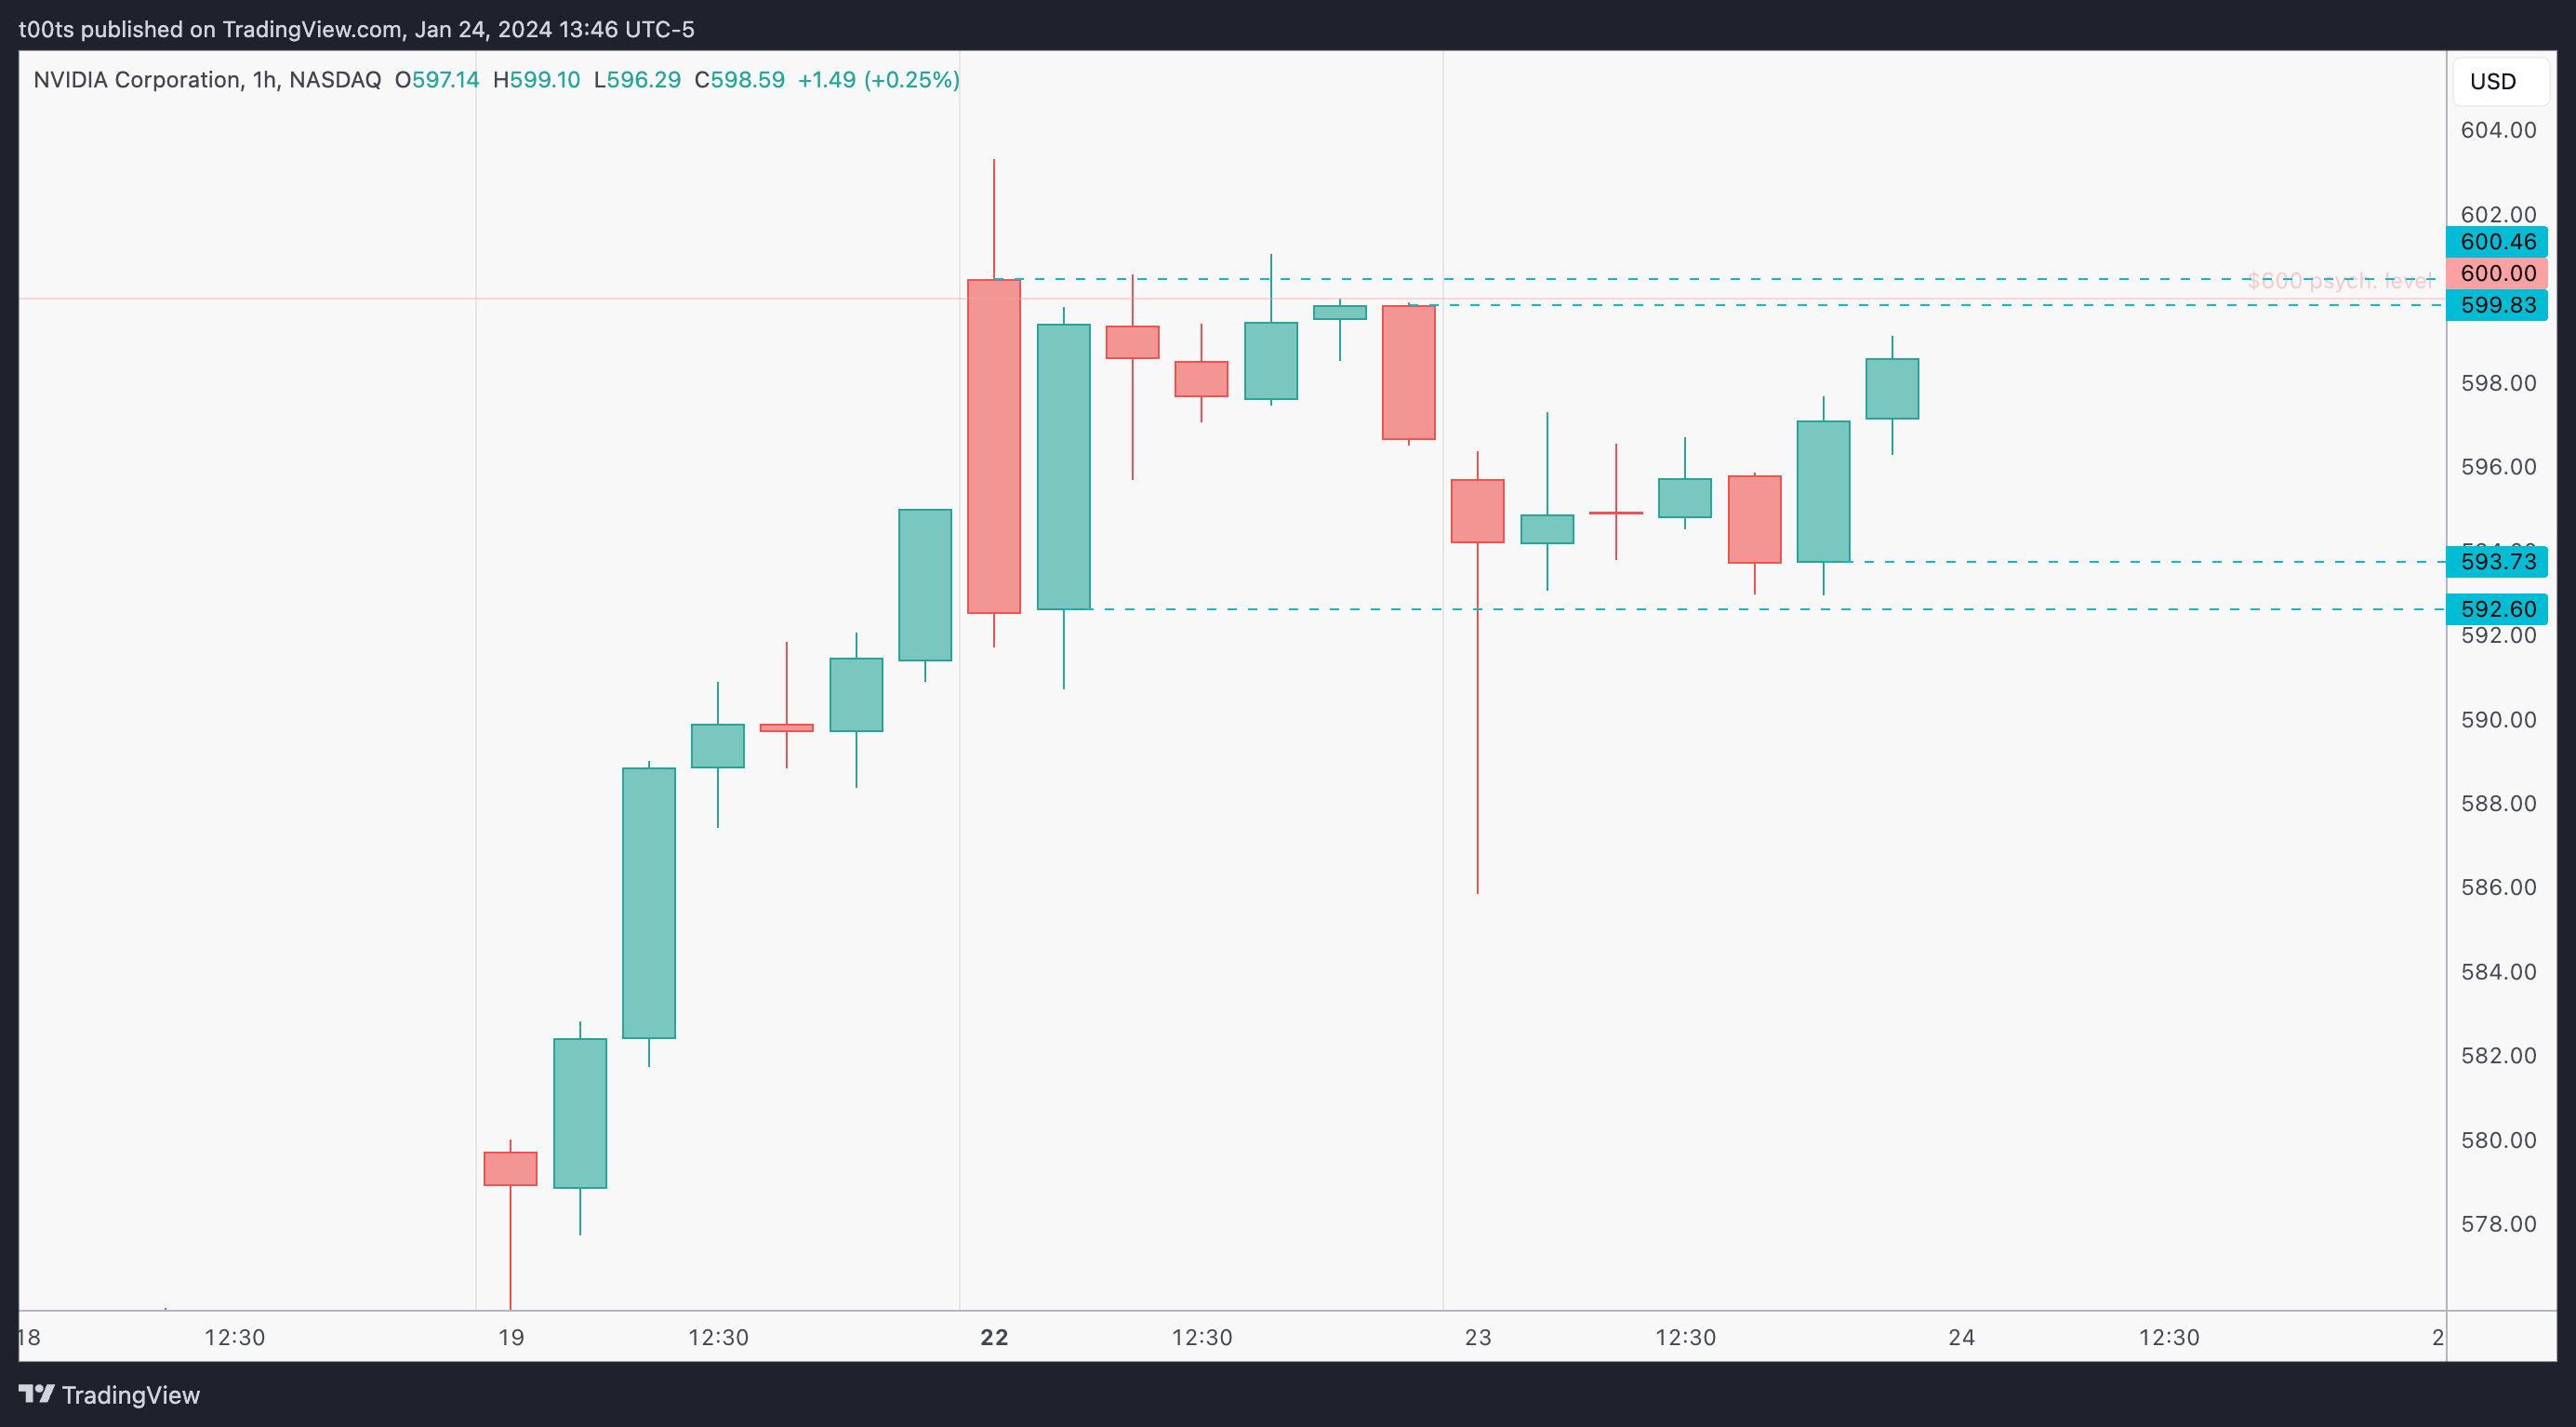
Hourly chart
The hourly chart is currently ranging in what I would expect most traders to qualify as a textbook bull flag. We have two levels above that are very close to the $600 psych. mark. In this case, I'd just consider the whole area (spanning around 50 cents) as an area of interest to trade off of if price can get above $600.
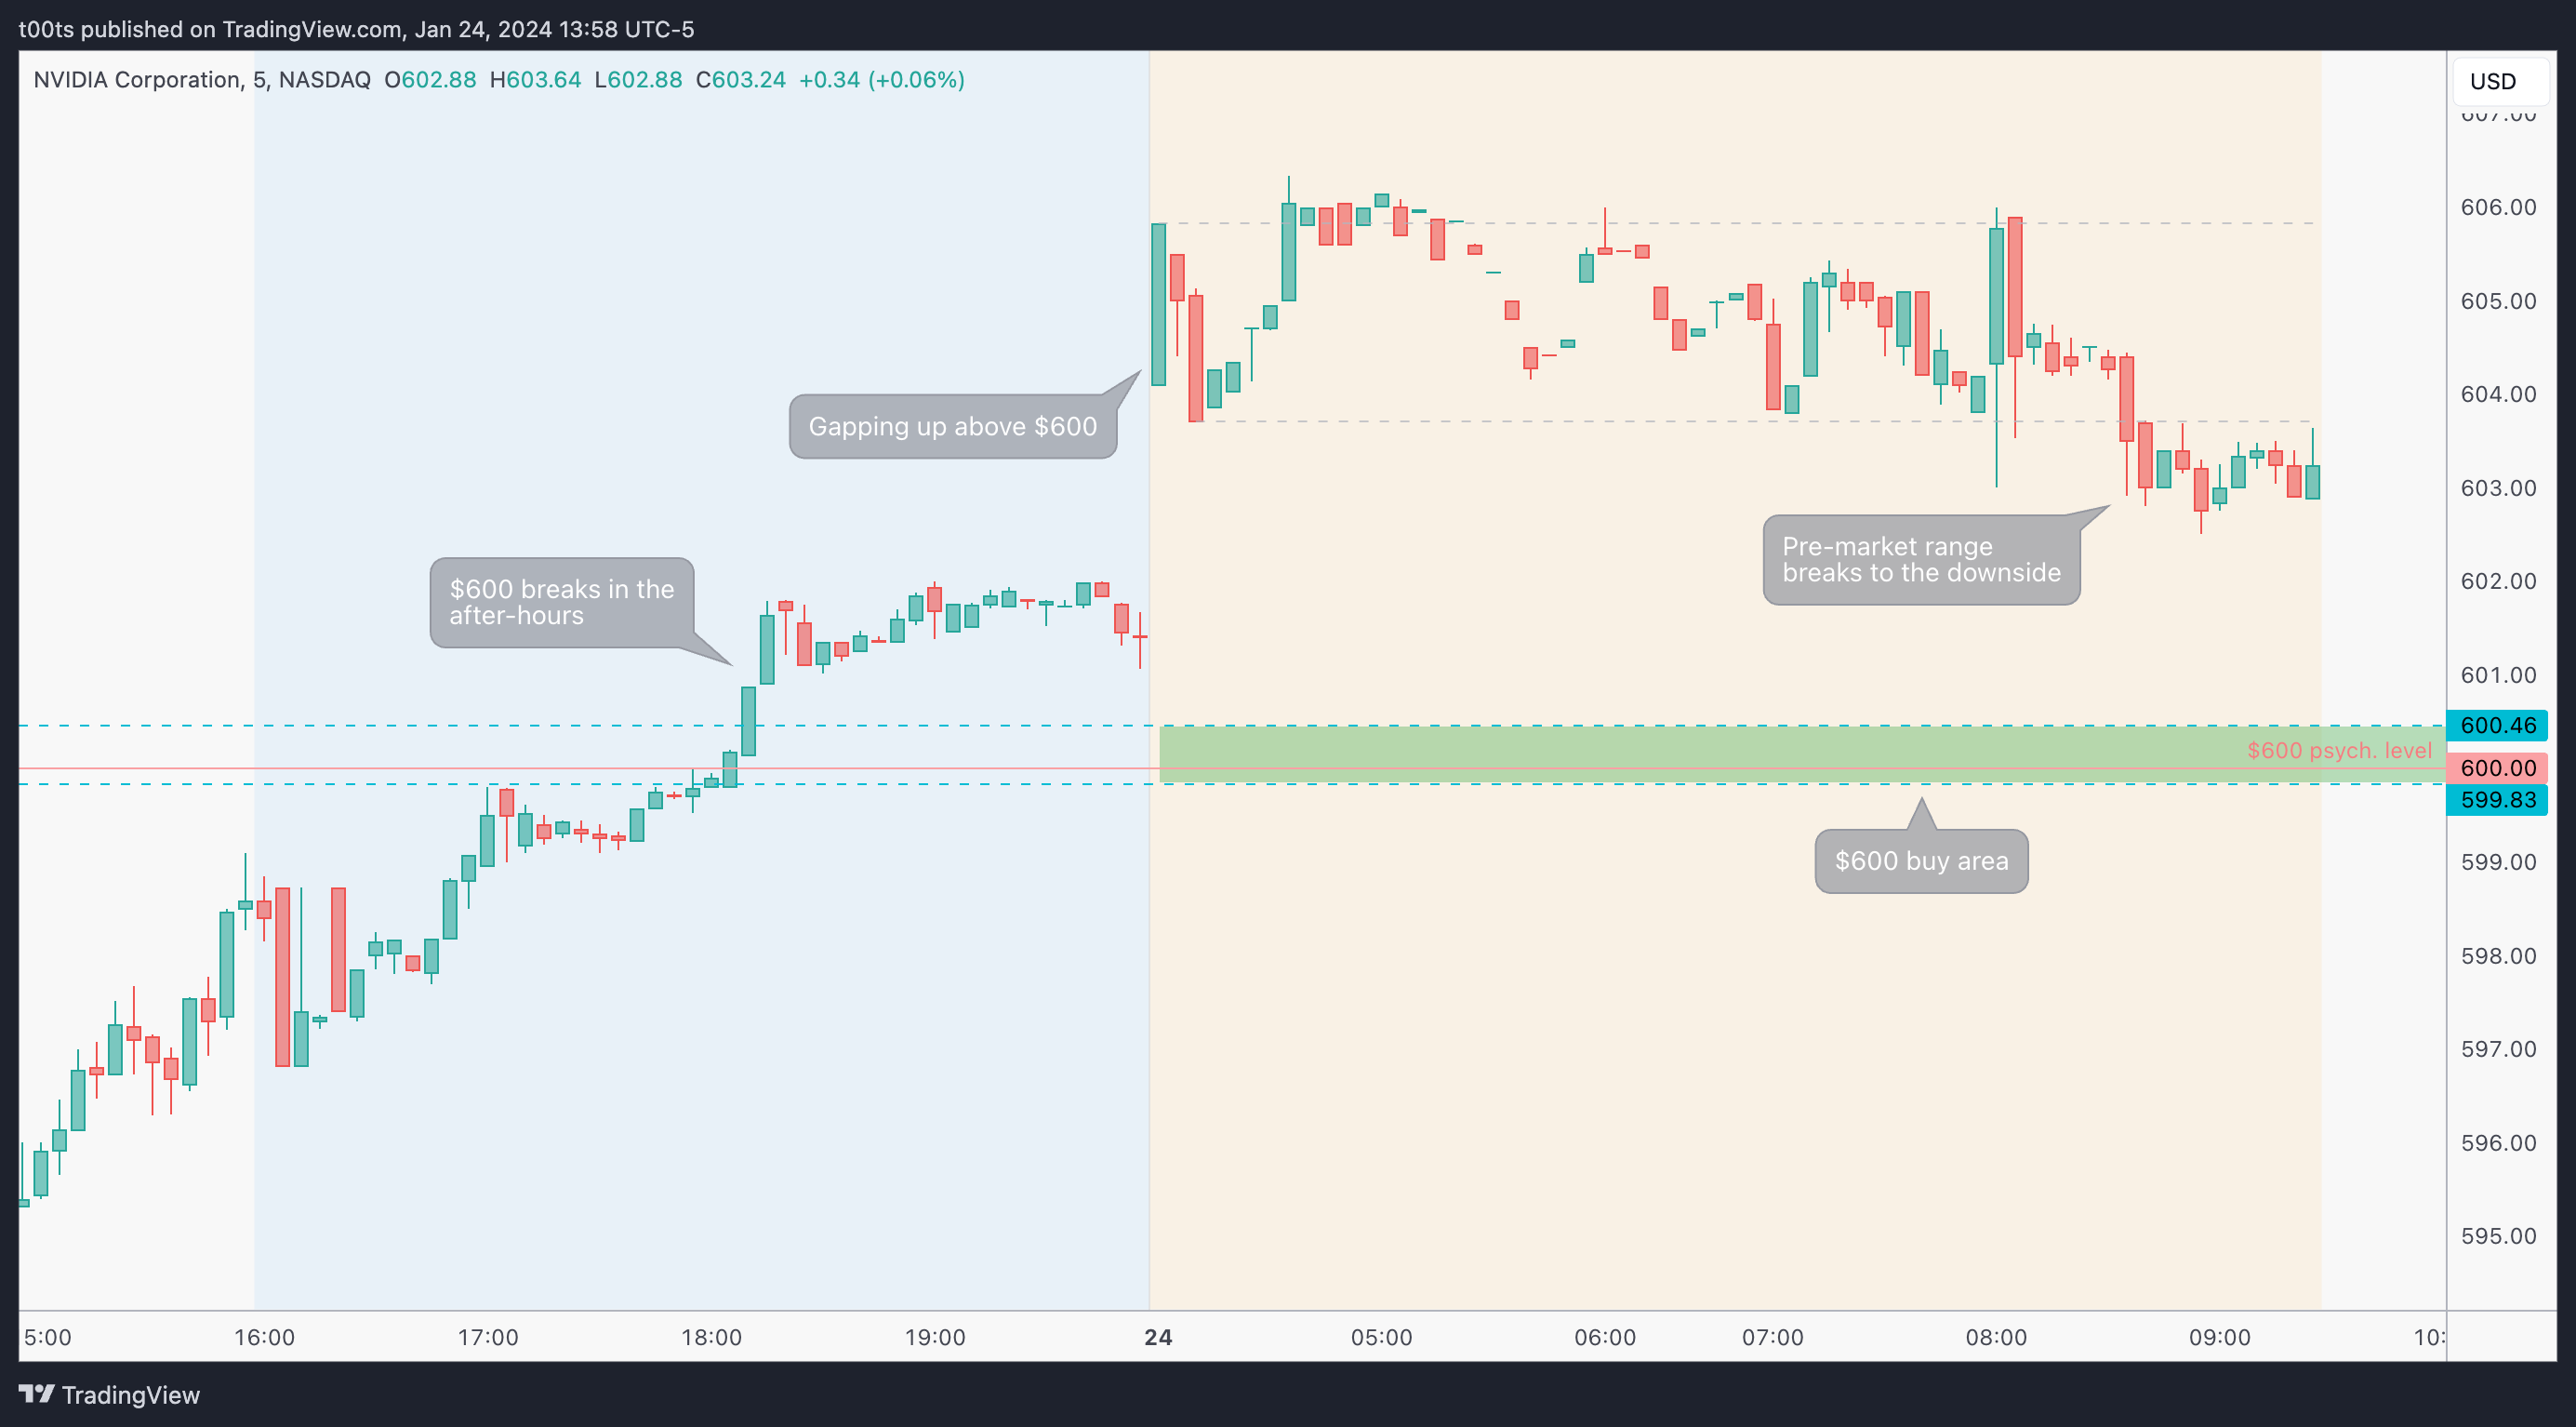
Pre-market action
First thing we notice is that NVDA closed the after-hours session above the $600 level on the previous day. This is already a cue in itself to watch it the following day.
Furthermore, price is gapping up to new all-time highs in the early pre-market session. This is arguably due to the ASML earnings report and forward guidance. ASML trades in Europe, so by the time the US market opened, it was already up around 6%.
Price ranges all morning, which to be honest, is great for us. As option traders, we want price to open as close as possible to the $600 area so we can get involved around market open. Our $600 buy is just below, marked in green.
The trade
Up to this point, we have a very solid potential opportunity setting up. A market-leading stock, gapping above a key psychological resistance level, with a positive catalyst and clear skies above...
Let's plan it out using our CPT Framework:
Cue(s)
Leader of the strongest sector in the market
Closed previous day above the $600 psych. mark
Gapping over the $600 psych. mark while making new ATH's
It’s main chip supplier reports huge orders and solid guidance
Clear buying area
No resistance above
Plan
We've seen this one many times already, but here we go again. All we want is for price to test the $600 buying area and see how it reacts there.
Quickly bounces: Take entries the moment the opening print is reclaimed.
Holds above: Look for any buy setup on the 2m and wait for it to trigger.
Breaks below: No trade.
Trigger
Either the reclaim of the opening print or a 2m buy setup triggering
2m chart (entry detail)
As usual, when we're getting involved near the opening bell we focus on lower timeframes. Let's. go over the entry details on this 2m chart before zooming out to the 5m.
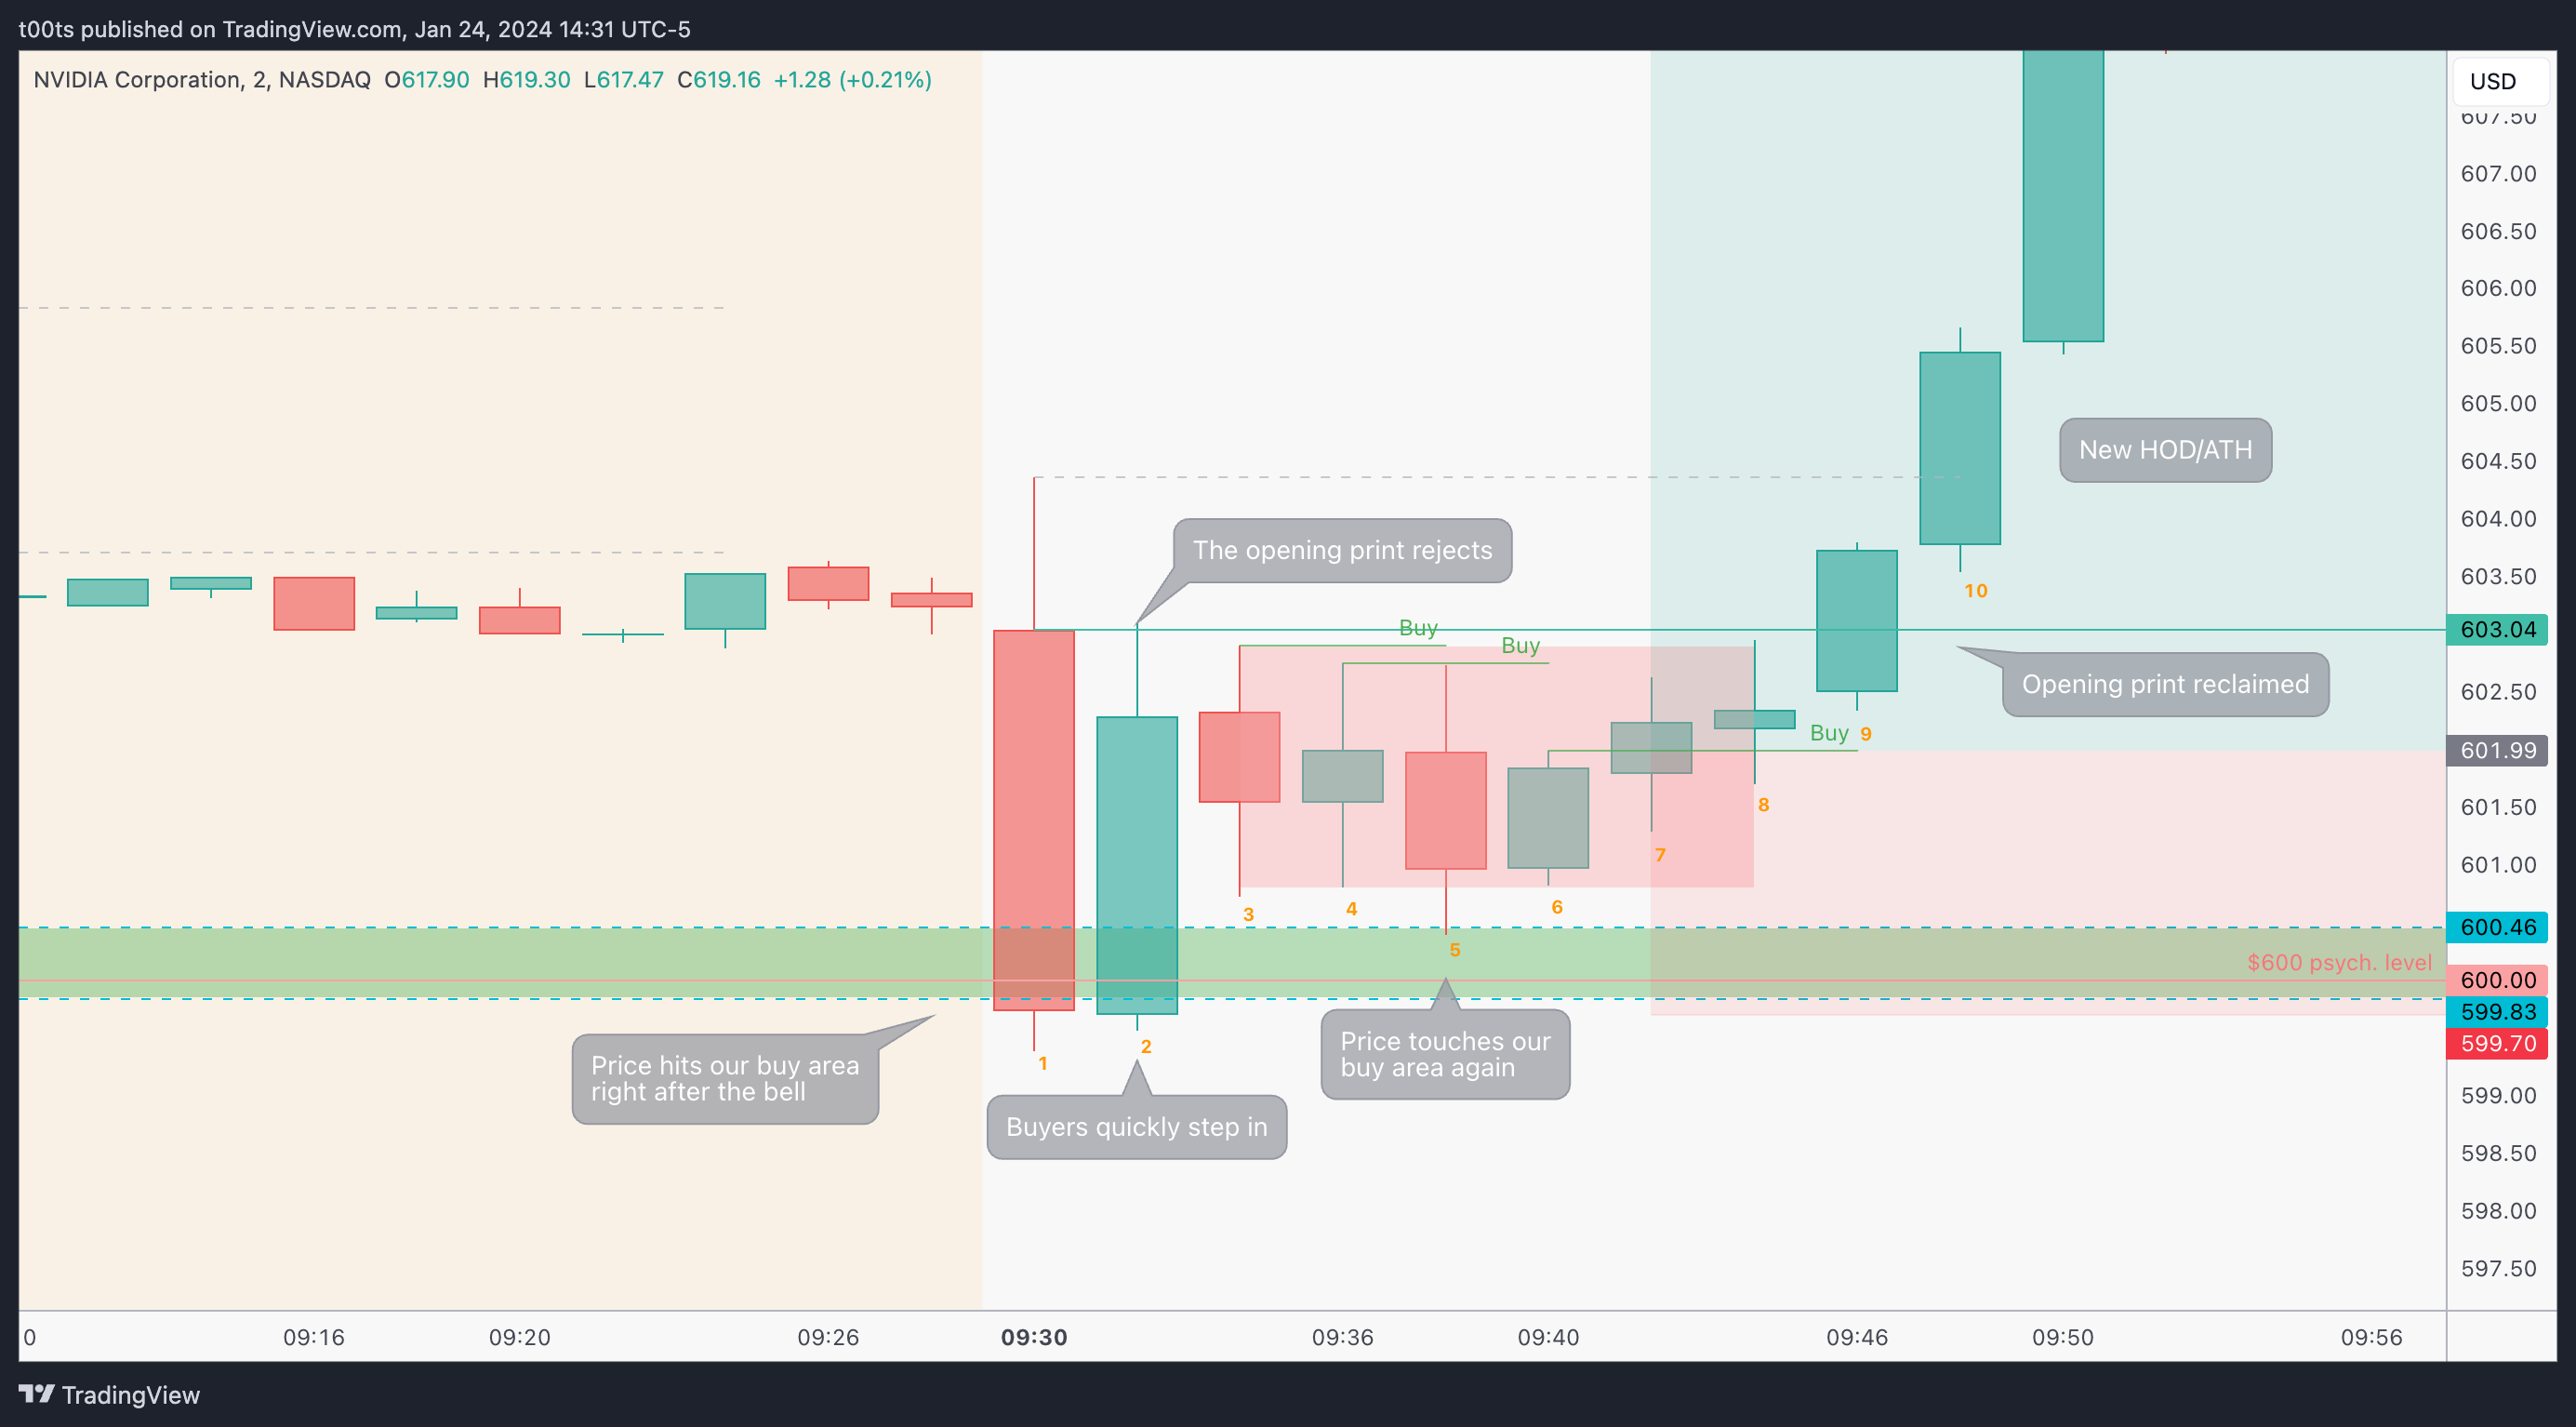
Bar 1, very conveniently, comes straight back down to test our buy area.
Bar 2 bounces straight off it, confirming there's buyers there. However, it's rejected at the opening print.
Bar 3 is an inside bar setting up a potential 3-bar play with Bar 2, which never triggers.
Bar 4 is a double inside bar which would set up a 4-bar play with bars 2 and 3, but also never triggers.
Bar 5 retests our buy area and holds within this small range.
Bar 6 is again another inside bar after the retest of the buy area, offering another potential buy opportunity.
Bar 7 triggers that buy opportunity. Notice I've set the stop below the $600 buy area, as opposed to the signal bar low.
Bar 9 breaks the range and closes above the opening print.
Bar 10 makes a new high of day.
5m chart
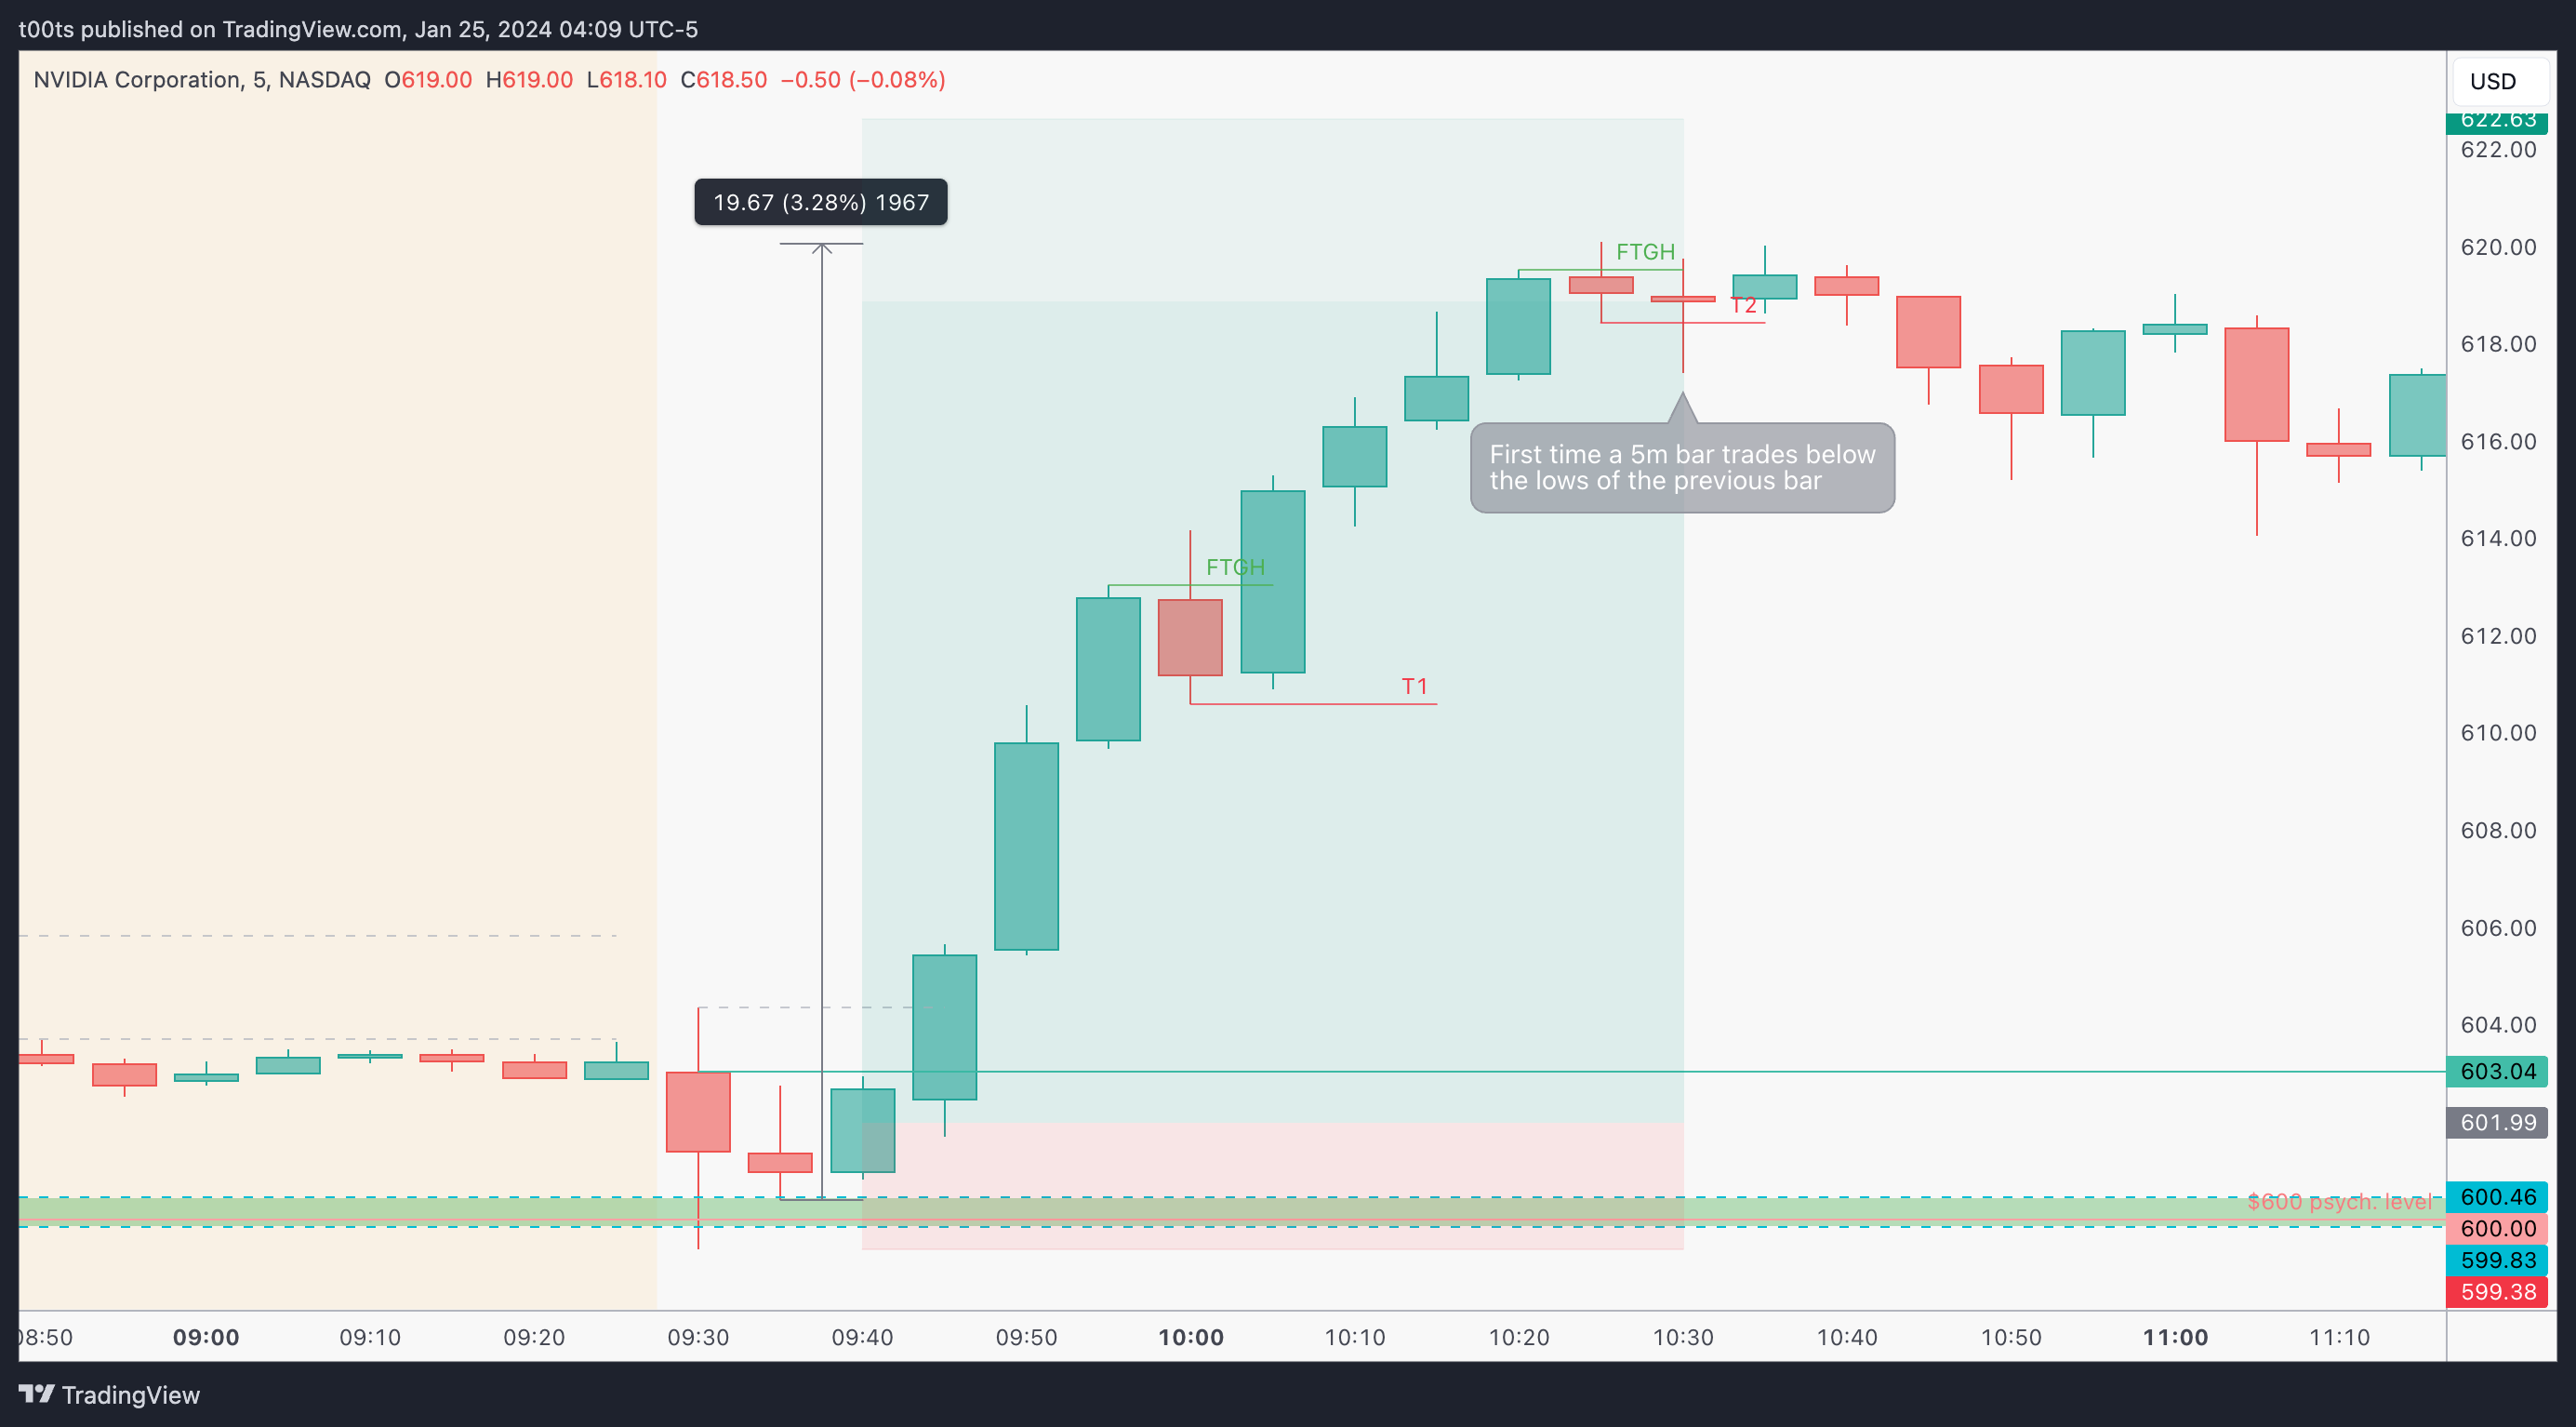
NVDA likes to move in increments of $20 lately. If you go back to the $500 break it rallied $20pts straight the first day, and another $20pts the second day. So we're using that as a reference to gauge when our risk-to-reward for holding this move becomes skewed enough for it to not be worth holding.
As we can see on the chart, it's a pretty straightforward hold. Stock takes off right after our entry and it's just a matter of holding until there's a failure. The first time we get a failure bar we trail the stop to its lows, but the stop never gets triggered.
Stock continues its upswing into the second leg. When we're about $20pts into the move (sound familiar?) we get another failure, which we use to ratchet our stop and this time it does get triggered.
At this point, as we mentioned earlier, it's probably not worth holding for more. I'm sure many people can make a case for the opposite, but a $20pt move with weekly options gets you a decent bag. No point risking it in my opinion.
Closing notes
As Freddy Mercury famously said, NVDA is having “such a good time” longs are indeed “having a ball”. I've personally been avoiding this name between the $500 and $600 because I didn't have proper references to trade off of. I instead chose to use other names as proxy plays.
This day NVDA presented us with an opportunity that was straightforward enough for it to have many eyes on it. The fact that price closed above the $600 on the after-hours the night before gave traders enough time to prepare, and the open above $600 offered everyone a clear level to trade off of.
The best trades are often this simple.
I am posting one trade writeup every day throughout 2024. I focus on large caps using levels and price action. The subscription is absolutely free and will always be. I will strive to provide value by offering clues and ideas for you to enhance your edge. Let’s grow together!