
NVIDIA (NVDA) - Jan 14th 2024 (2)
When everyone wants the same thing it doesn't happen

Higher timeframe context
This is Part II of yesterday's post.
In today's entry, I wanted to go over another trade that NVDA offered yesterday to the short side, which I took a loss on.
The higher timeframe is the exact same as yesterday's post, so feel free to skip straight to the trade if you've already read this.
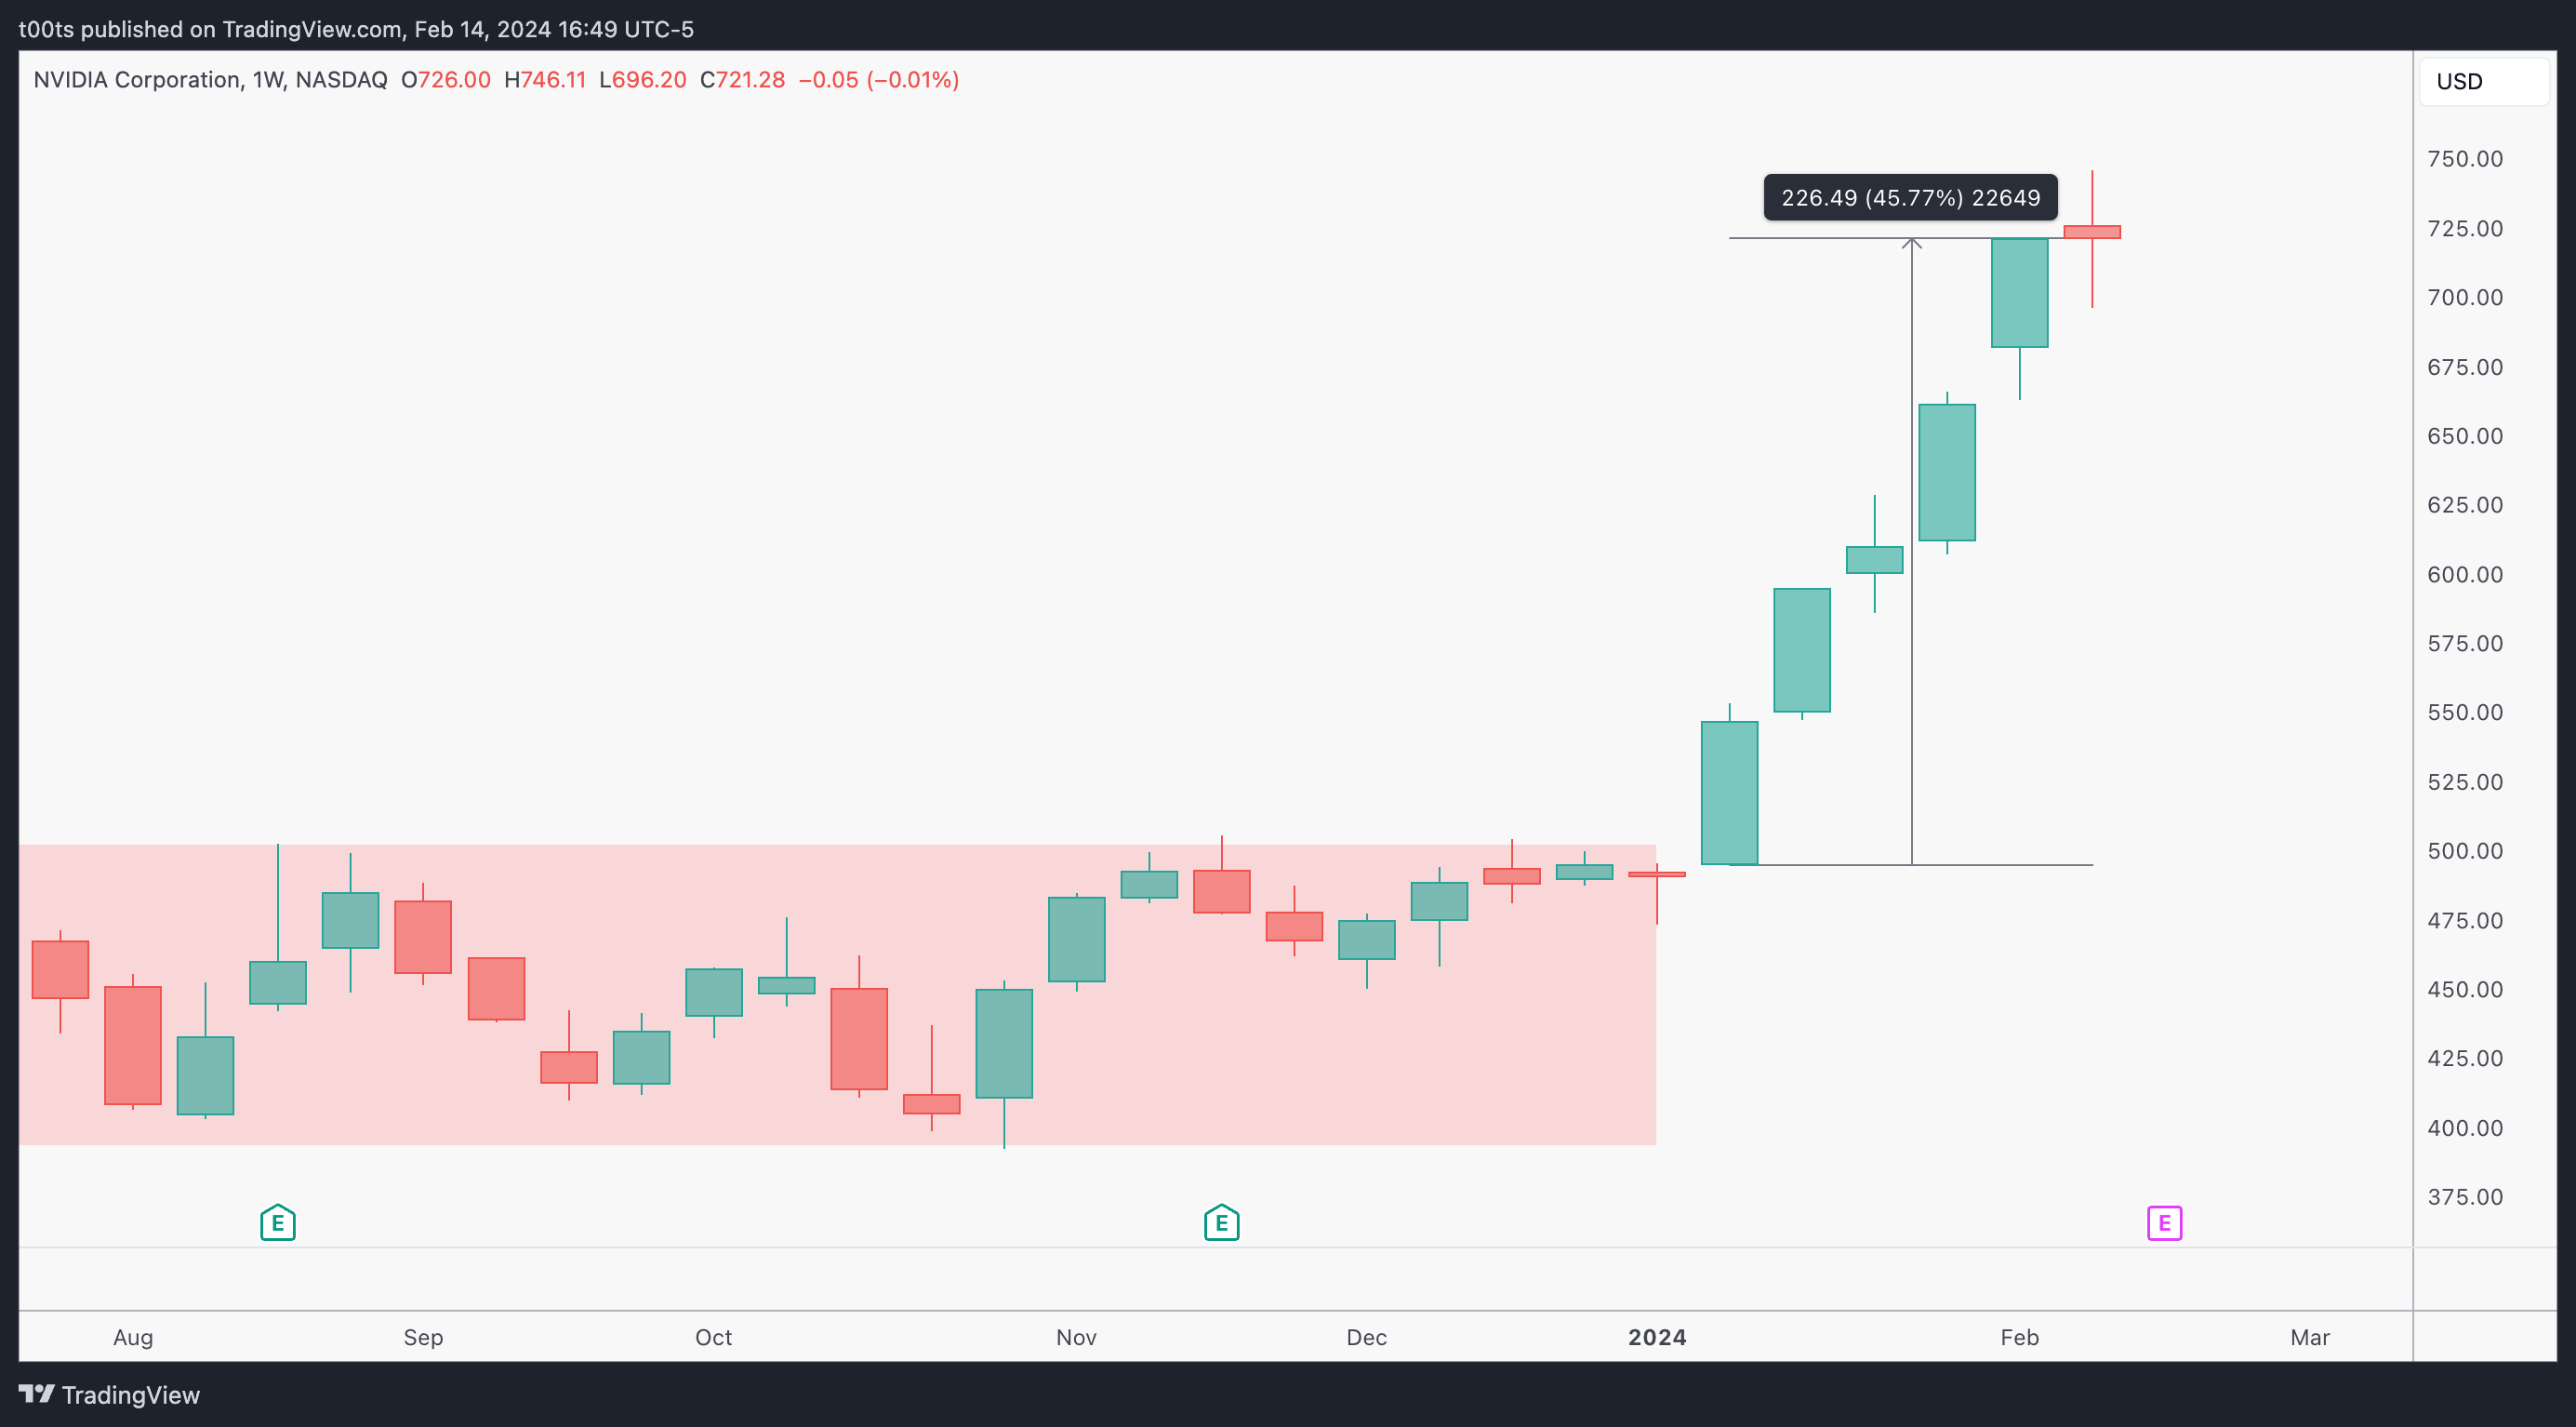
Weekly chart
Won't go into the obvious here because everyone is well aware of this monster move by now. Stock is up +45% in 5 weeks. The AI hype is driving the market and NVDA has been leading the way. It seems like she might be setting up for a bit of a pullback, as we're currently below the weekly open after an attempt to continue higher.
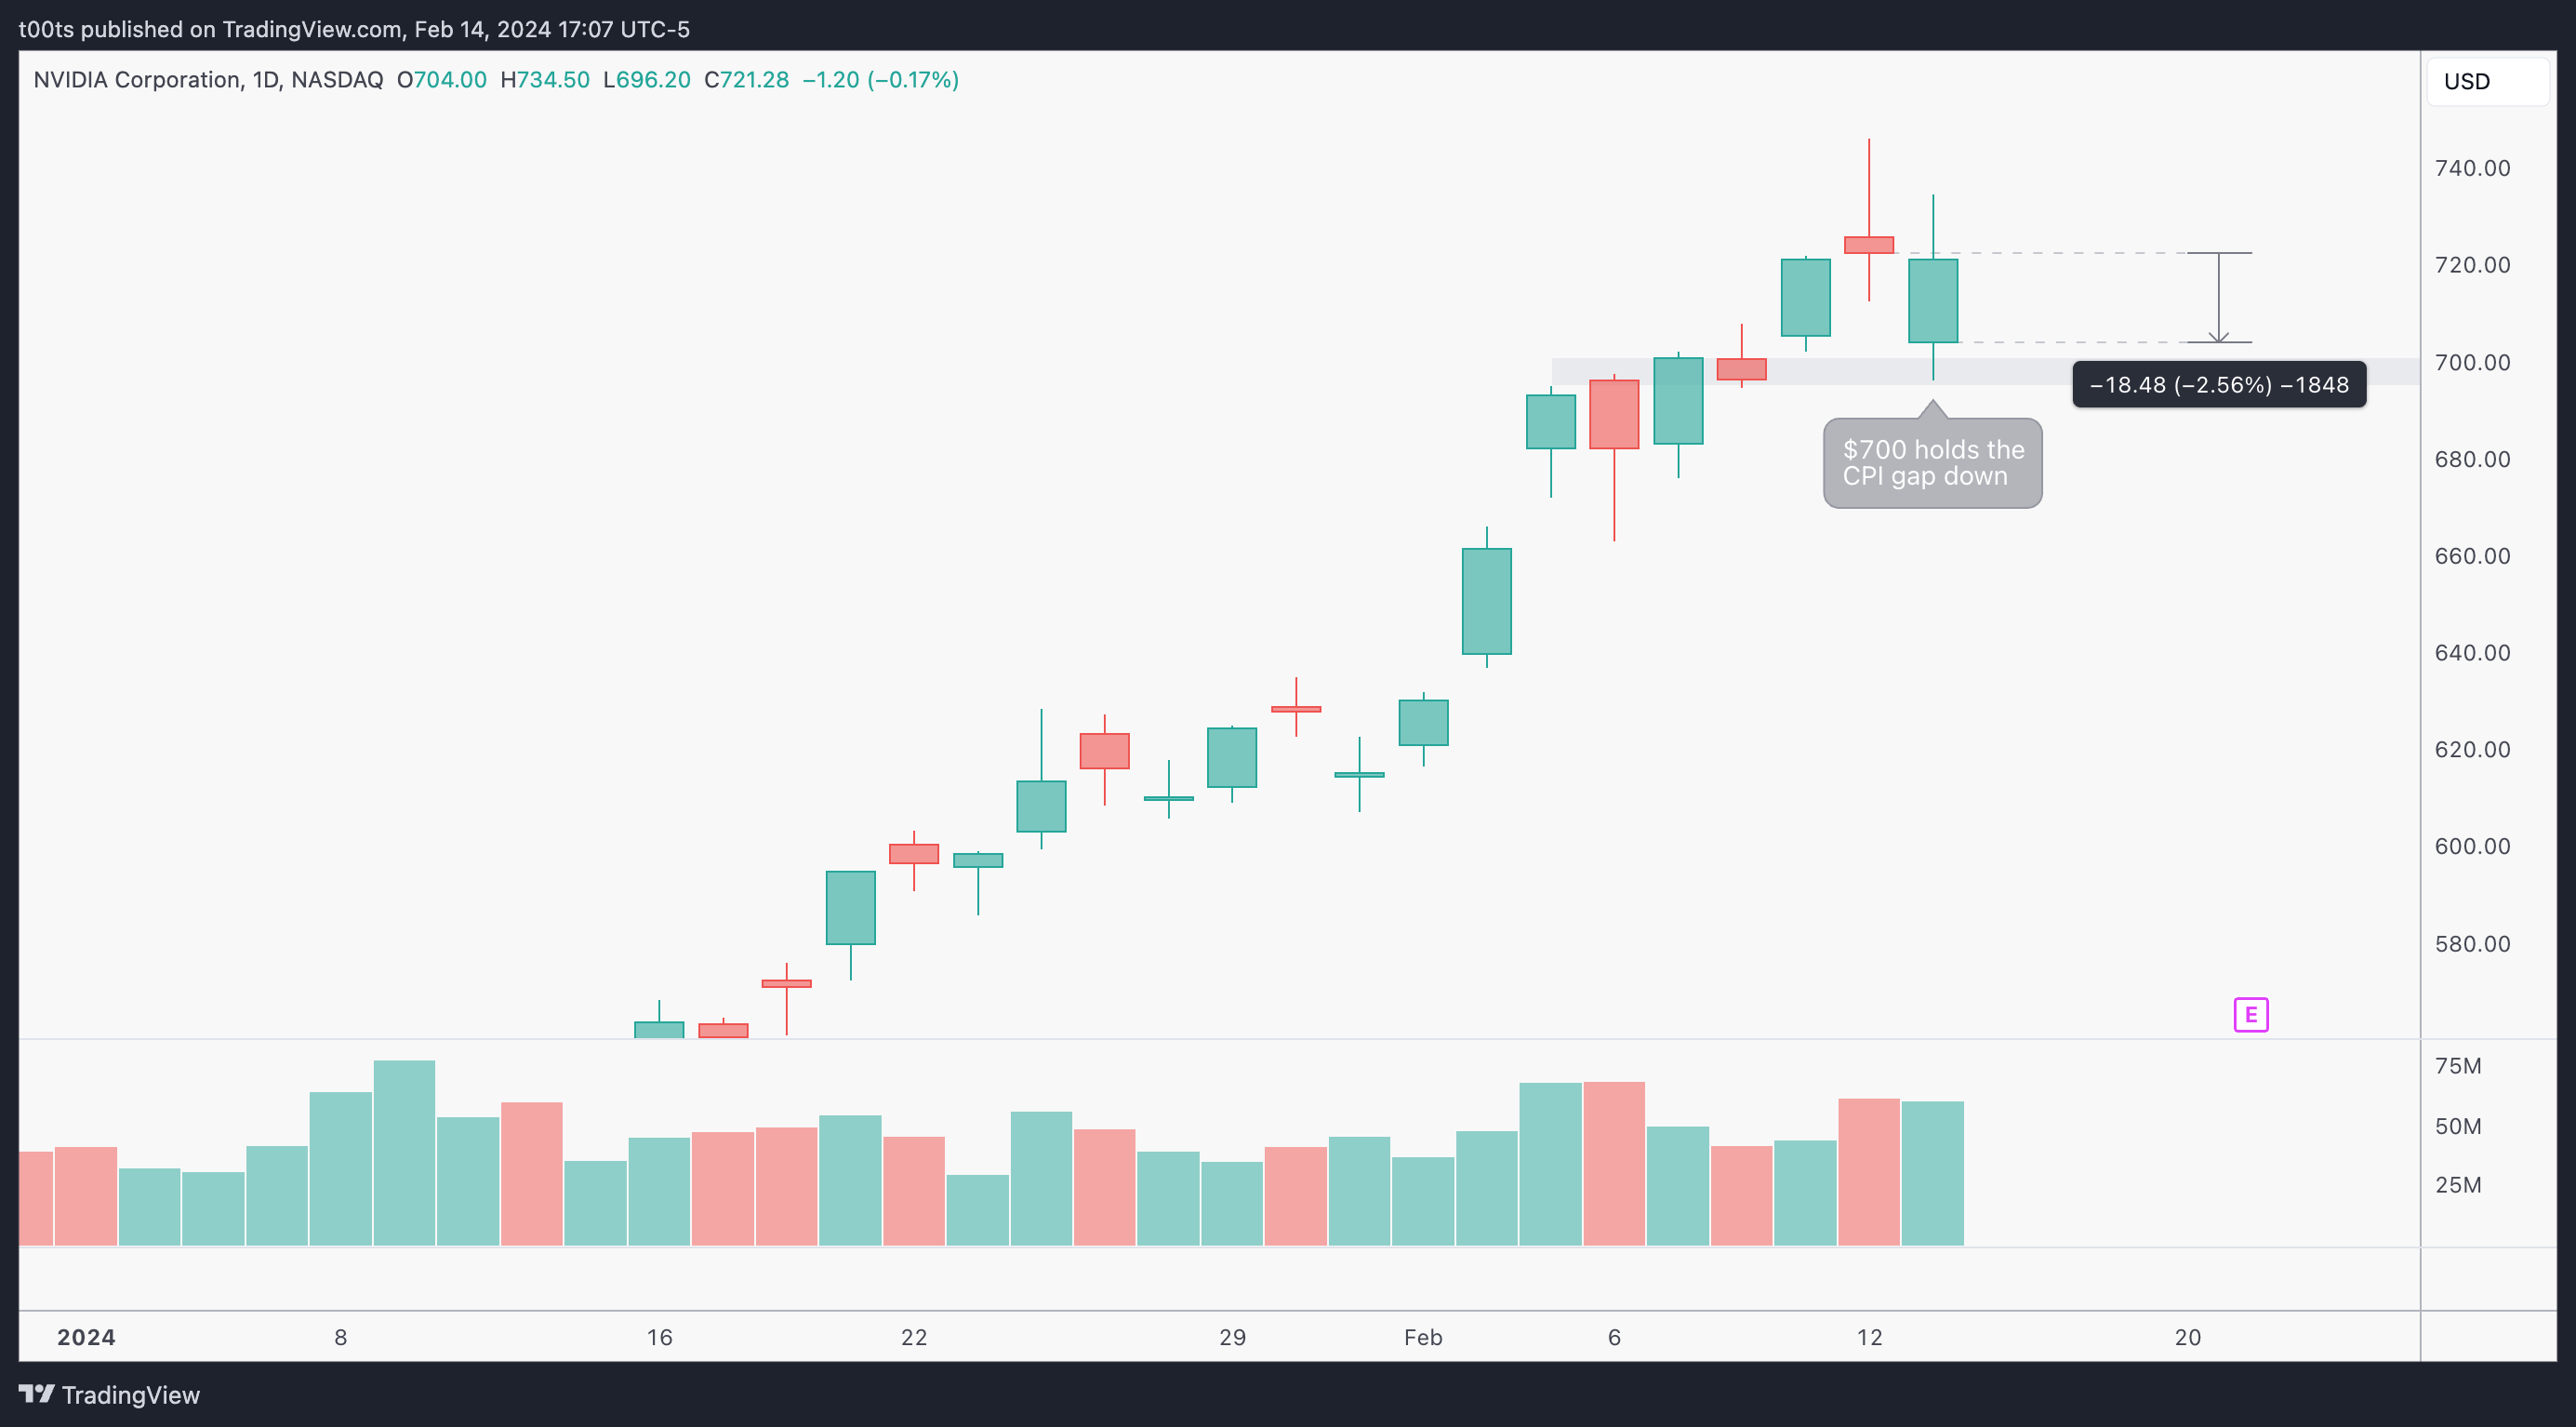
Daily chart
Here we get more details on what we just saw on the weekly chart above. It's important to note how price gapped down on a hot CPI print, yet buyers immediately picked it back up and managed to put in a pretty solid green day, even after that high volume ugly red bar.
The $700 area appears to be strong.
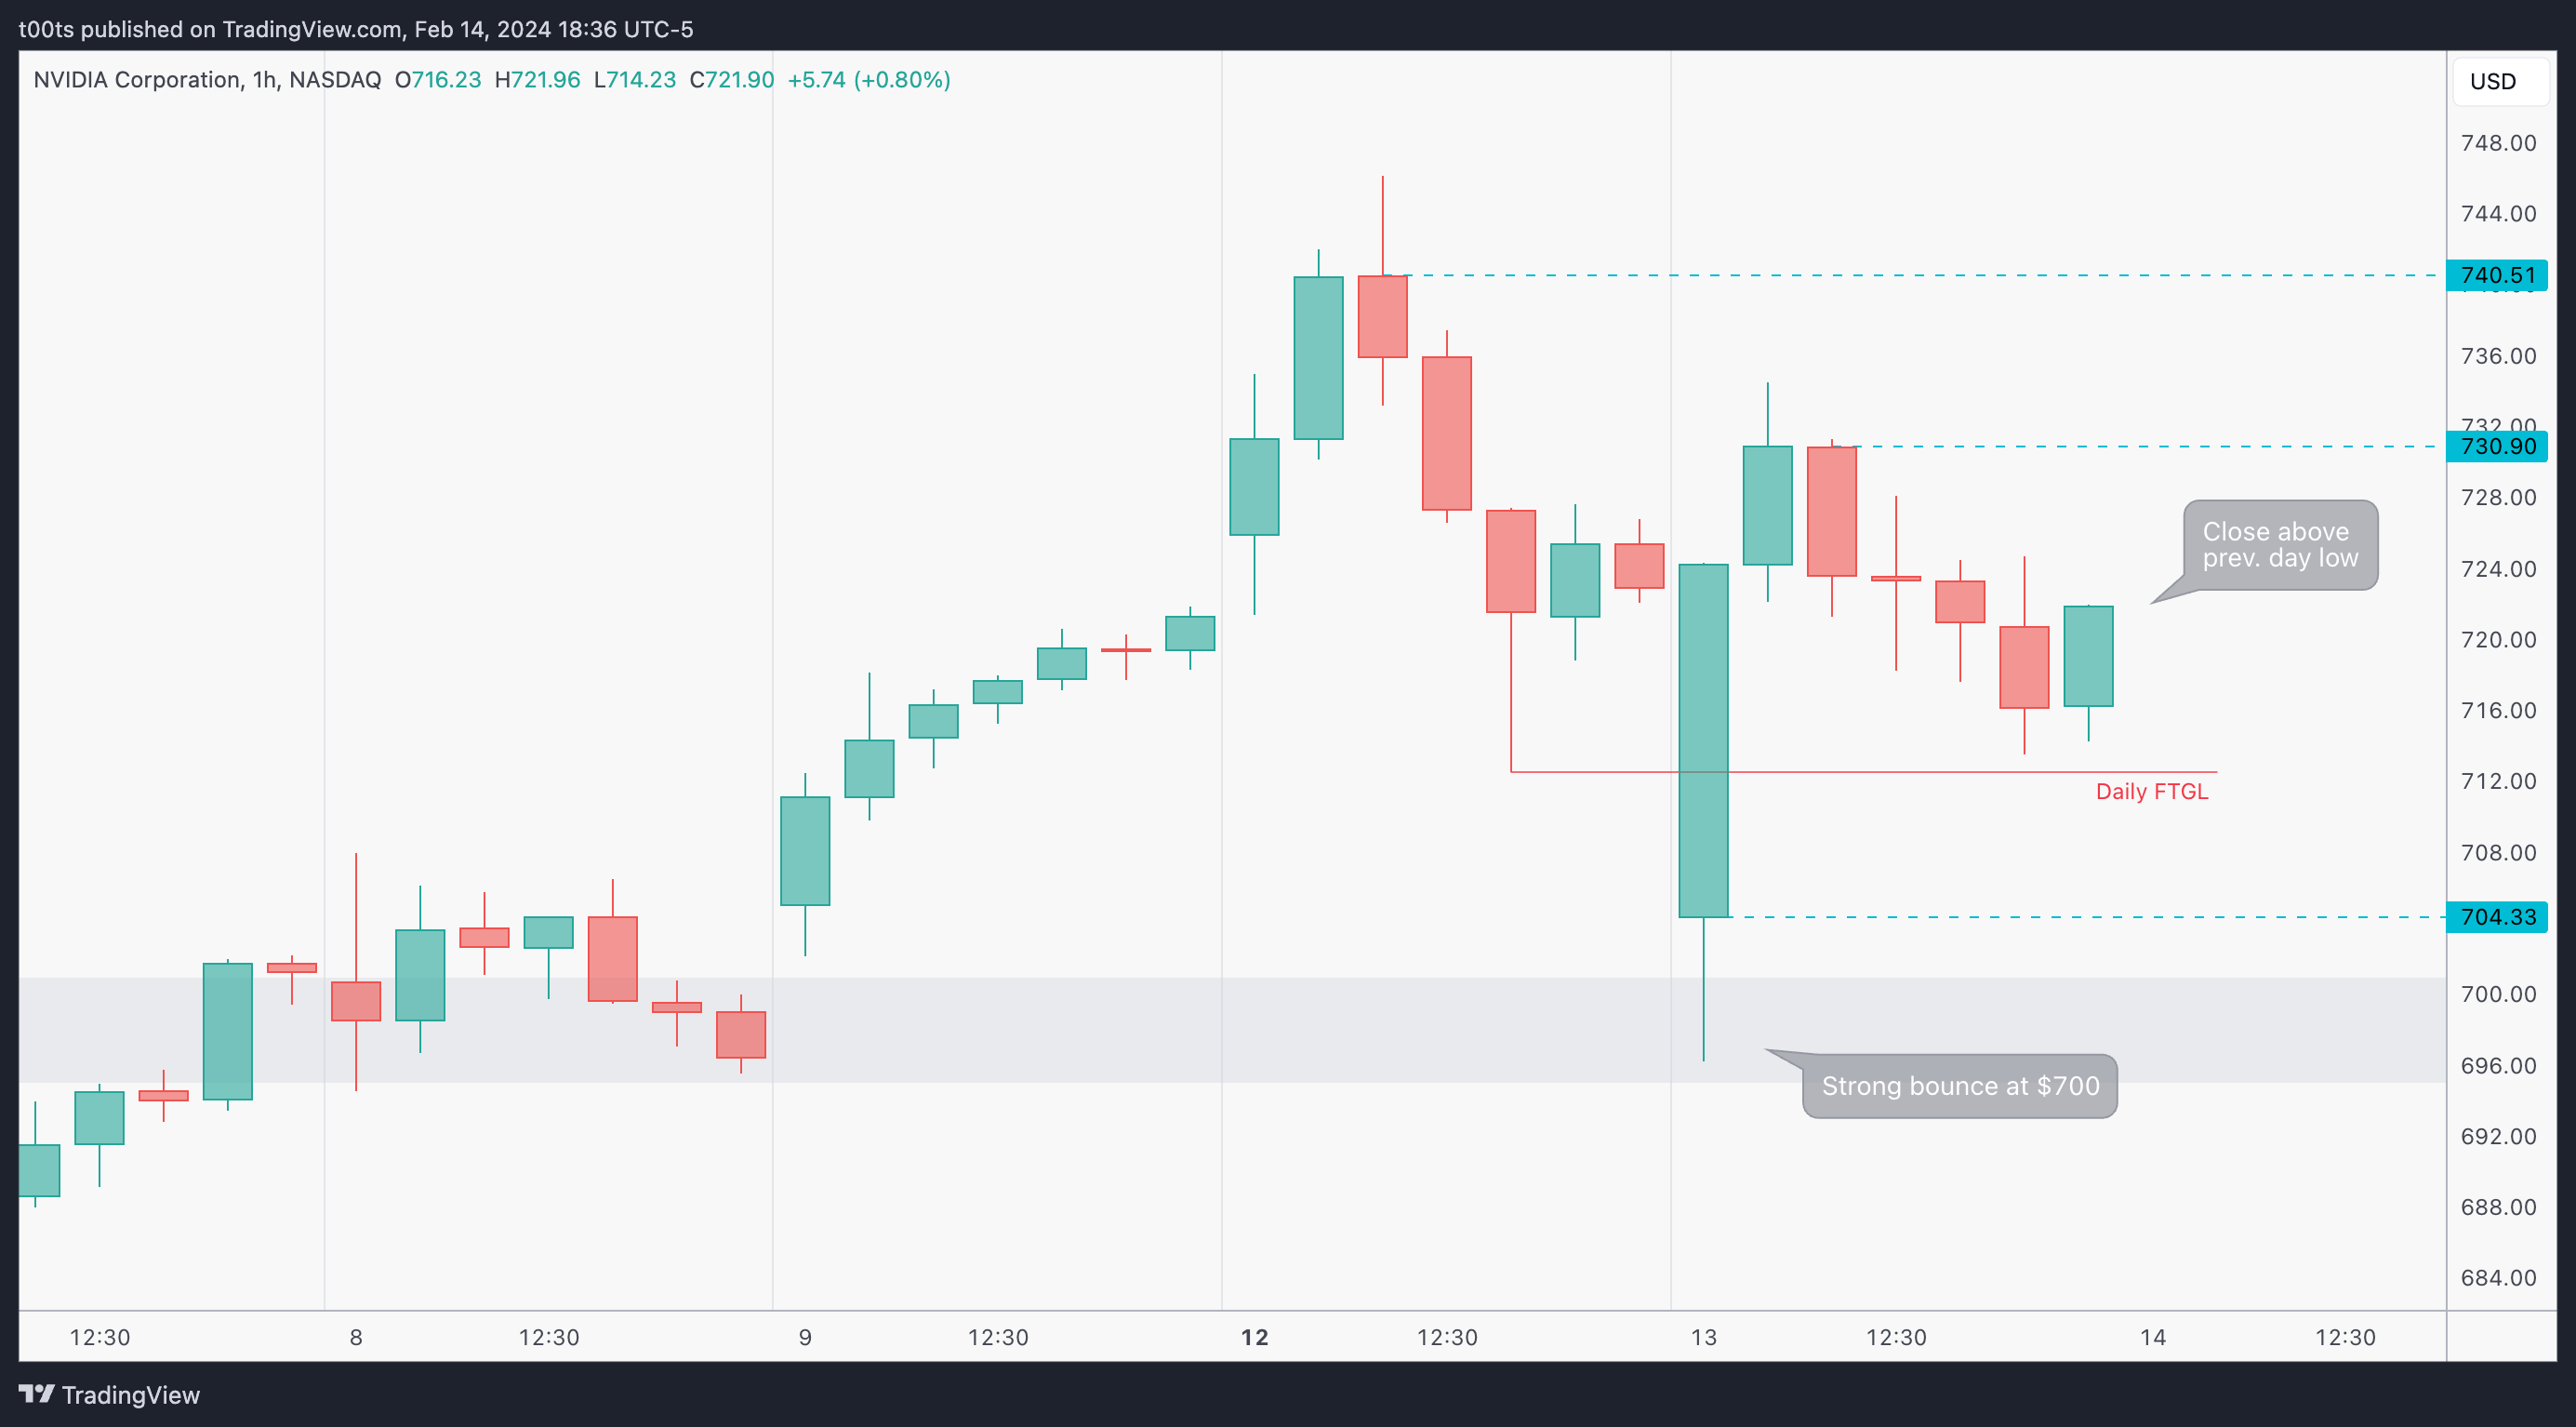
Hourly chart
Price is currently in a range, although the keen eye might have observed there's technically a daily failure to go lower on that strong CPI bounce, as price closed above the prev. day's lows. This was not obvious in the daily chart, but is certainly very interesting to note because it paves the way for a clear long from $730.90 to $740.51. Both of these levels are near round numbers, so we can count on more eyes if they do trade.
On the downside, that $704.33 has proven to be very strong, as it's near the $700 area. Overall, looking for shorts above this $700 mark doesn’t seem ideal…
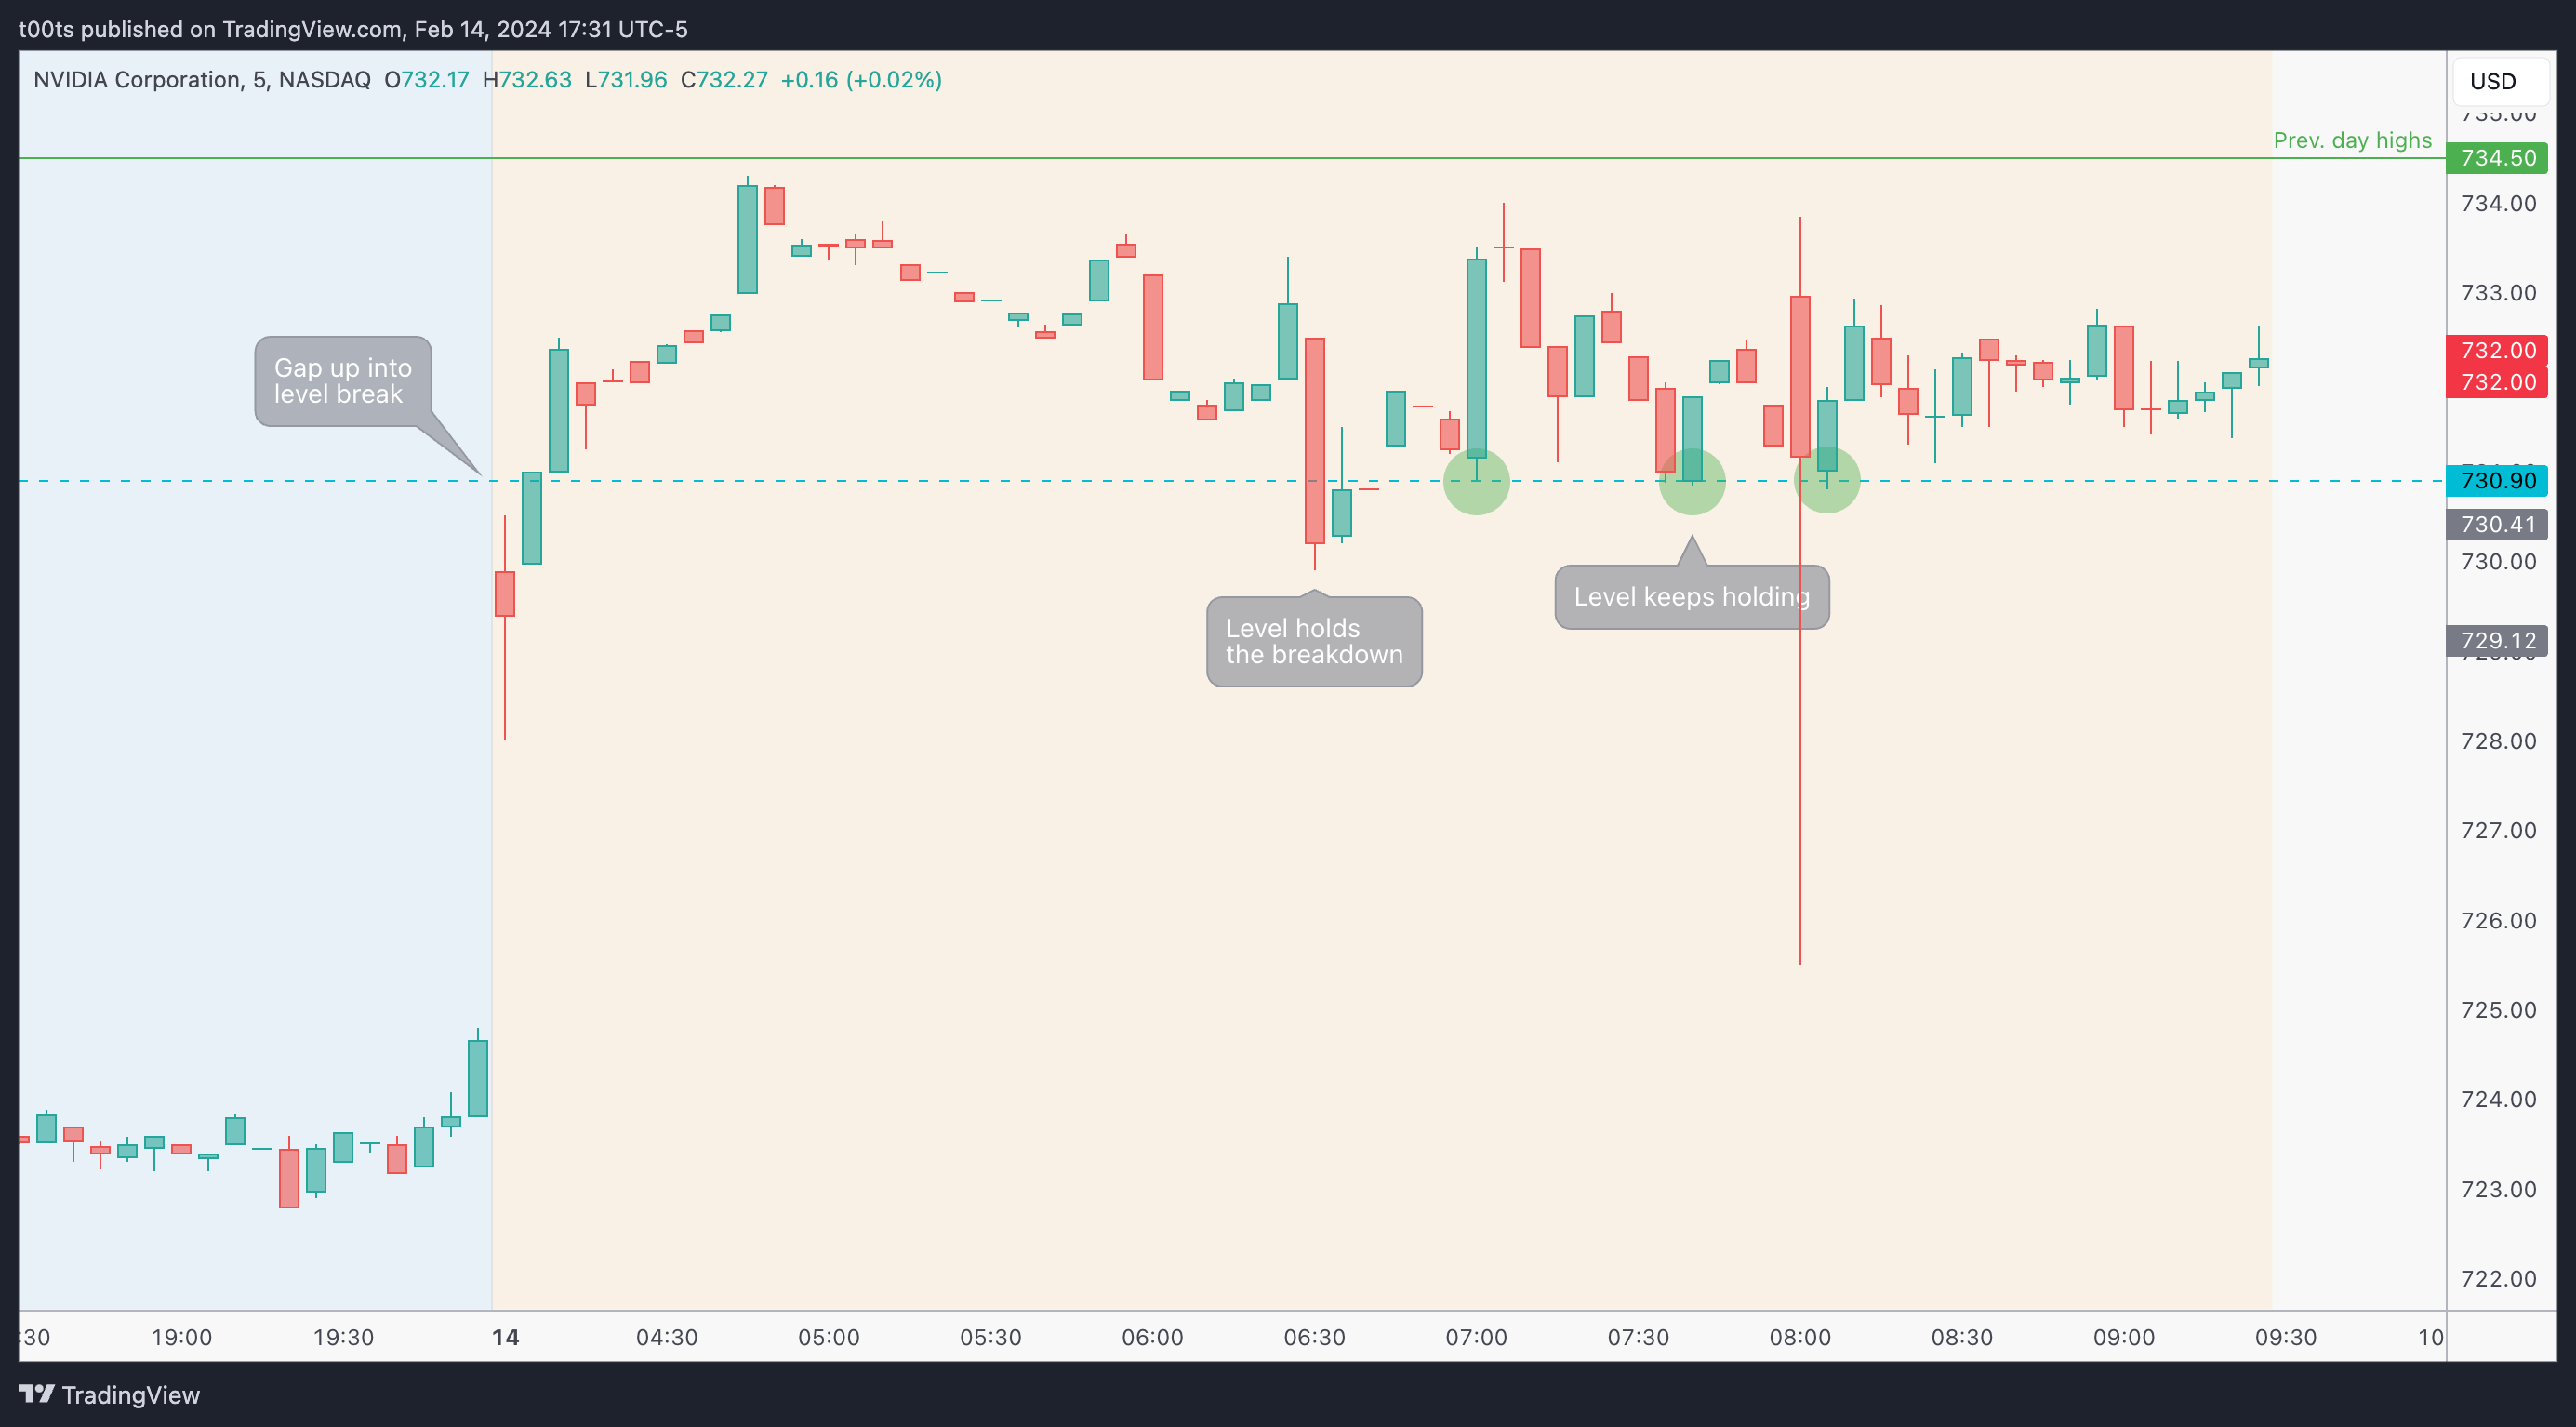
Pre-market action
What a beautiful pre-market chart. We get a nice gap up above our level of interest and price consolidates above it, all the way into the open. Note how the level holds every time it gets tested.
The trade
I came in late to the day and scanned charts. This NVDA chart caught my attention, let me outline my CPT and go over the trade:
Cue(s)
Market leading stock in strongest sector
Stock losing momentum after a +45% rally in just 5 weeks
Intraday cue: Bulls fails to take over the $740.51, forming an intraday double top
Intraday cue: Price breaks back below prev. day highs, setting up a potential daily failure
Intraday cue: Price breaks back below the opening print with strength
Intraday cue: Price breaks the low of day as the $730.90 gives up
Intraday cue: Price rejects twice at the $730.90
Plan
The plan is to short a rejection at the $730.90 and ride it down to the next level (not shown), risking the opening print which is around 2pts away from our entry.
Trigger
Price rejecting the level
5m chart
We're just looking at the 5m chart as I rarely use the 2m past noon. Let's go over it:
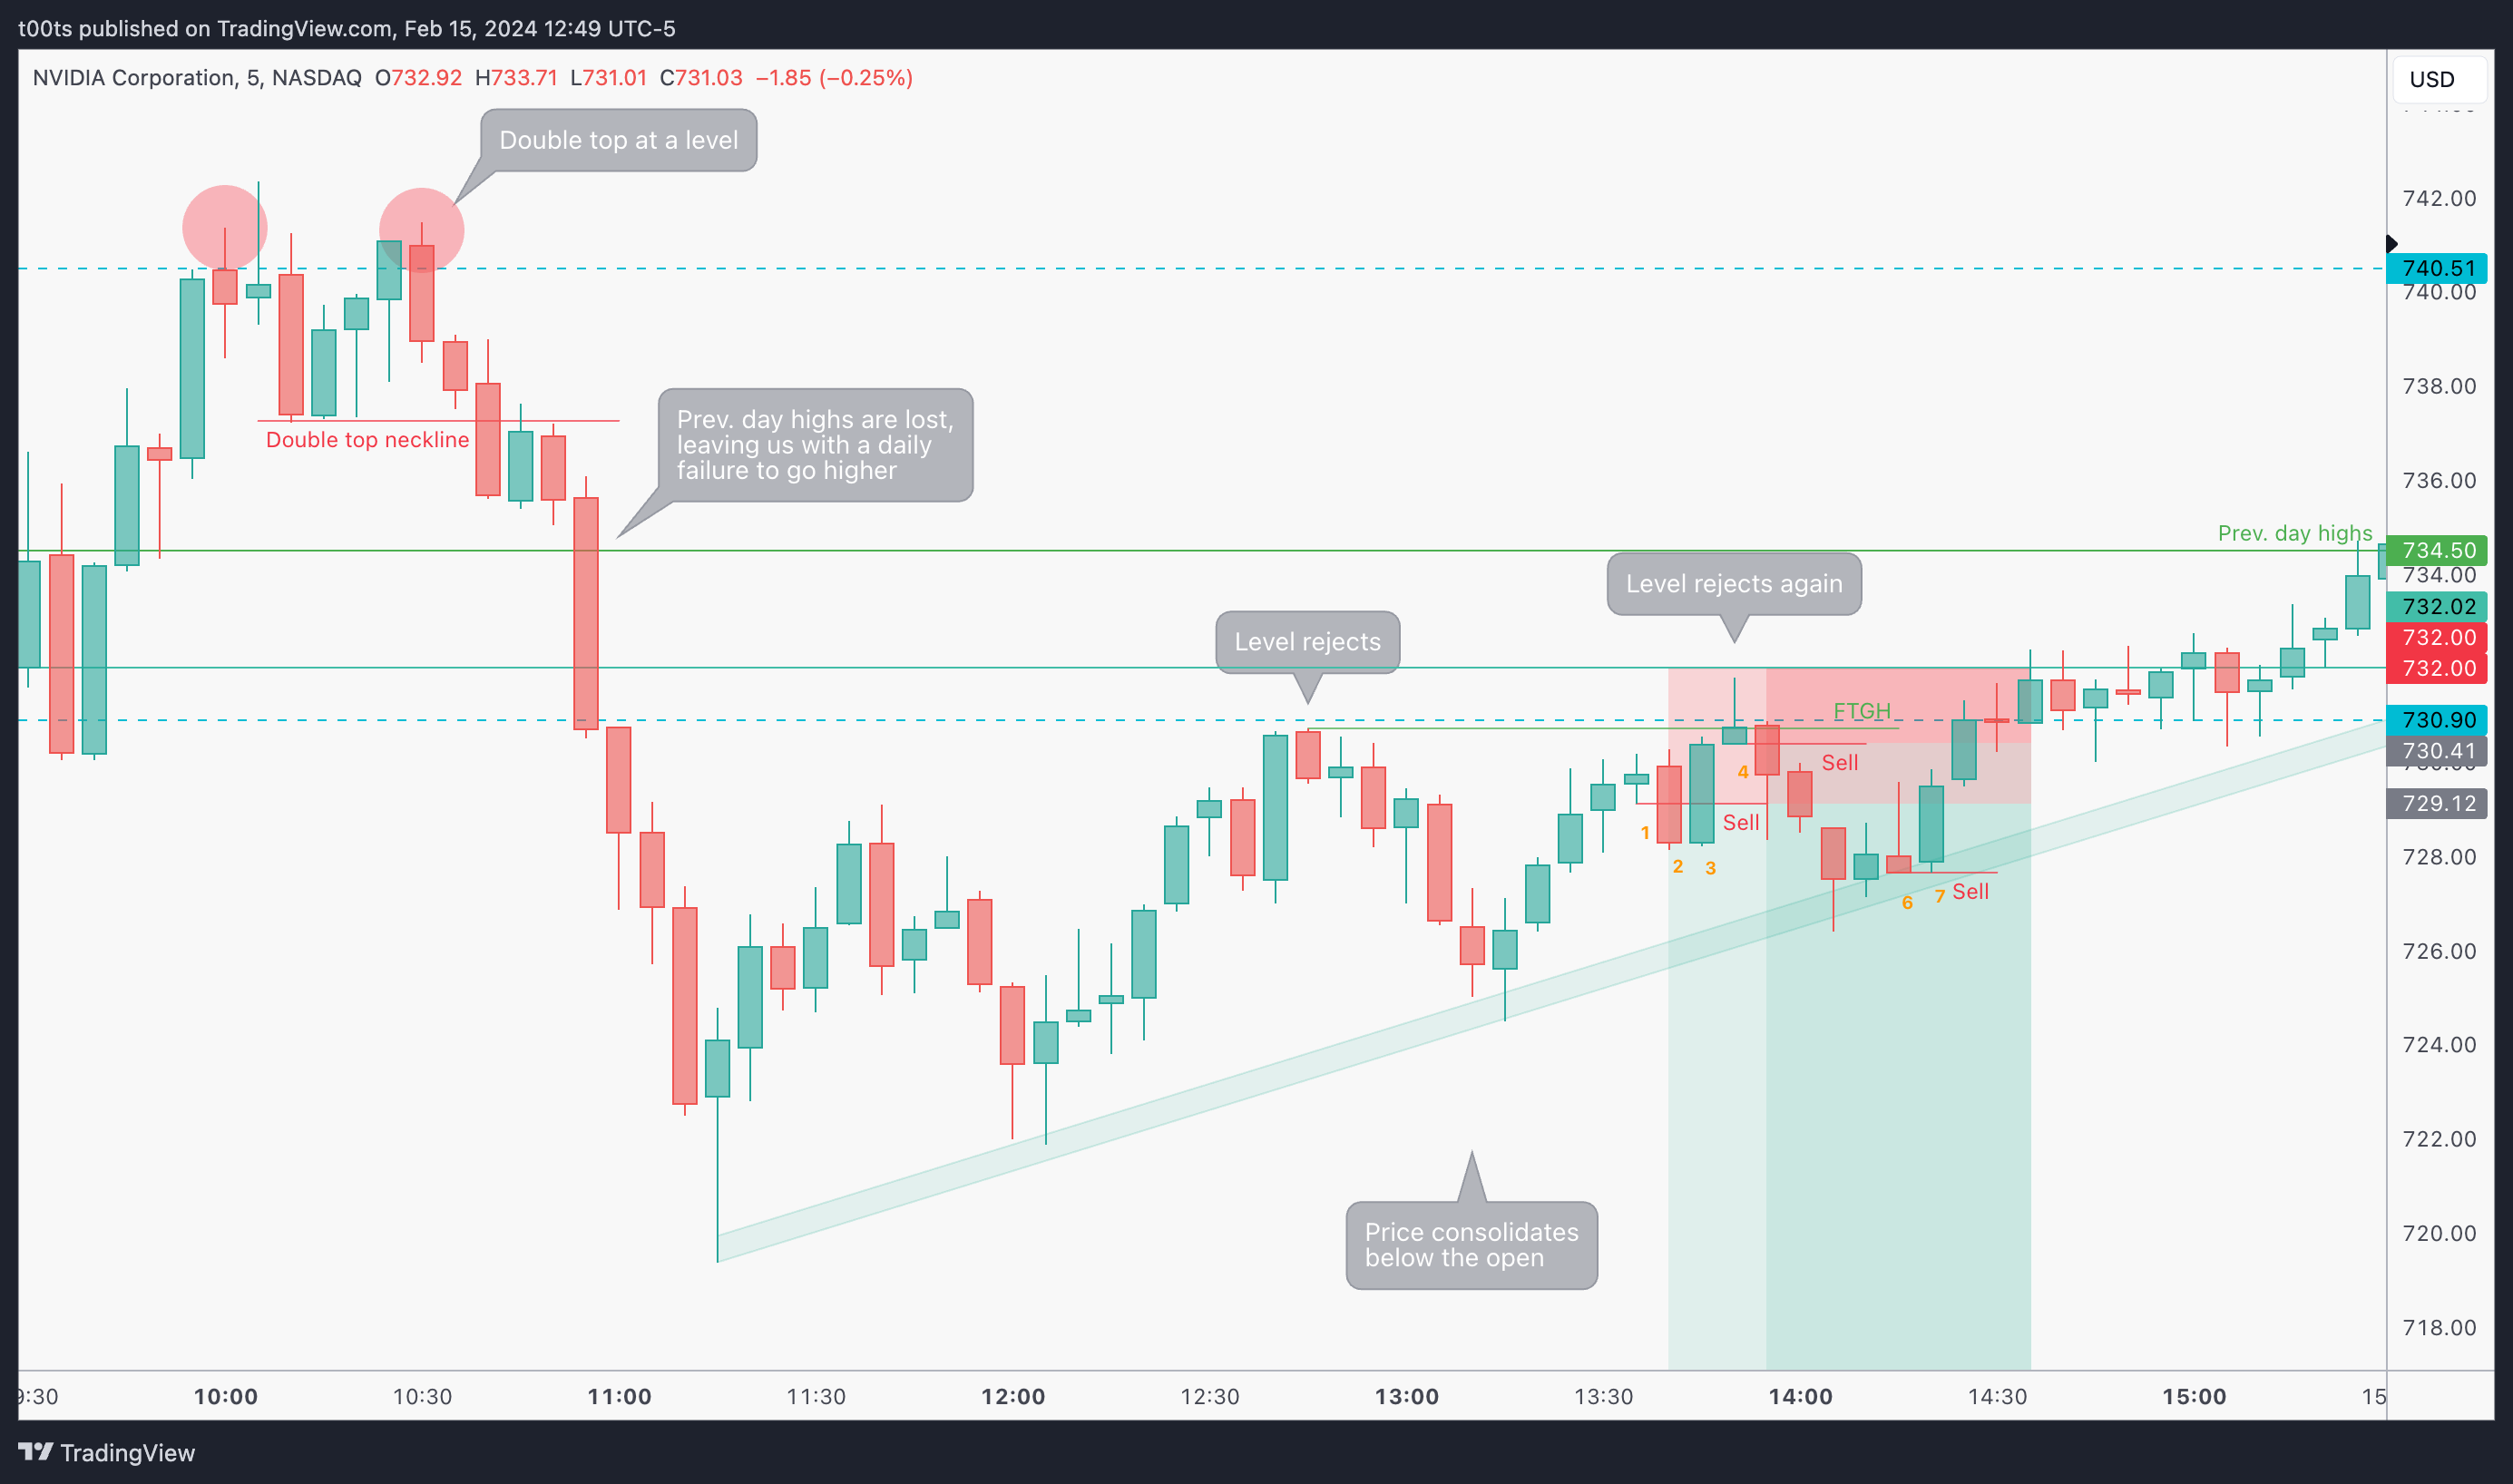
First we get our long opening drive trade which we went over on yesterday's post.
Price pulls back as the $740 area rejects, but bulls give it a second try. They fail again, setting up a potential intraday double top that will eventually trigger a few bars later.
After breaking the double top neckline, price actually retests it very cleanly before making the real move towards the downside. I guess you could've traded that if you were keen enough to spot it in real time.
Price drops over 15 points from the retest of the double top neckline to the first bounce. That's quite a strong move. These strong moves are usually followed by pullbacks or consolidations and, more often than not, a continuation move to the downside.
Price starts consolidating below the $730 area for a while. As a quick reminder, we're below the opening print at this point, so the daily candle is red, and is also setting up a potential failure after breaking prev. day highs and pulling back below them; which leaves us with a pretty bearish short-term look on the higher timeframes. The hourly chart is showing a tight consolidation below the level which, in my opinion, was asking for a red trend bar to follow. All these things aligned gave me reasons to position myself for a potential continuation move down.
So now let's go into the trade, bar by bar:
Bar 1 is a small inside doji bar that is potentially creating a lower high after that previous pivot that rejected near the $730.90 level. A break below it sets us up for a potential move down.
Bar 2 triggers that short entry.
Bar 3 is almost an outside bar that closes above Bar 2. We knew this could happen. There's a level above that hadn't been tested. So we're OK with this at this point and are looking forward to see how price reacts to the level.
Bar 4 wicks off the level and is exactly the type of reaction we wanted to see. It also creates a failure pattern off the highs of the previous pivot and sets up another entry to add our remaining position which triggers on the next bar.
The trade starts working. At this point, all we need is for price to break that support trendline that's been holding throughout this large consolidation.
Bar 6 bounces off the trendline, but sellers manage to win that battle and the bar closes as a bearish inverse hammer, setting us up for a potential breakdown and even offering us yet another entry level.
Bar 7 is exactly the last thing we'd like to see after that previous bearish bar. Buyers make themselves strong in the trendline and it's clear sellers have lost the battle as soon as the next bar trends back up into the level.
The opening print gets tested and from then price starts teasing both sides for around 40 minutes, although the truth is every quick drop is bought back up. Buyers hold onto that $730.90 and they eventually squeeze out all shorts into the close (not shown).
Closing notes
Honestly, I felt a quite frustrated about this trade not working. I thought it had so many ingredients for a successful short, but judging by the squeeze towards the end of the day, it seems that the trade was too crowded.
Everyone is eagerly waiting for this pullback to happen and no one wants to miss it. When everyone wants the same thing, it just won't happen. We'll have to wait for the next one.
I am posting one trade writeup every day throughout 2024. I focus on large caps using levels and price action. The subscription is absolutely free and will always be. I will strive to provide value by offering clues and ideas for you to enhance your edge. Let’s grow together!