

Higher timeframe context
What can I say about NVIDIA stock that you don't already know? The AI hype wave has brought this name to everyone's watchlist.
By now there's probably a mix of investors piling in and shorts getting hammered. There's no doubt that a large percentage of traders are waiting for any signal to bet against this name, hoping to catch a significant drop as price reverts to its mean.
So far, every quick drop is getting bought up, adding to the despair of impatient short sellers who are trying to nail a top that never seems to come.
Side note: Don’t try to catch tops and bottoms. We’ve gone over how to properly trade reversals. It’s not hard. Go back and read those posts if needed.
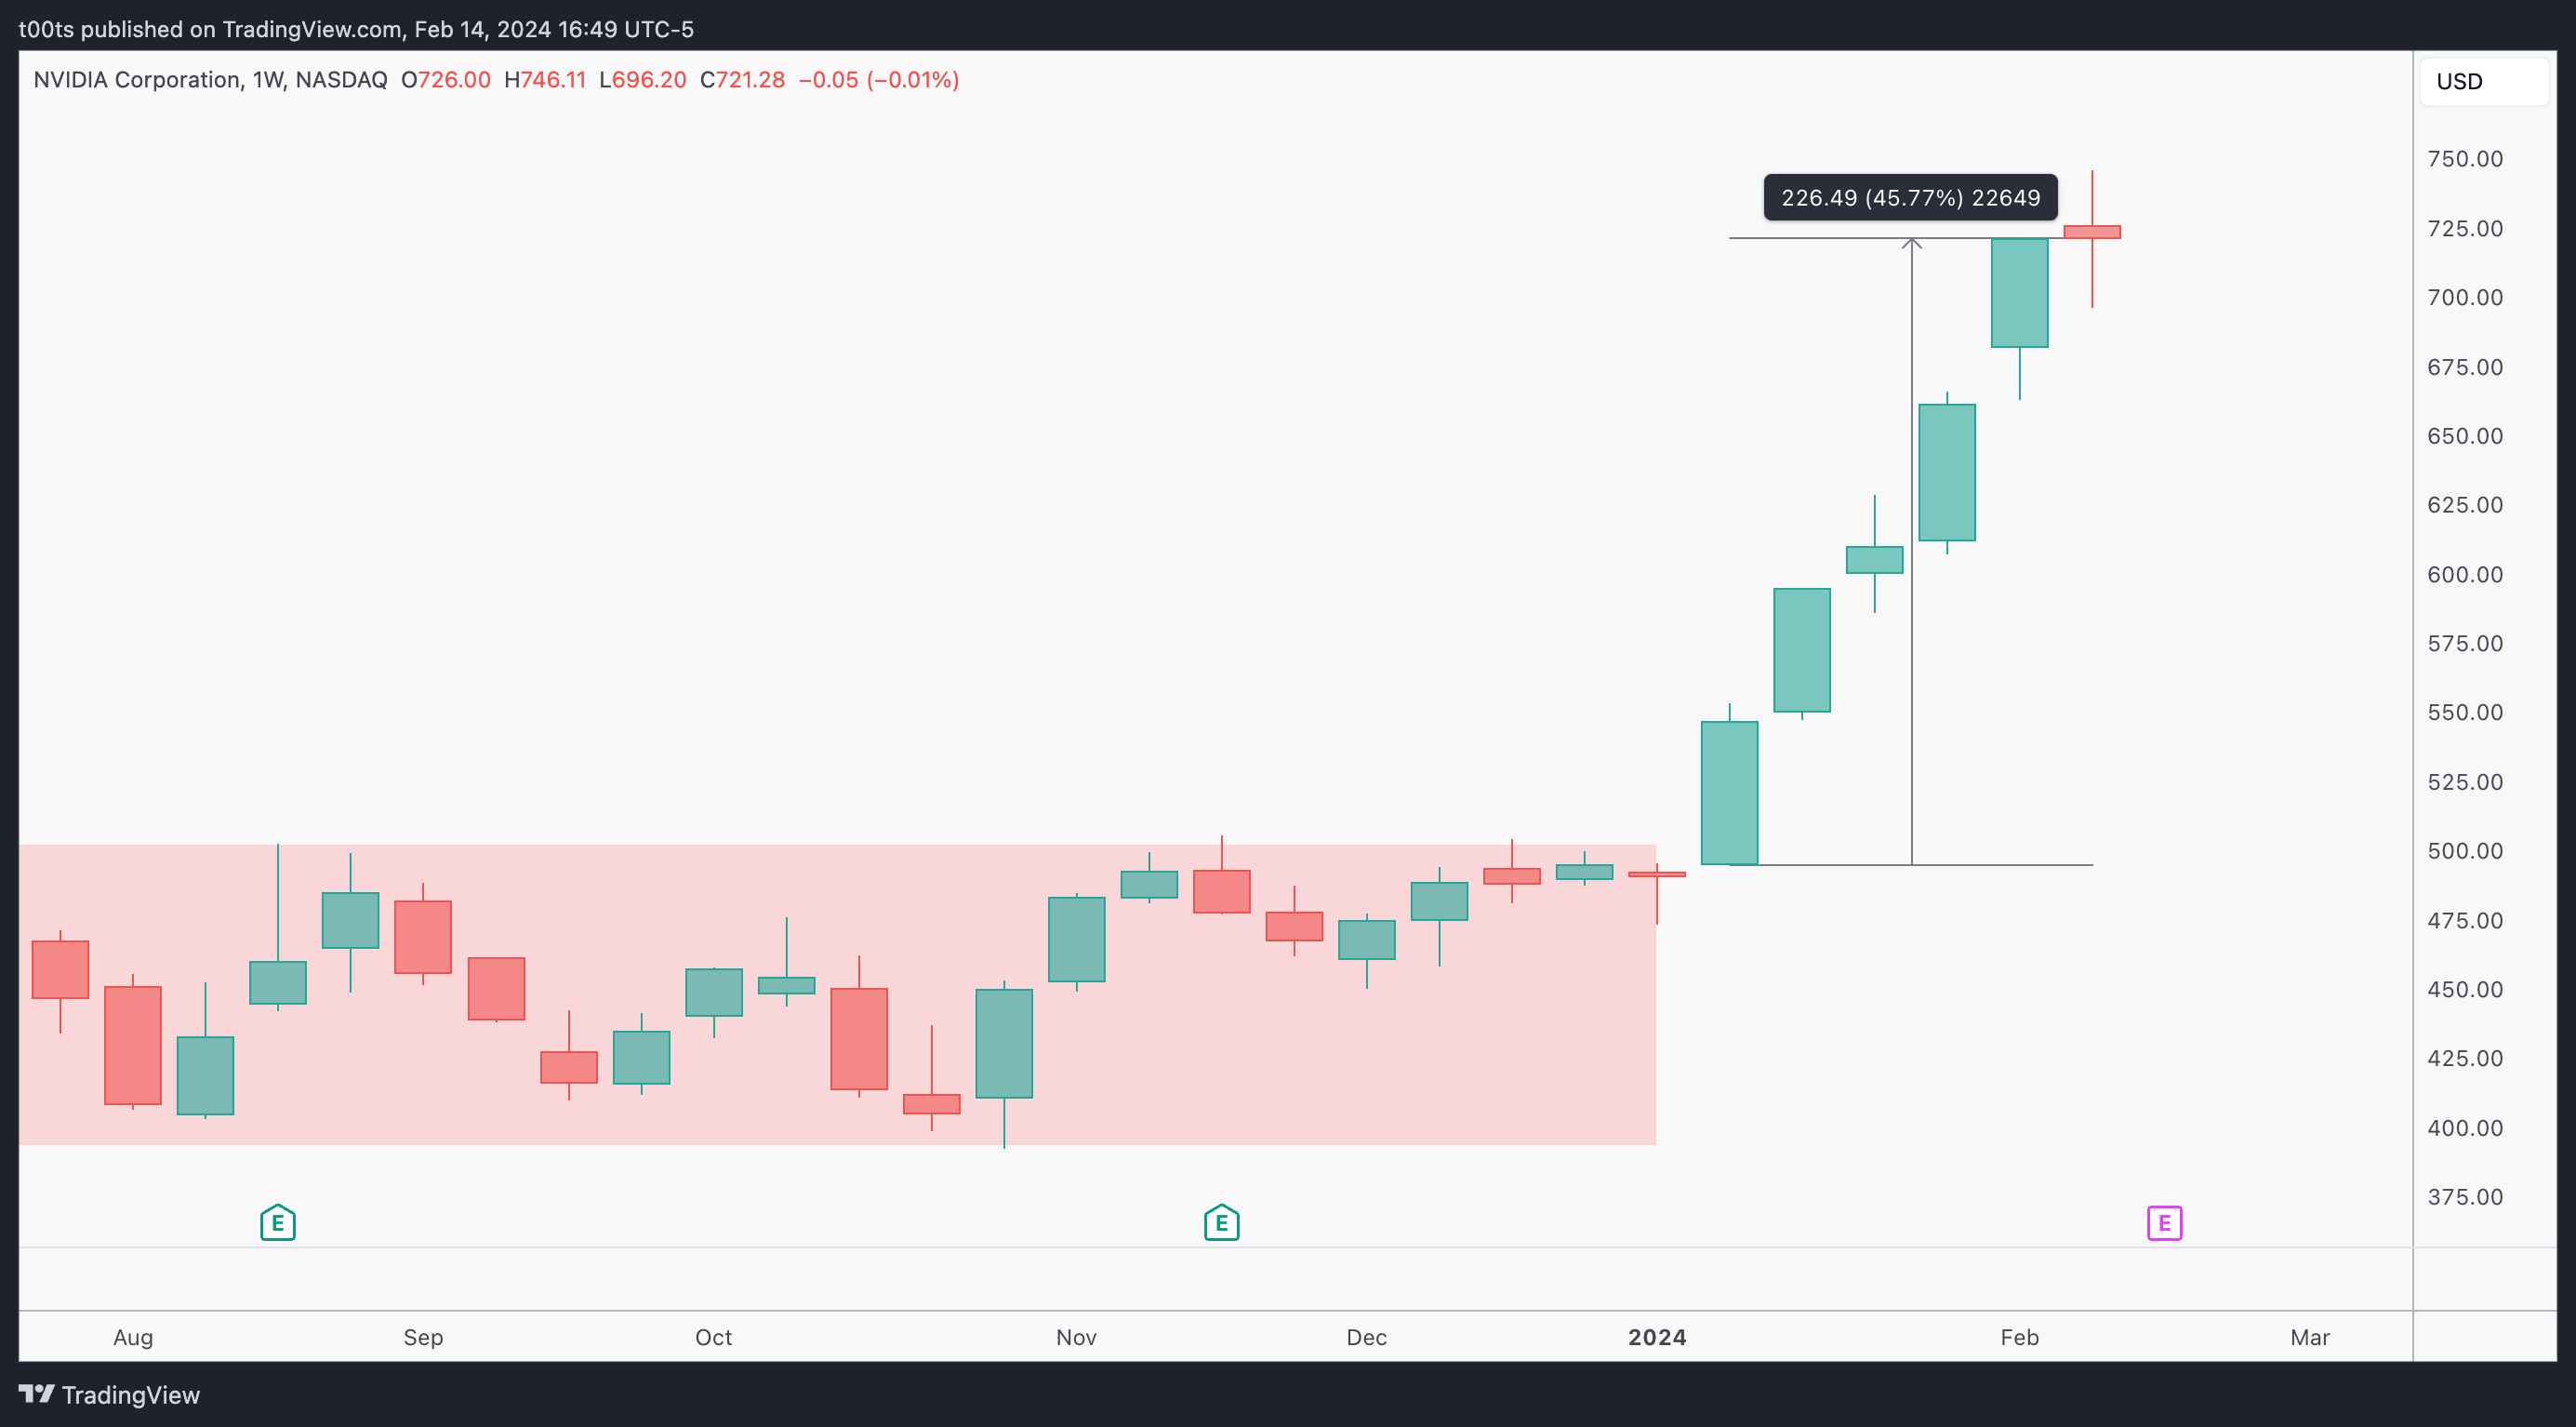
Weekly chart
Won't go into the obvious here because everyone is well aware of this monster move by now. Stock is up +45% in 5 weeks. The AI hype is driving the market and NVDA has been leading the way. It seems like she might be setting up for a bit of a pullback, as we're currently below the weekly open after an attempt to continue higher.
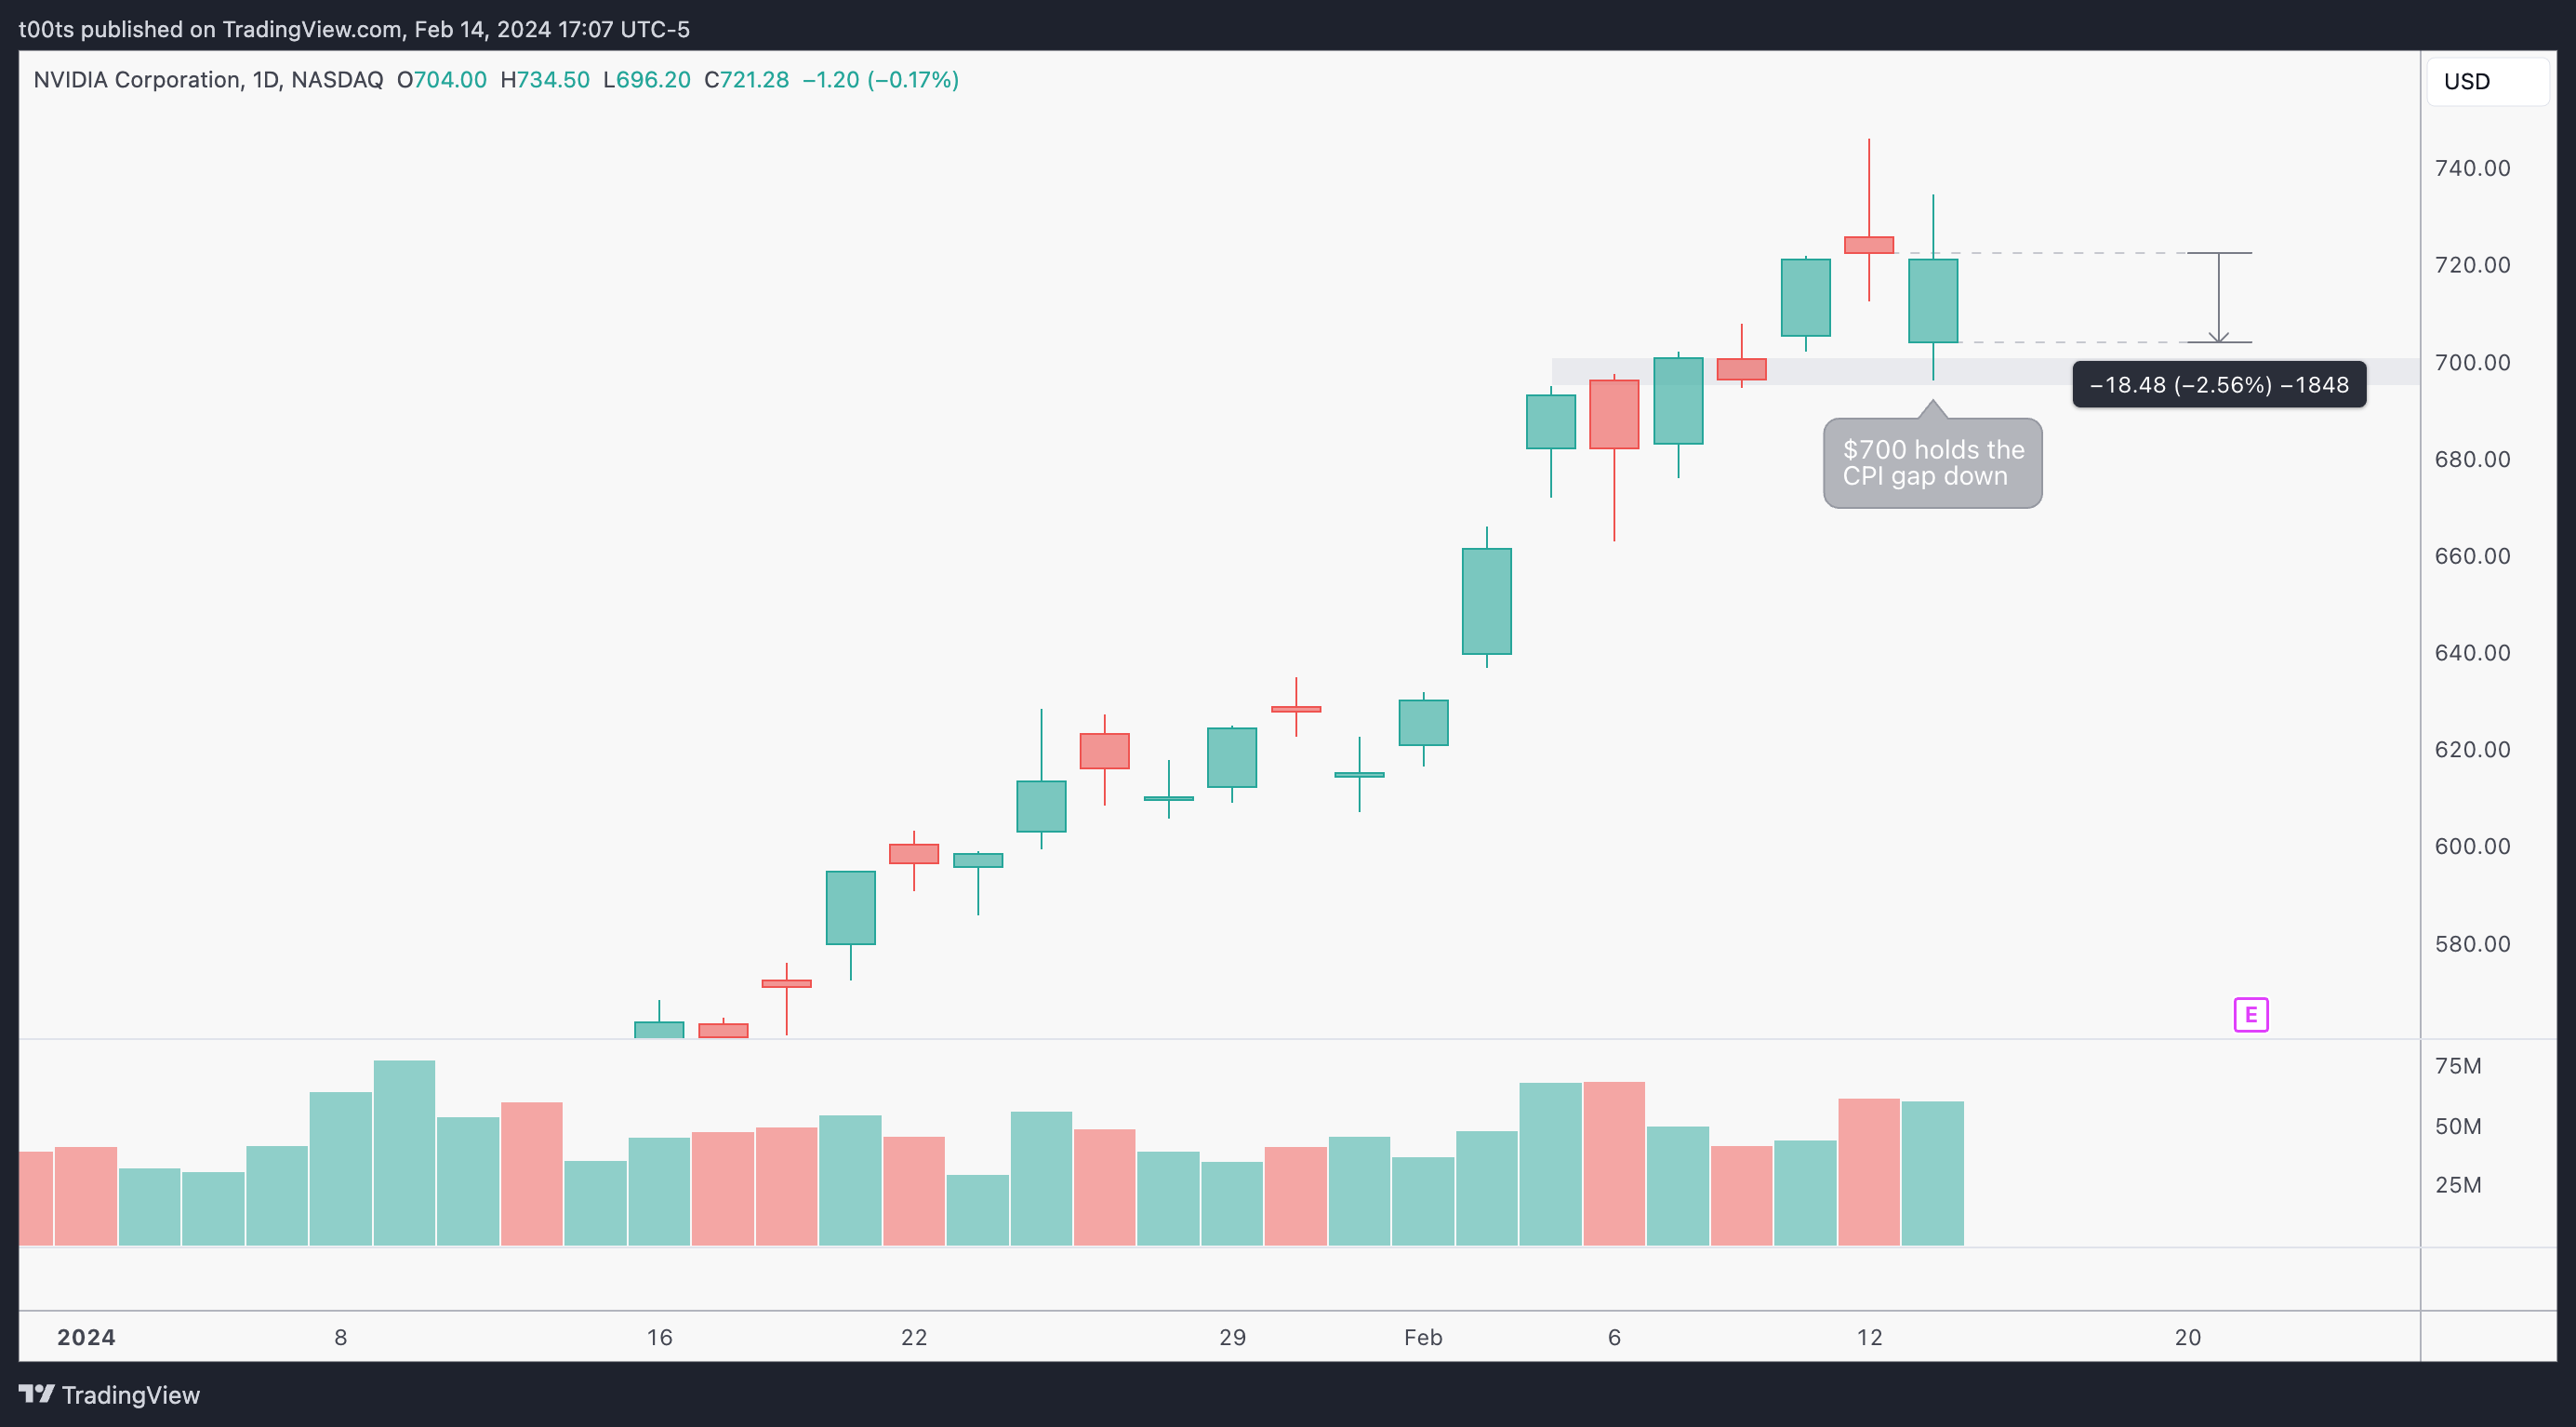
Daily chart
Here we get more details on what we just saw on the weekly chart above. It's important to note how price gapped down on a hot CPI print, yet buyers immediately picked it back up and managed to put in a pretty solid green day, even after that high volume ugly red bar.
The $700 area appears to be strong.
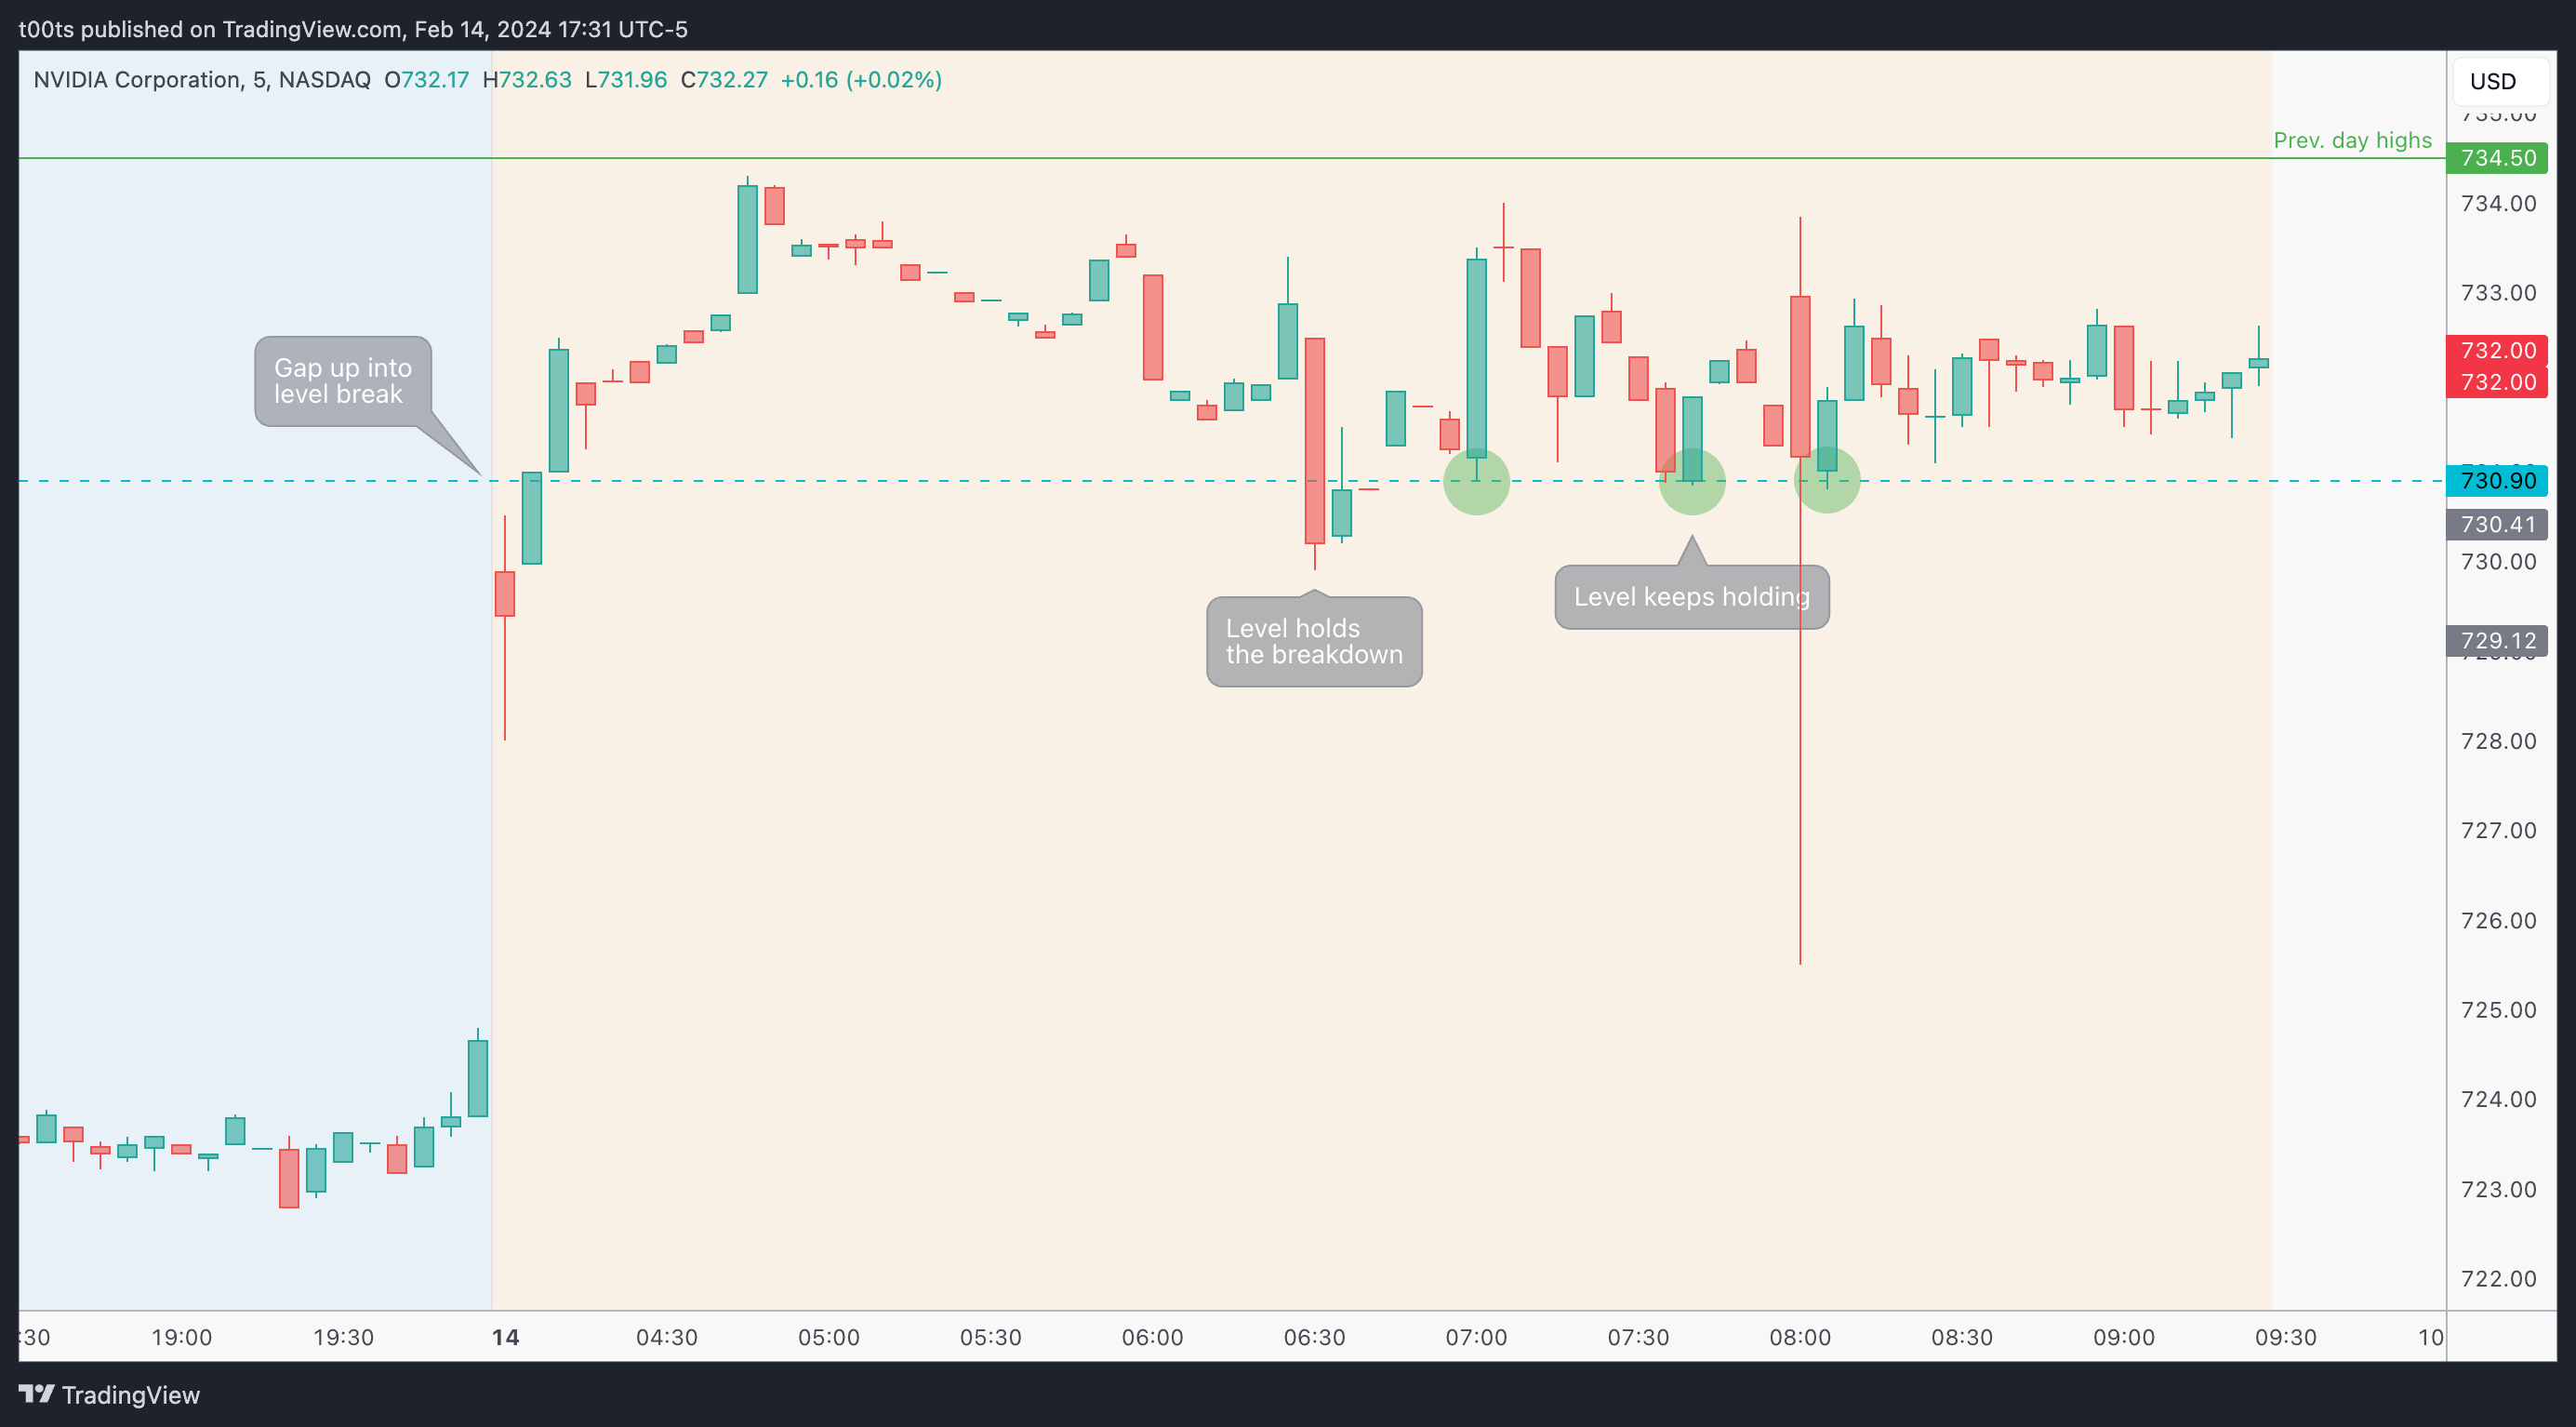
Hourly chart
Price is currently in a range, although the keen eye might have observed there's technically a daily failure to go lower on that strong CPI bounce, as price closed above the prev. day's lows. This was not obvious in the daily chart, but is certainly very interesting to note because it paves the way for a clear long from $730.90 to $740.51. Both of these levels are near round numbers, so we can count on more eyes if they do trade.
On the downside, that $704.33 has proven to be very strong, as it's near the $700 area. Overall, looking for shorts above this $700 mark doesn’t seem ideal…

Pre-market action
What a beautiful pre-market chart. We get a nice gap up above our level of interest and price consolidates above it, all the way into the open. Note how the level holds every time it gets tested.
The trade
I bet you've already figured where this is going, but let's outline it using our usual CPT Framework:
Cue(s)
Market leading stock in strongest sector
Fails to close below the first bearish daily bar in a while, even after a 2.5% gap down
Gapping up over a level in the pre-market
Intraday cue: Price bouncing at the level and reclaiming the opening print
Plan
This has all the ingredients for an opening drive play. We've seen a lot of these. Our plan is always the same: Look for a retest of the level near the open and watch for a reaction. If buyers step in, go long risking the lows.
For further confirmation, we'd love to see a dip below the $730 round number, as quite possibly there's many stops sitting there from buyers that have been accumulating during this pre-market range action.
Trigger(s)
Price bouncing off the $730.90 level
Price reclaiming the opening print
2m chart
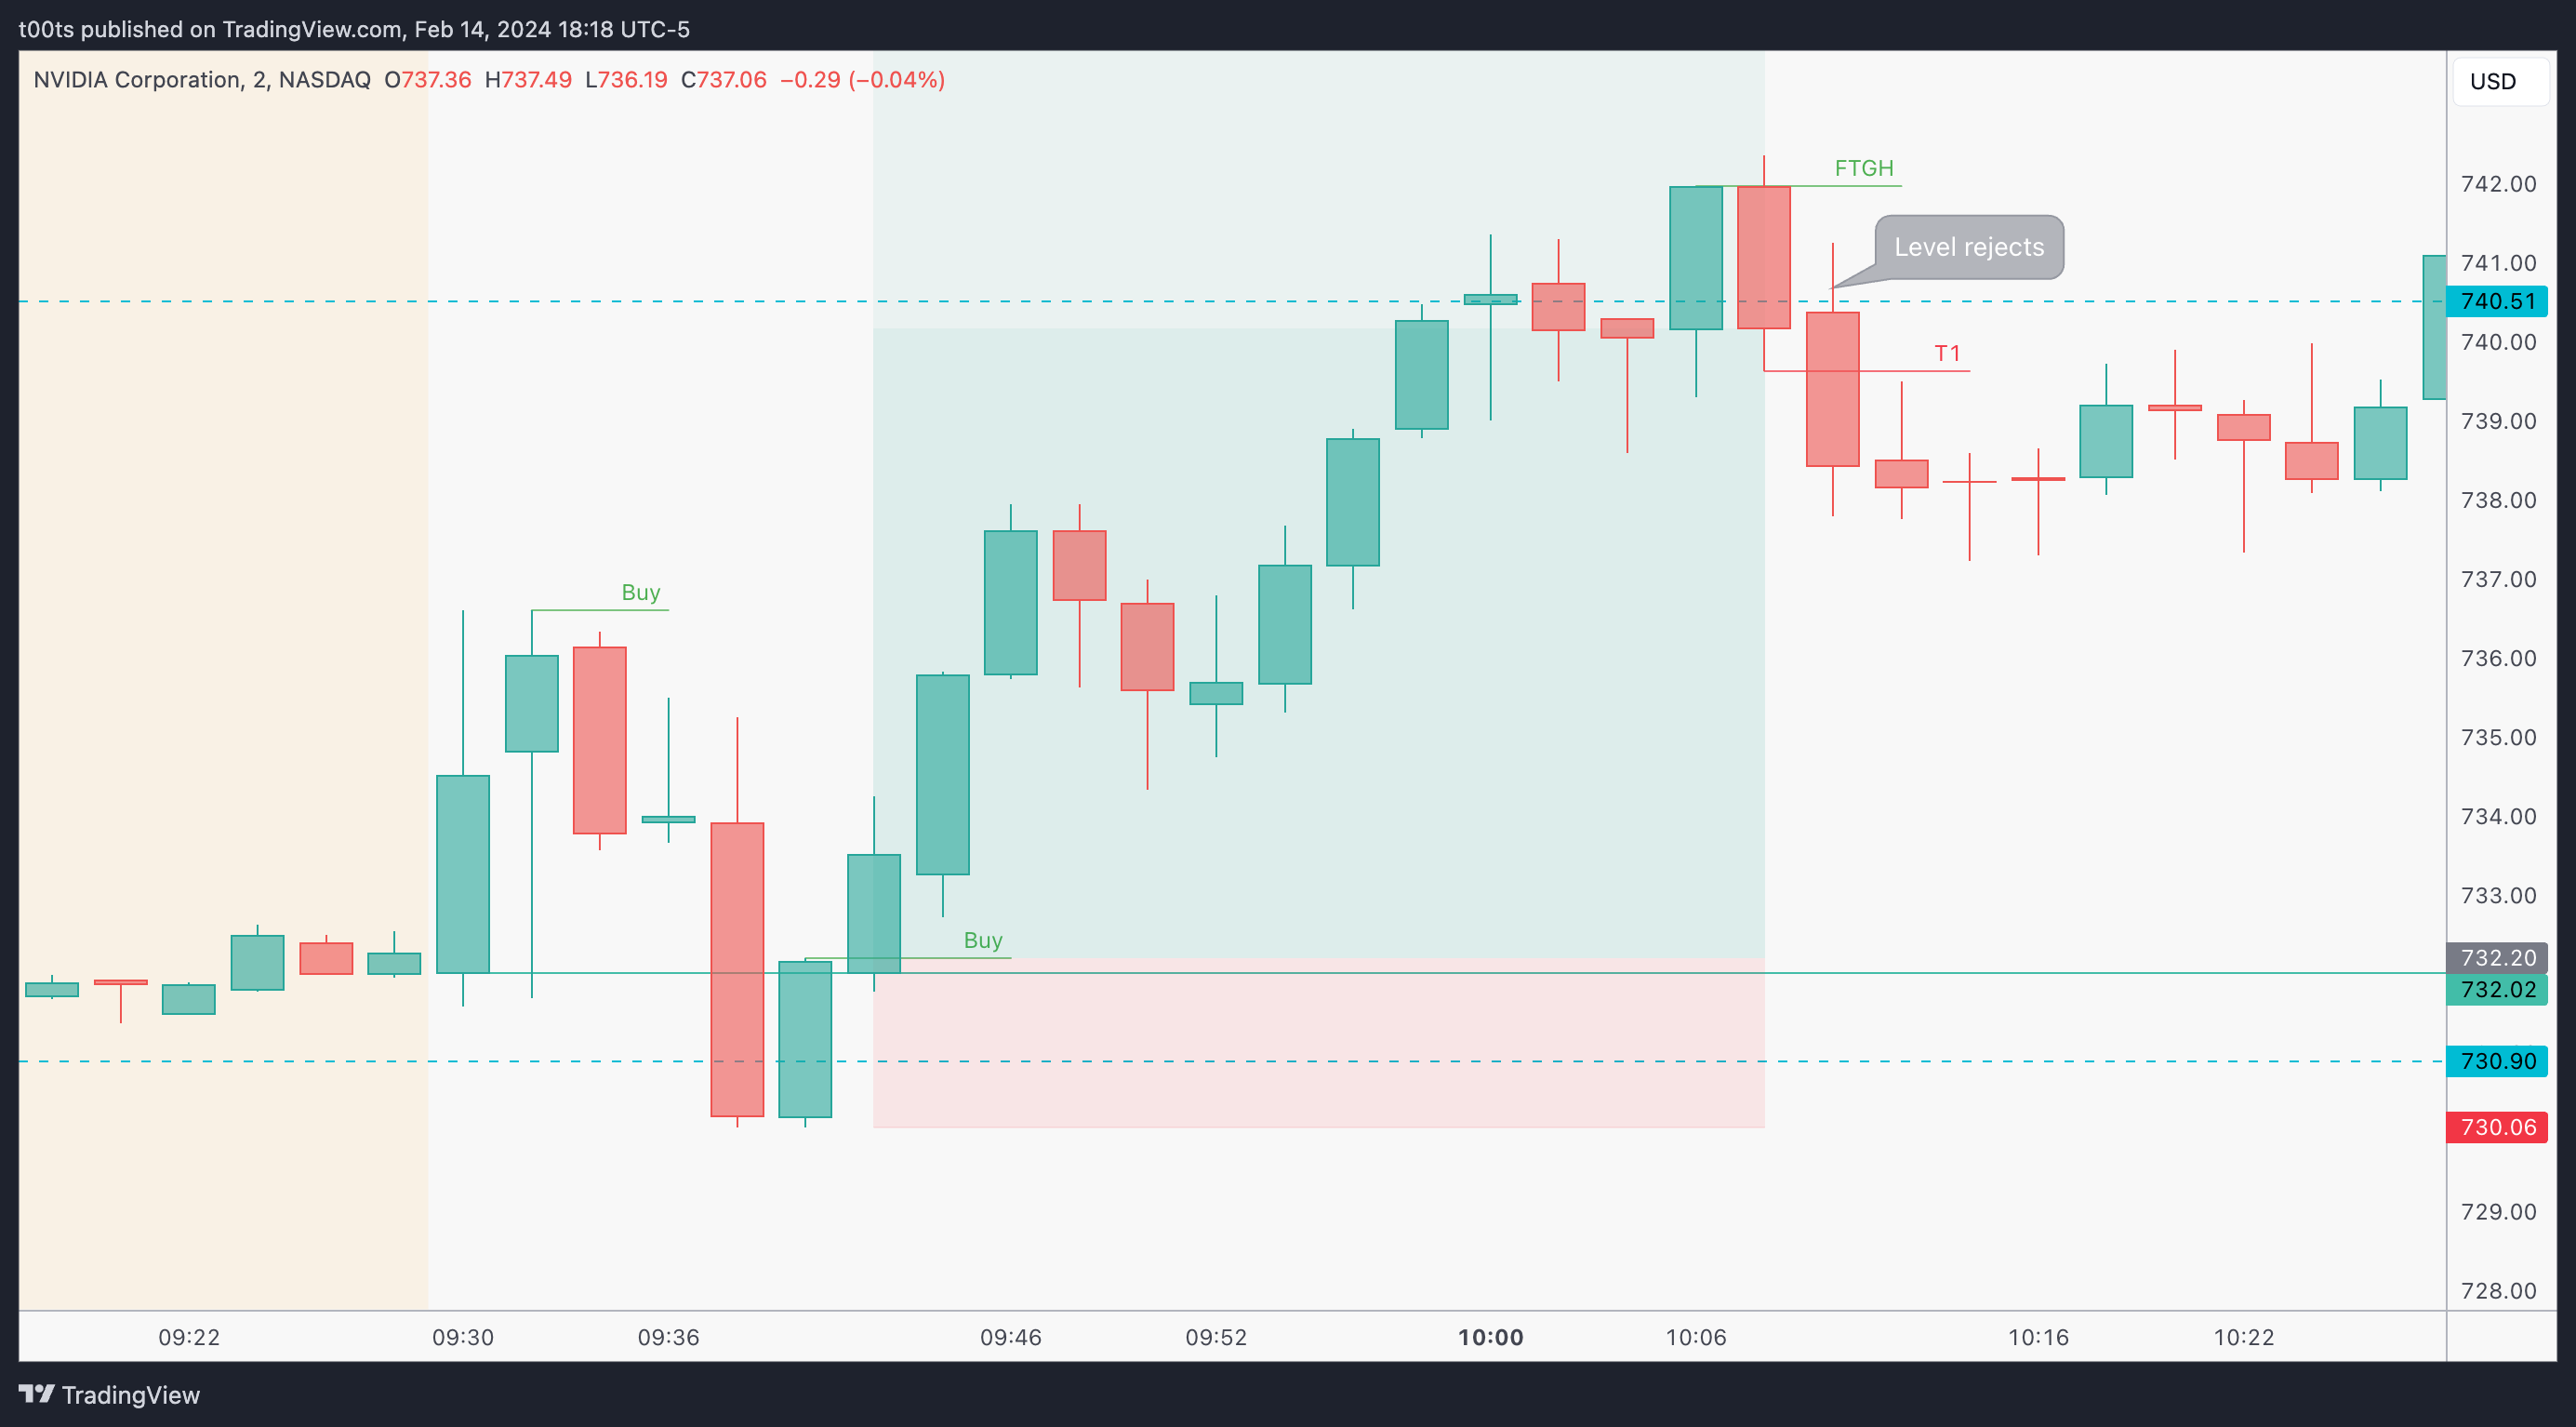
Look at that second 2m inside bar. I placed a buy on its highs because it's an inside bar that bounces strong off the opening print after sellers tried to take the stock below it. It never triggered, but I thought it was interesting.
Our first trade of the day comes as price comes back down to test the $730 area and bounces. We have our bounce off the $730.90 and quite conveniently the 2m bar that bounces closes right above the opening print, giving us further confidence to take the long risking the lows of the day, although you could easily tighten your stop even more as you observe price holding the opening print on that entry bar.
The trade works well and hits our first target before 10am. We now have the “clear long” we were discussing on the hourly chart above.
If you're trading with the trend, you should always try to hold part of your position in case the stock keeps trending. In this case, our stop point is marked with T1 and is the result of a failed breakout of the $740.51 level.
5m chart
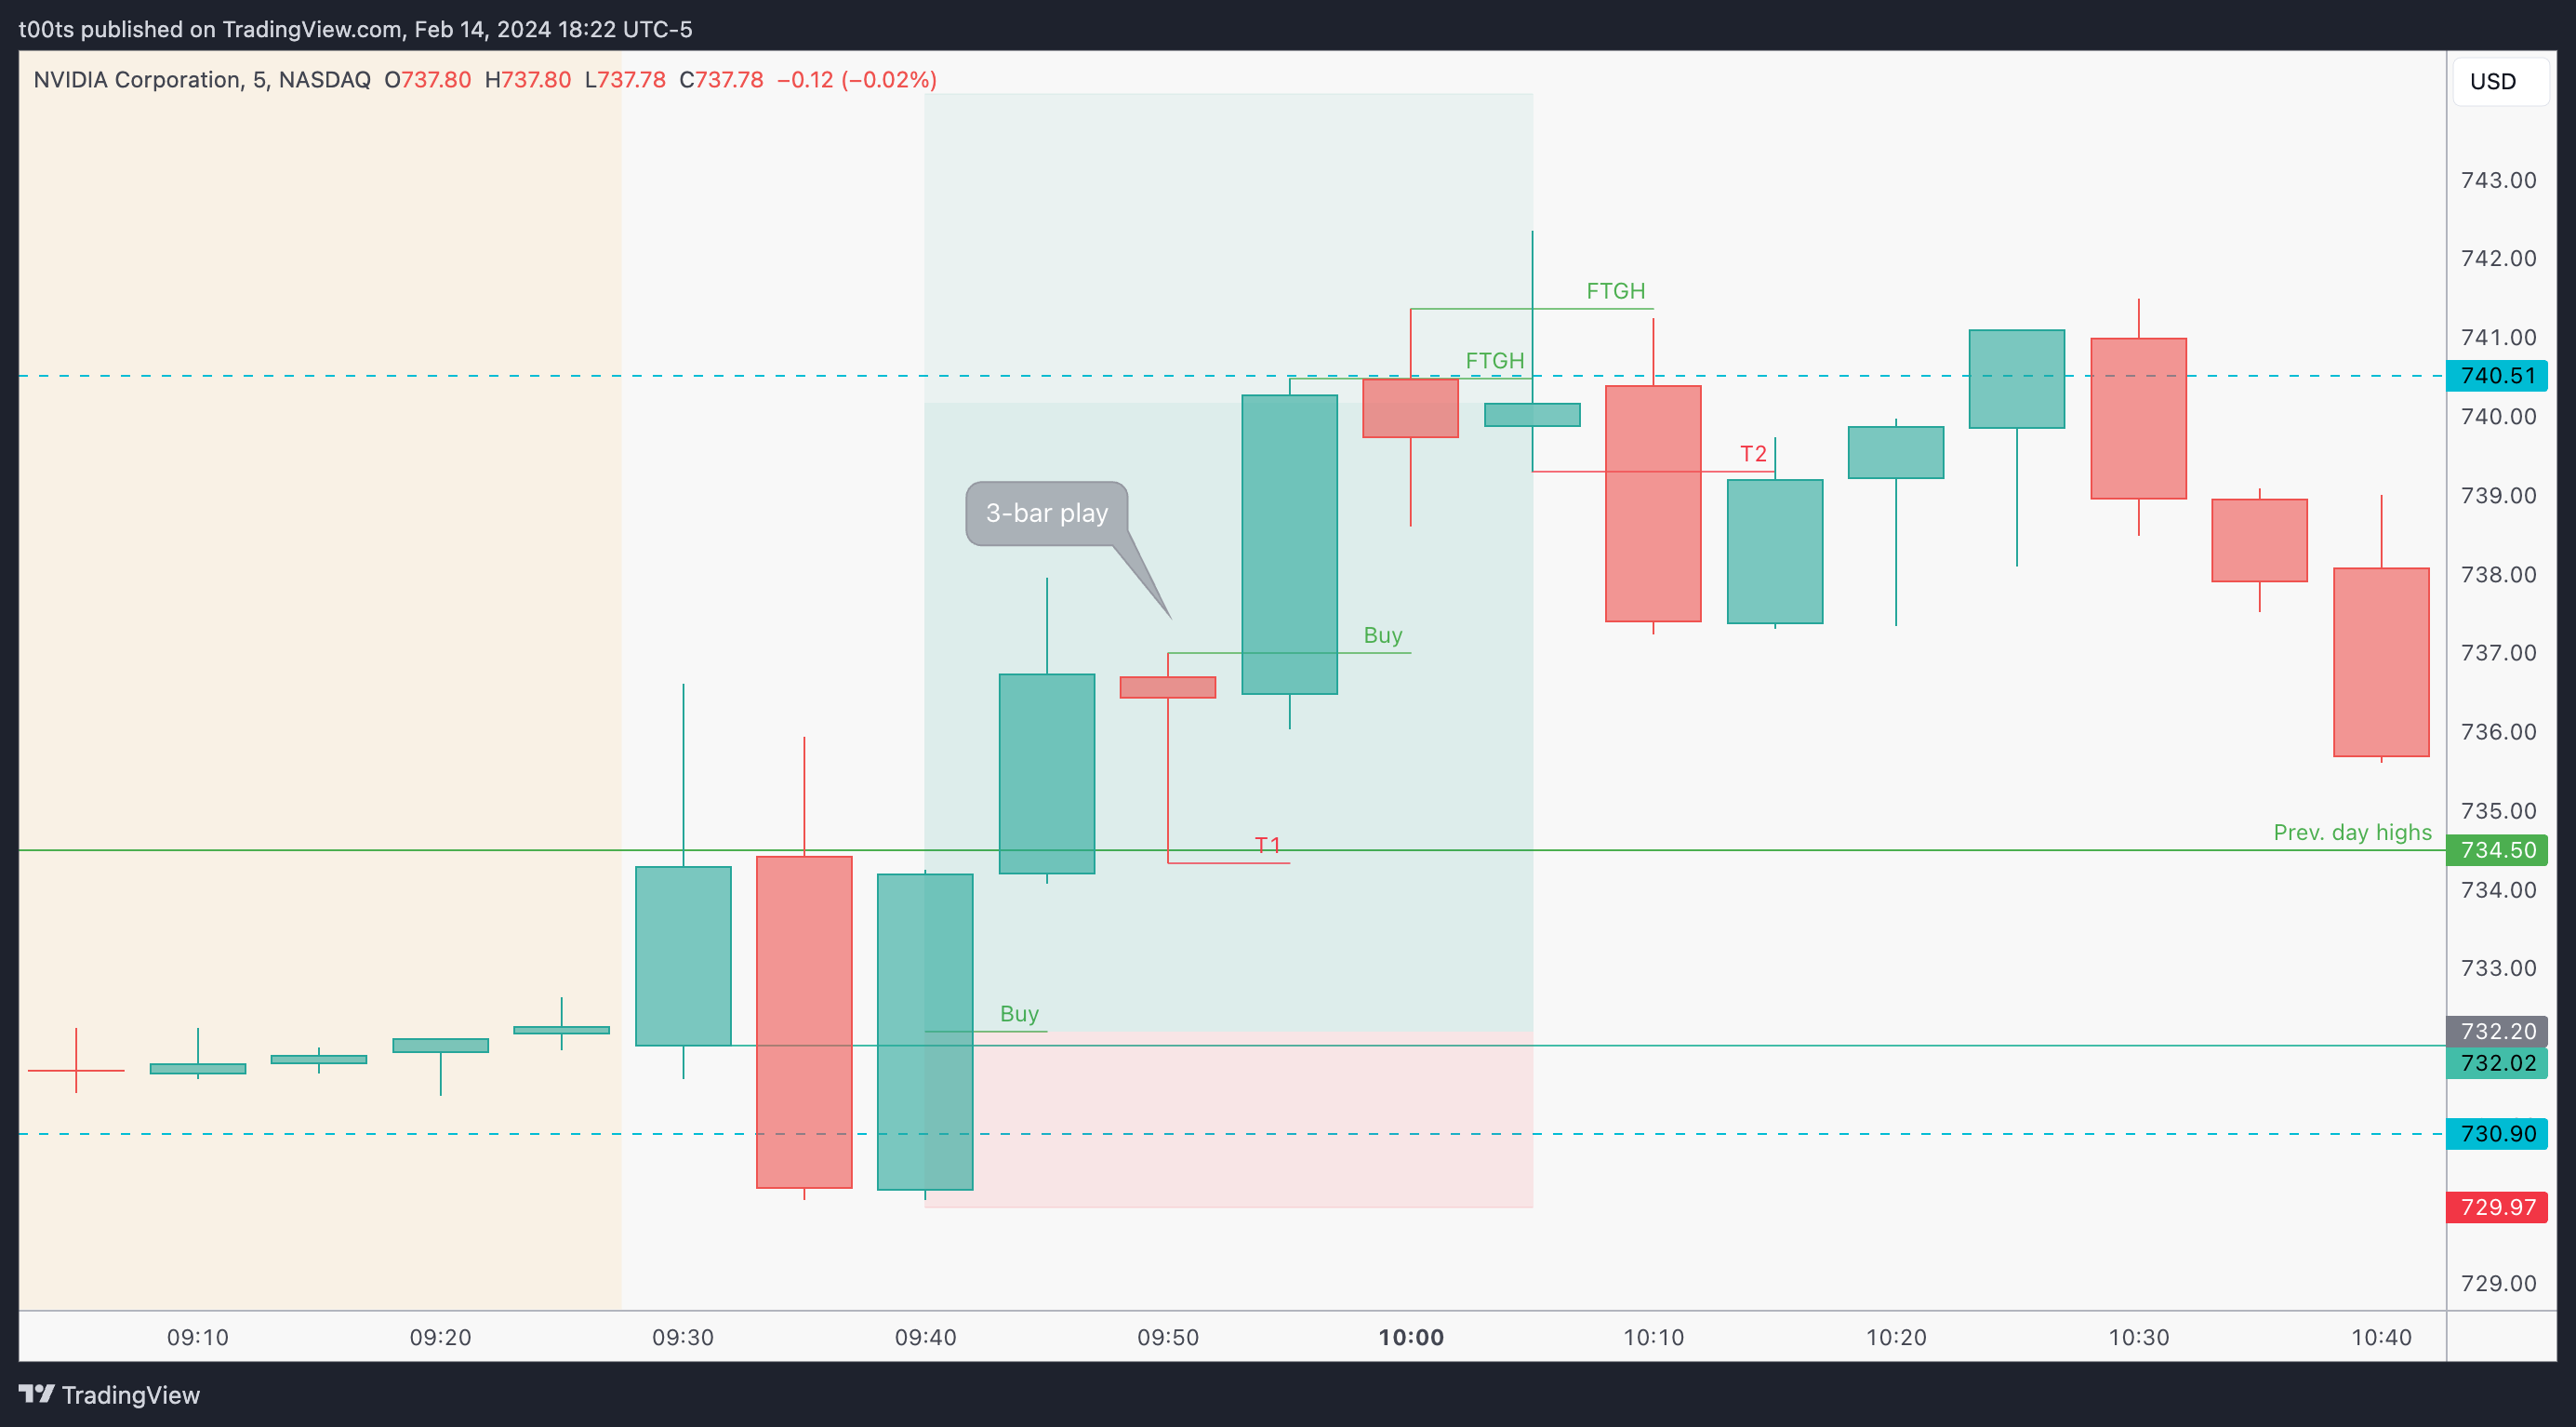
This 5 minute chart is quite consistent with what we saw on the 2m chart. What I mean by consistent is that once you had your entry, switching to this slightly higher timeframe would've resulted in similar real-time analysis and results.
We can see how price created a clean 3-bar play on its way up, allowing you to either add to your position or trail your stop to the rest bar lows, which had bounced at previous day highs.
We can also observe the two failures near our target level, which leads us to trail our exit stop, as we know that two failures usually lead to moves in the opposite direction.
Closing notes
Every time I review one of these trades it just reinforces the fact that I can't afford to miss them. If you're serious about trading you should definitely feel that burn. These straightforward setups happening near the open -where most of the trading activity for the session takes place- are must-haves in anyone's playbook and can kickstart your day more often than not.
I am posting one trade writeup every day throughout 2024. I focus on large caps using levels and price action. The subscription is absolutely free and will always be. I will strive to provide value by offering clues and ideas for you to enhance your edge. Let’s grow together!