
Meta Platforms (META) - Jan 5th 2024
Yet another example of how to profit off relative strength

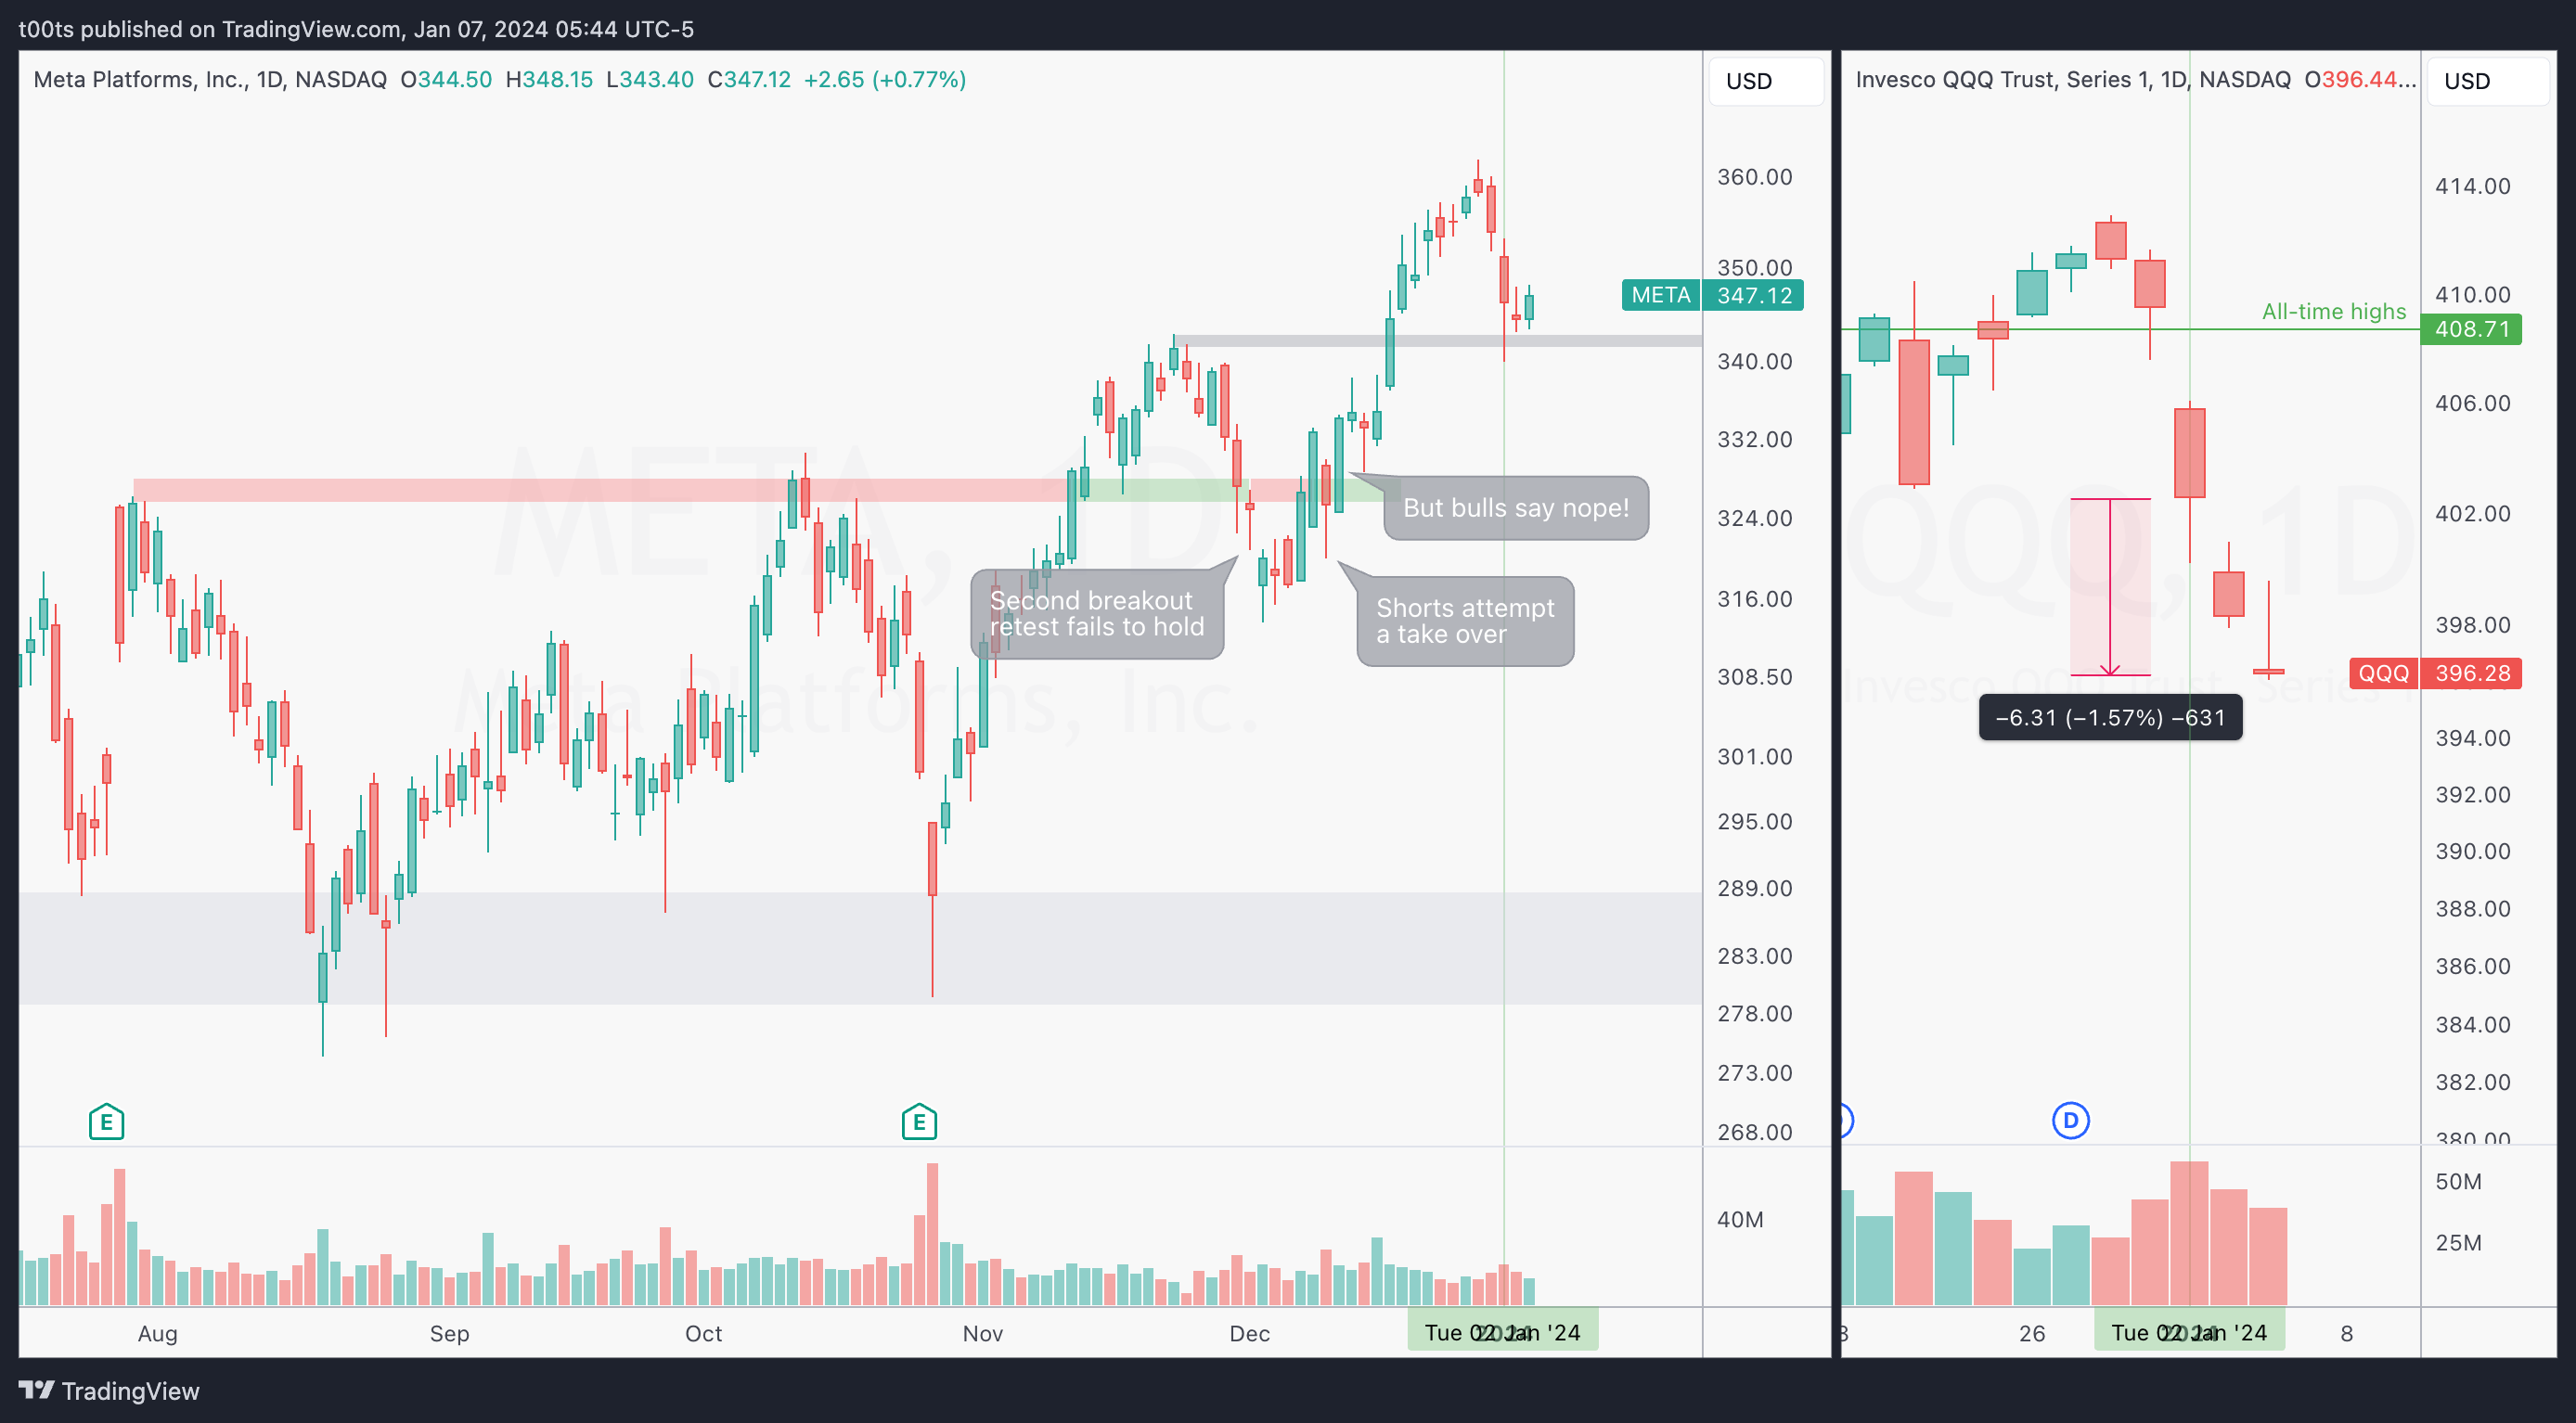
Higher timeframe context
We continue the theme of yesterday's post about NVDA with another example of how we can translate relative strength of an individual name into profits.
There's no question META has been on an absolute tear for the past 12 months, up around 300% since the 2022 lows. In the daily chart (left) we can appreciate how every dip gets quickly bought up. Every time shorts get a taste of success, buyers quickly pick up bringing price to new highs. In fact, this last rally was fuelled by a failed failure. The support/resistance flip fails to hold, resulting in a failed breakout. But very quickly, longs take over yet again, and the failed breakout itself fails, leading to the end of year rally. Failed failures are super high probability patterns.
Again, just like we did with NVDA, it's worth having a QQQ daily chart (right) showing recent price action. It's very obvious that META is relatively stronger than tech overall. While the Nasdaq is down over 1.5% in the past couple days, META is actually slightly green. Just visually compare the last two daily bars of each chart. Anyone should be able to visually tell the difference. We can add the Support/Resistance flip to the mix, marked in grey, which gives us further confluence for our trade idea.
Daily chart
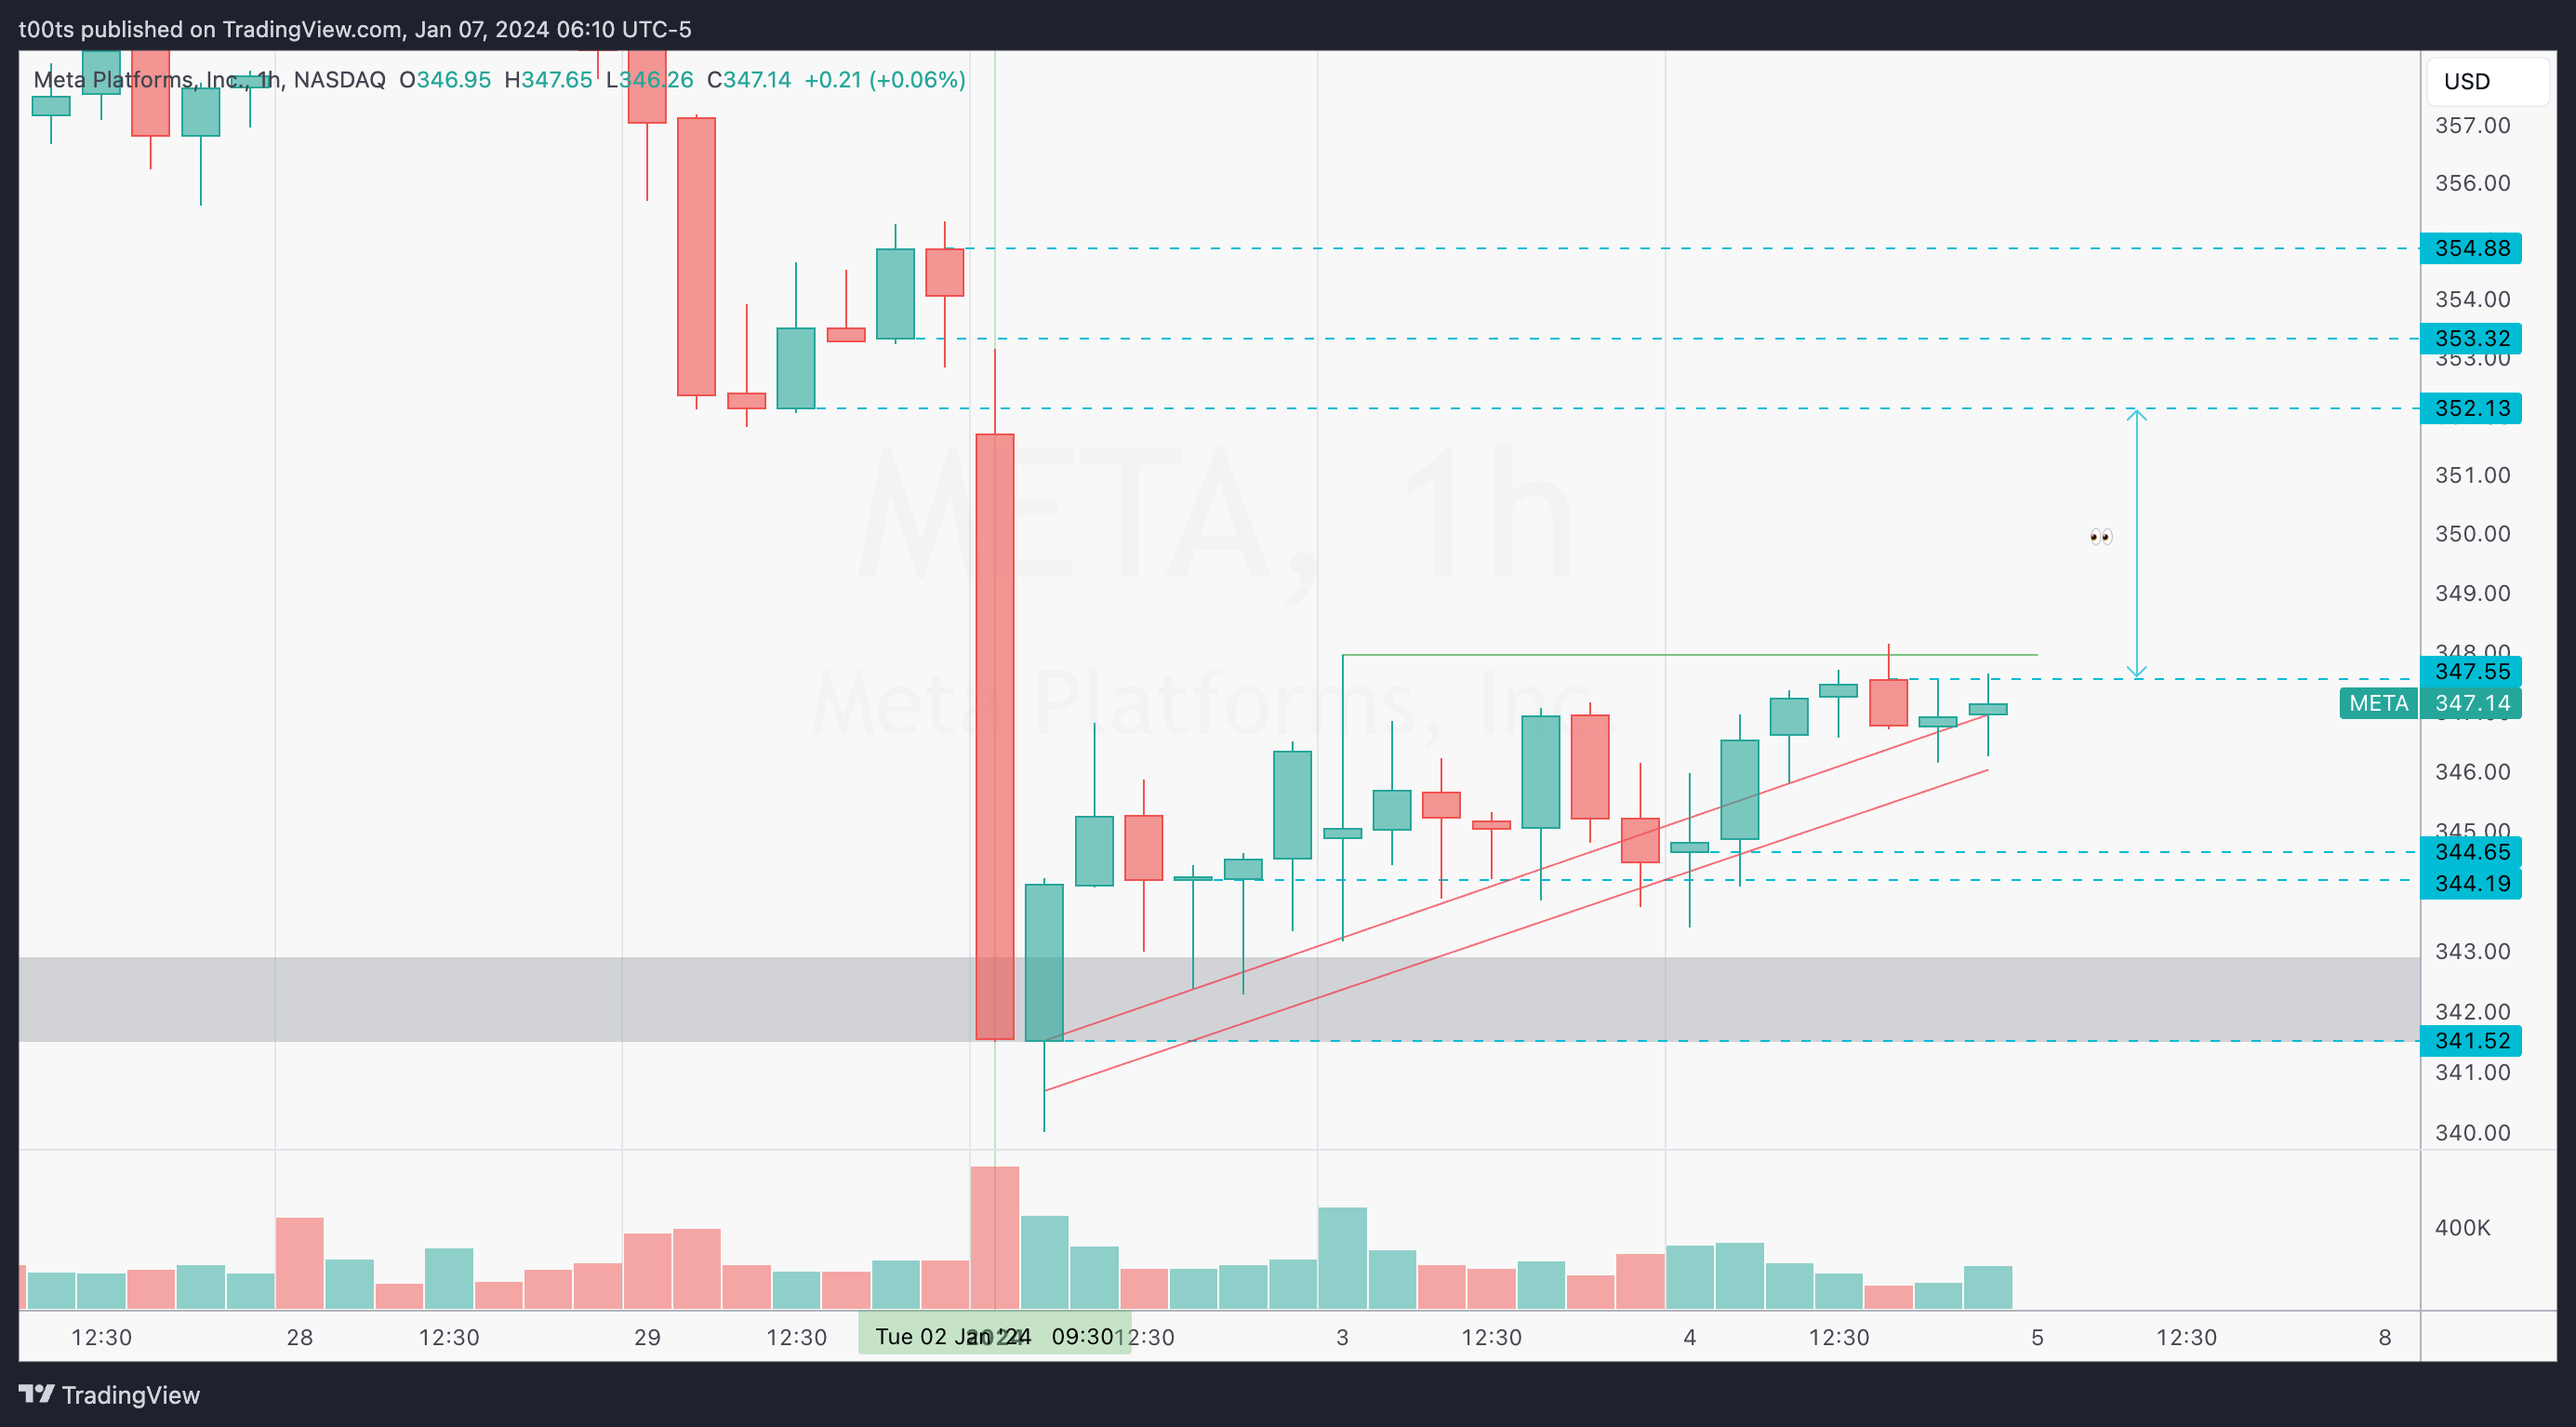
Hourly chart
In my opinion, the first thing one sees in the hourly chart is a bear flag forming. We started the year with a strong move down, followed by a period of consolidation.
Question is: Why didn't this bear flag break down if the market was so weak? What do all these lower wicks mean?
Leaving our biases aside, the reality is that every push down is getting bought up. During this consolidation, 18/19 bars have bottom wicks, in what could be conservatively classified as a mild uptrend. Again, 95% of the hourly bars during this apparent bear flag have clear signs of buyers scooping shares. Add that to our overall daily context we discussed and we're starting to see a theme here...
In terms of levels, just like we saw on NVDA, there's plenty of room to the upside, leaving shorts in a tough position if price does trend above the $347.55 level, which would be our key watch to consider any upside on this name.
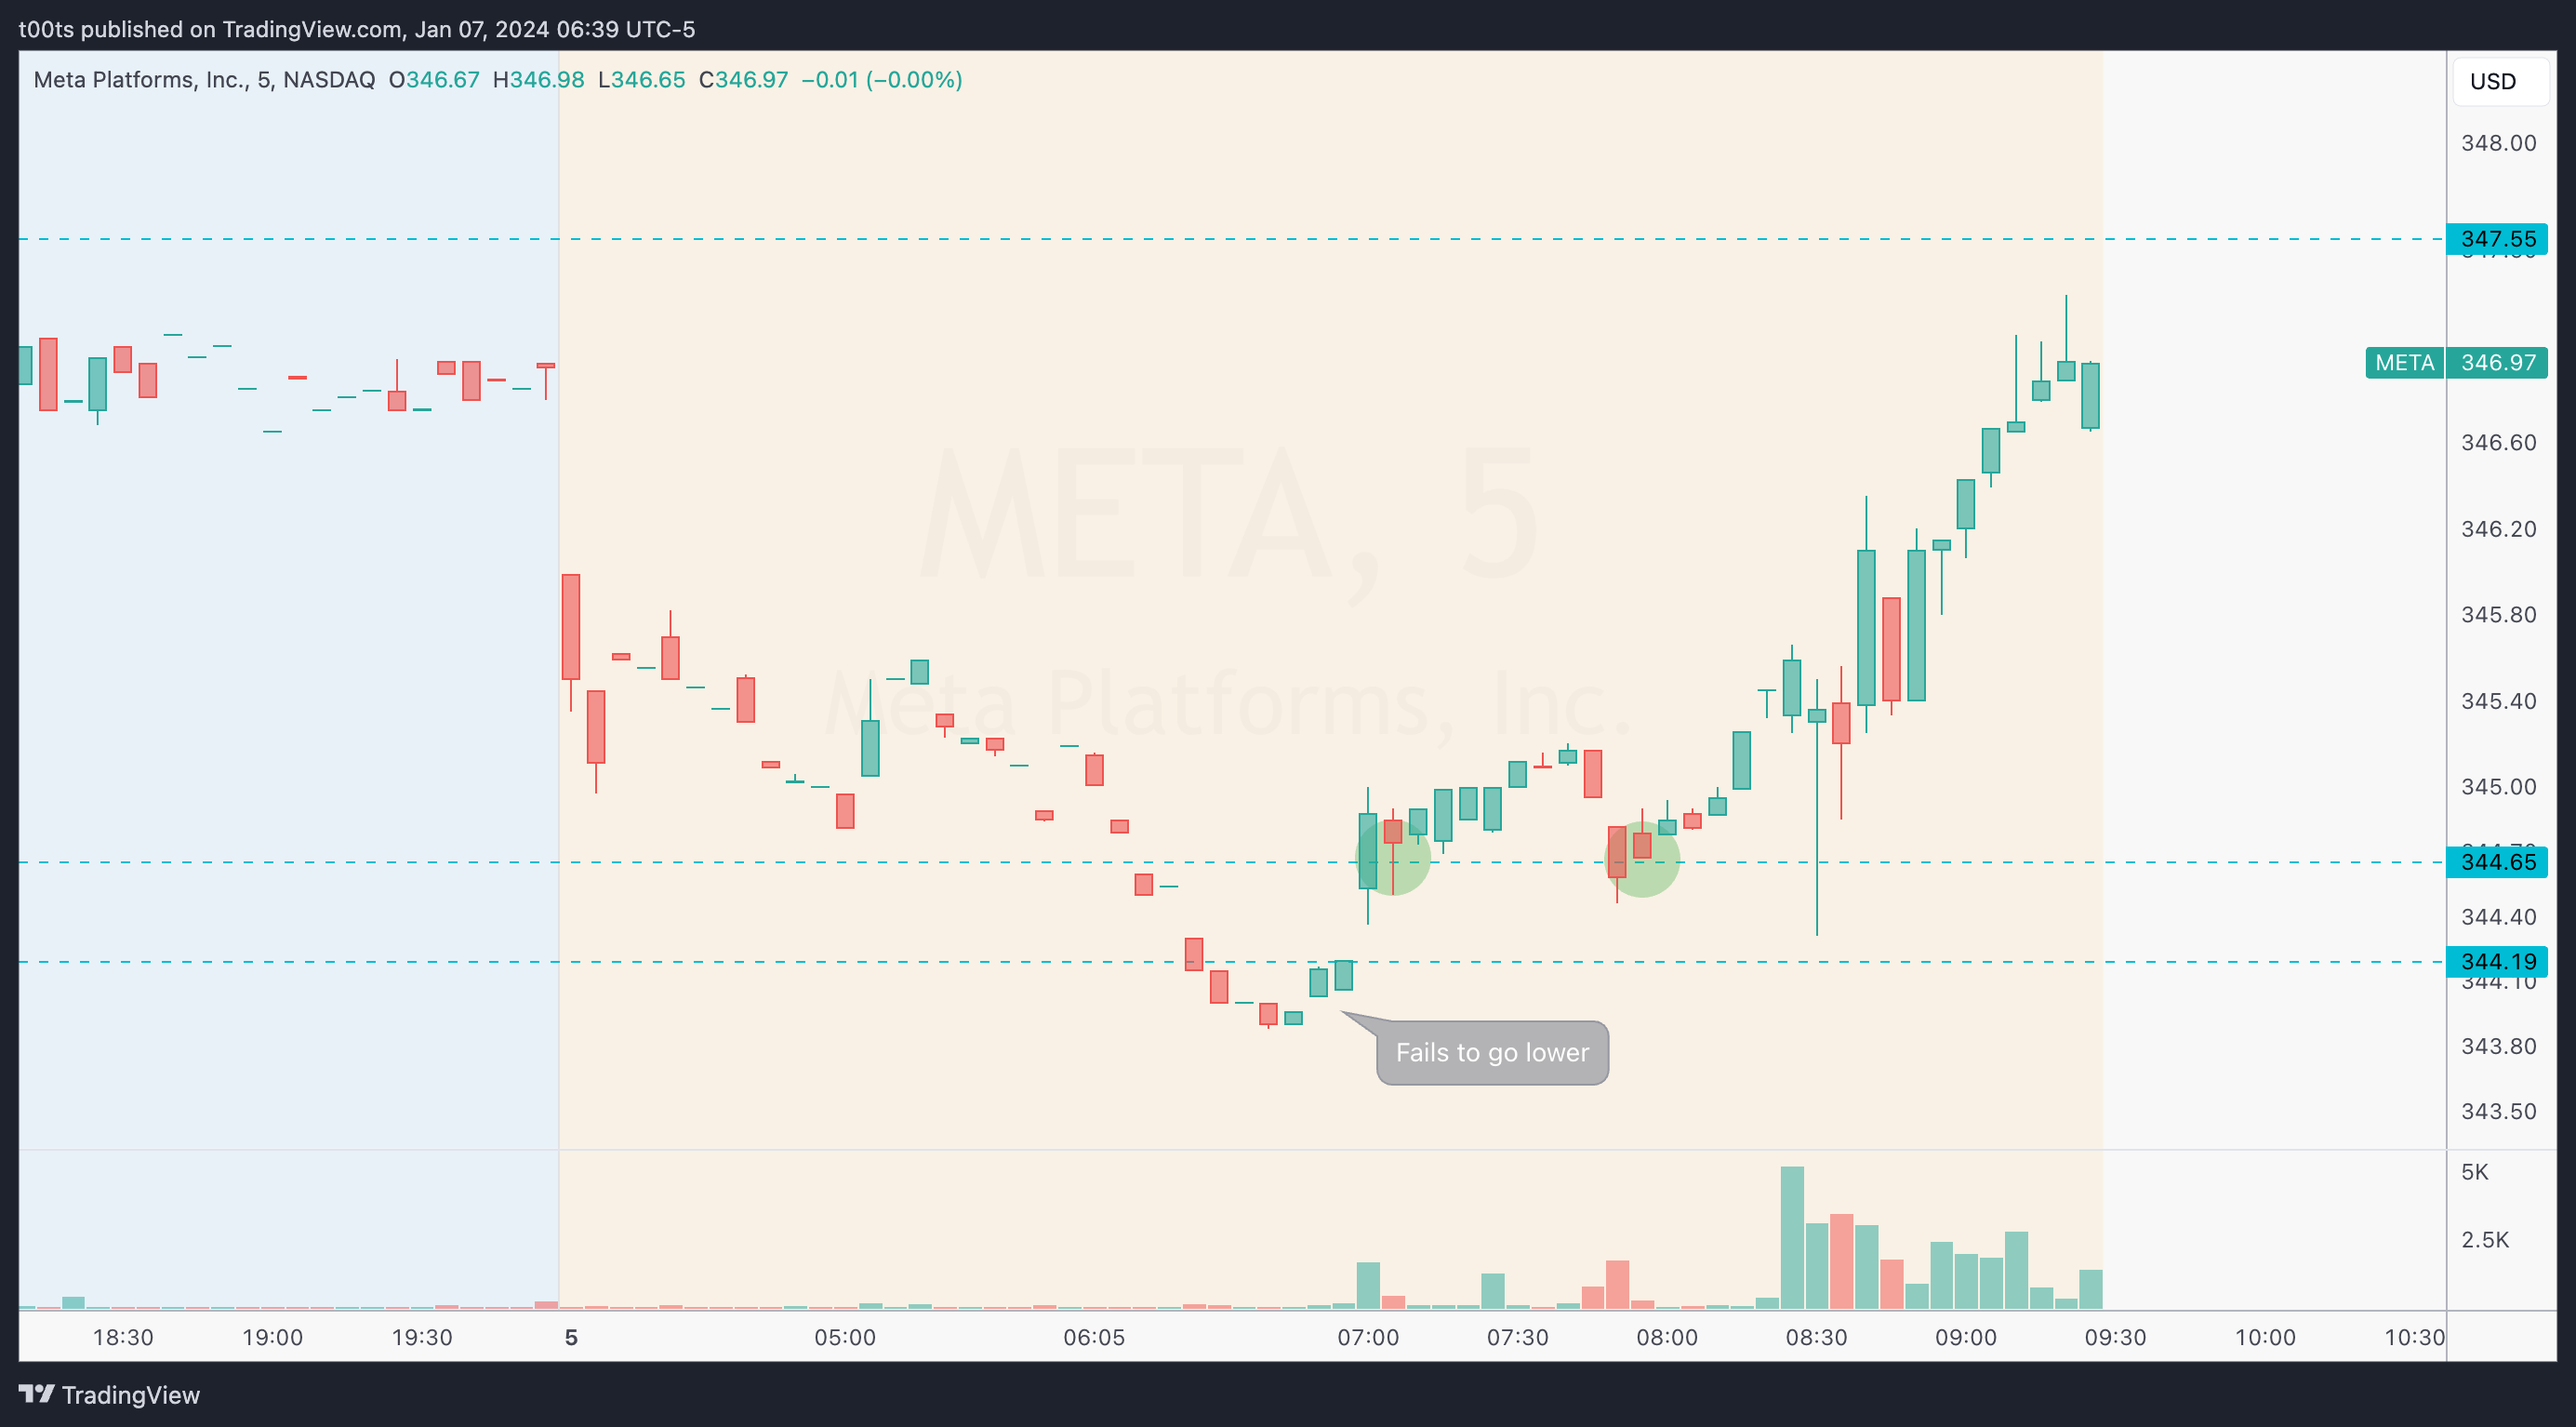
Pre-market action
On a day where most stocks are down in their pre-market trading, META is set to open pretty much flat. We notice a steady uptrend coming into the open after a bit of selling in the early hours of pre-market action. Not surprisingly, price turns at the levels we had marked and is now set to open near the $347.55 level which we just discussed.
Quick question: Look back at the hourly chart above. If you were short this stock, where would your stop be? Keep that in mind.
The trade
Let’s use our CPT Framework:
Cue(s)
Relative strength vs. the overall market in last two sessions
Strong uptrend during the pre-market, denoting further relative strength
Stock set to open very close to our long threshold level of $347.55
Intraday cue: Failure to go lower after shorts try to defend their positions
Plan
This is an opening drive play, so I'll be focusing on a smaller timeframe to get the idea across. Right off the open, buyers manage to close a 2m bar above our level, but fail to hold it. Sellers immediately come in and take us down, below the opening print and into a new daily low. At this point, a short is on the table and, in my opinion, not a bad idea at all given the bear flag possibility we were discussing earlier. We should be ready to short one tick below that bearish 2m trend bar. Yet, price never trades there. Bulls immediately take over and bring price back up above our $347.55 level, closing above the highs of the bear trend bar, leaving sellers trapped.
Trigger
Price breaking above the bull failure trend bar.
2m chart
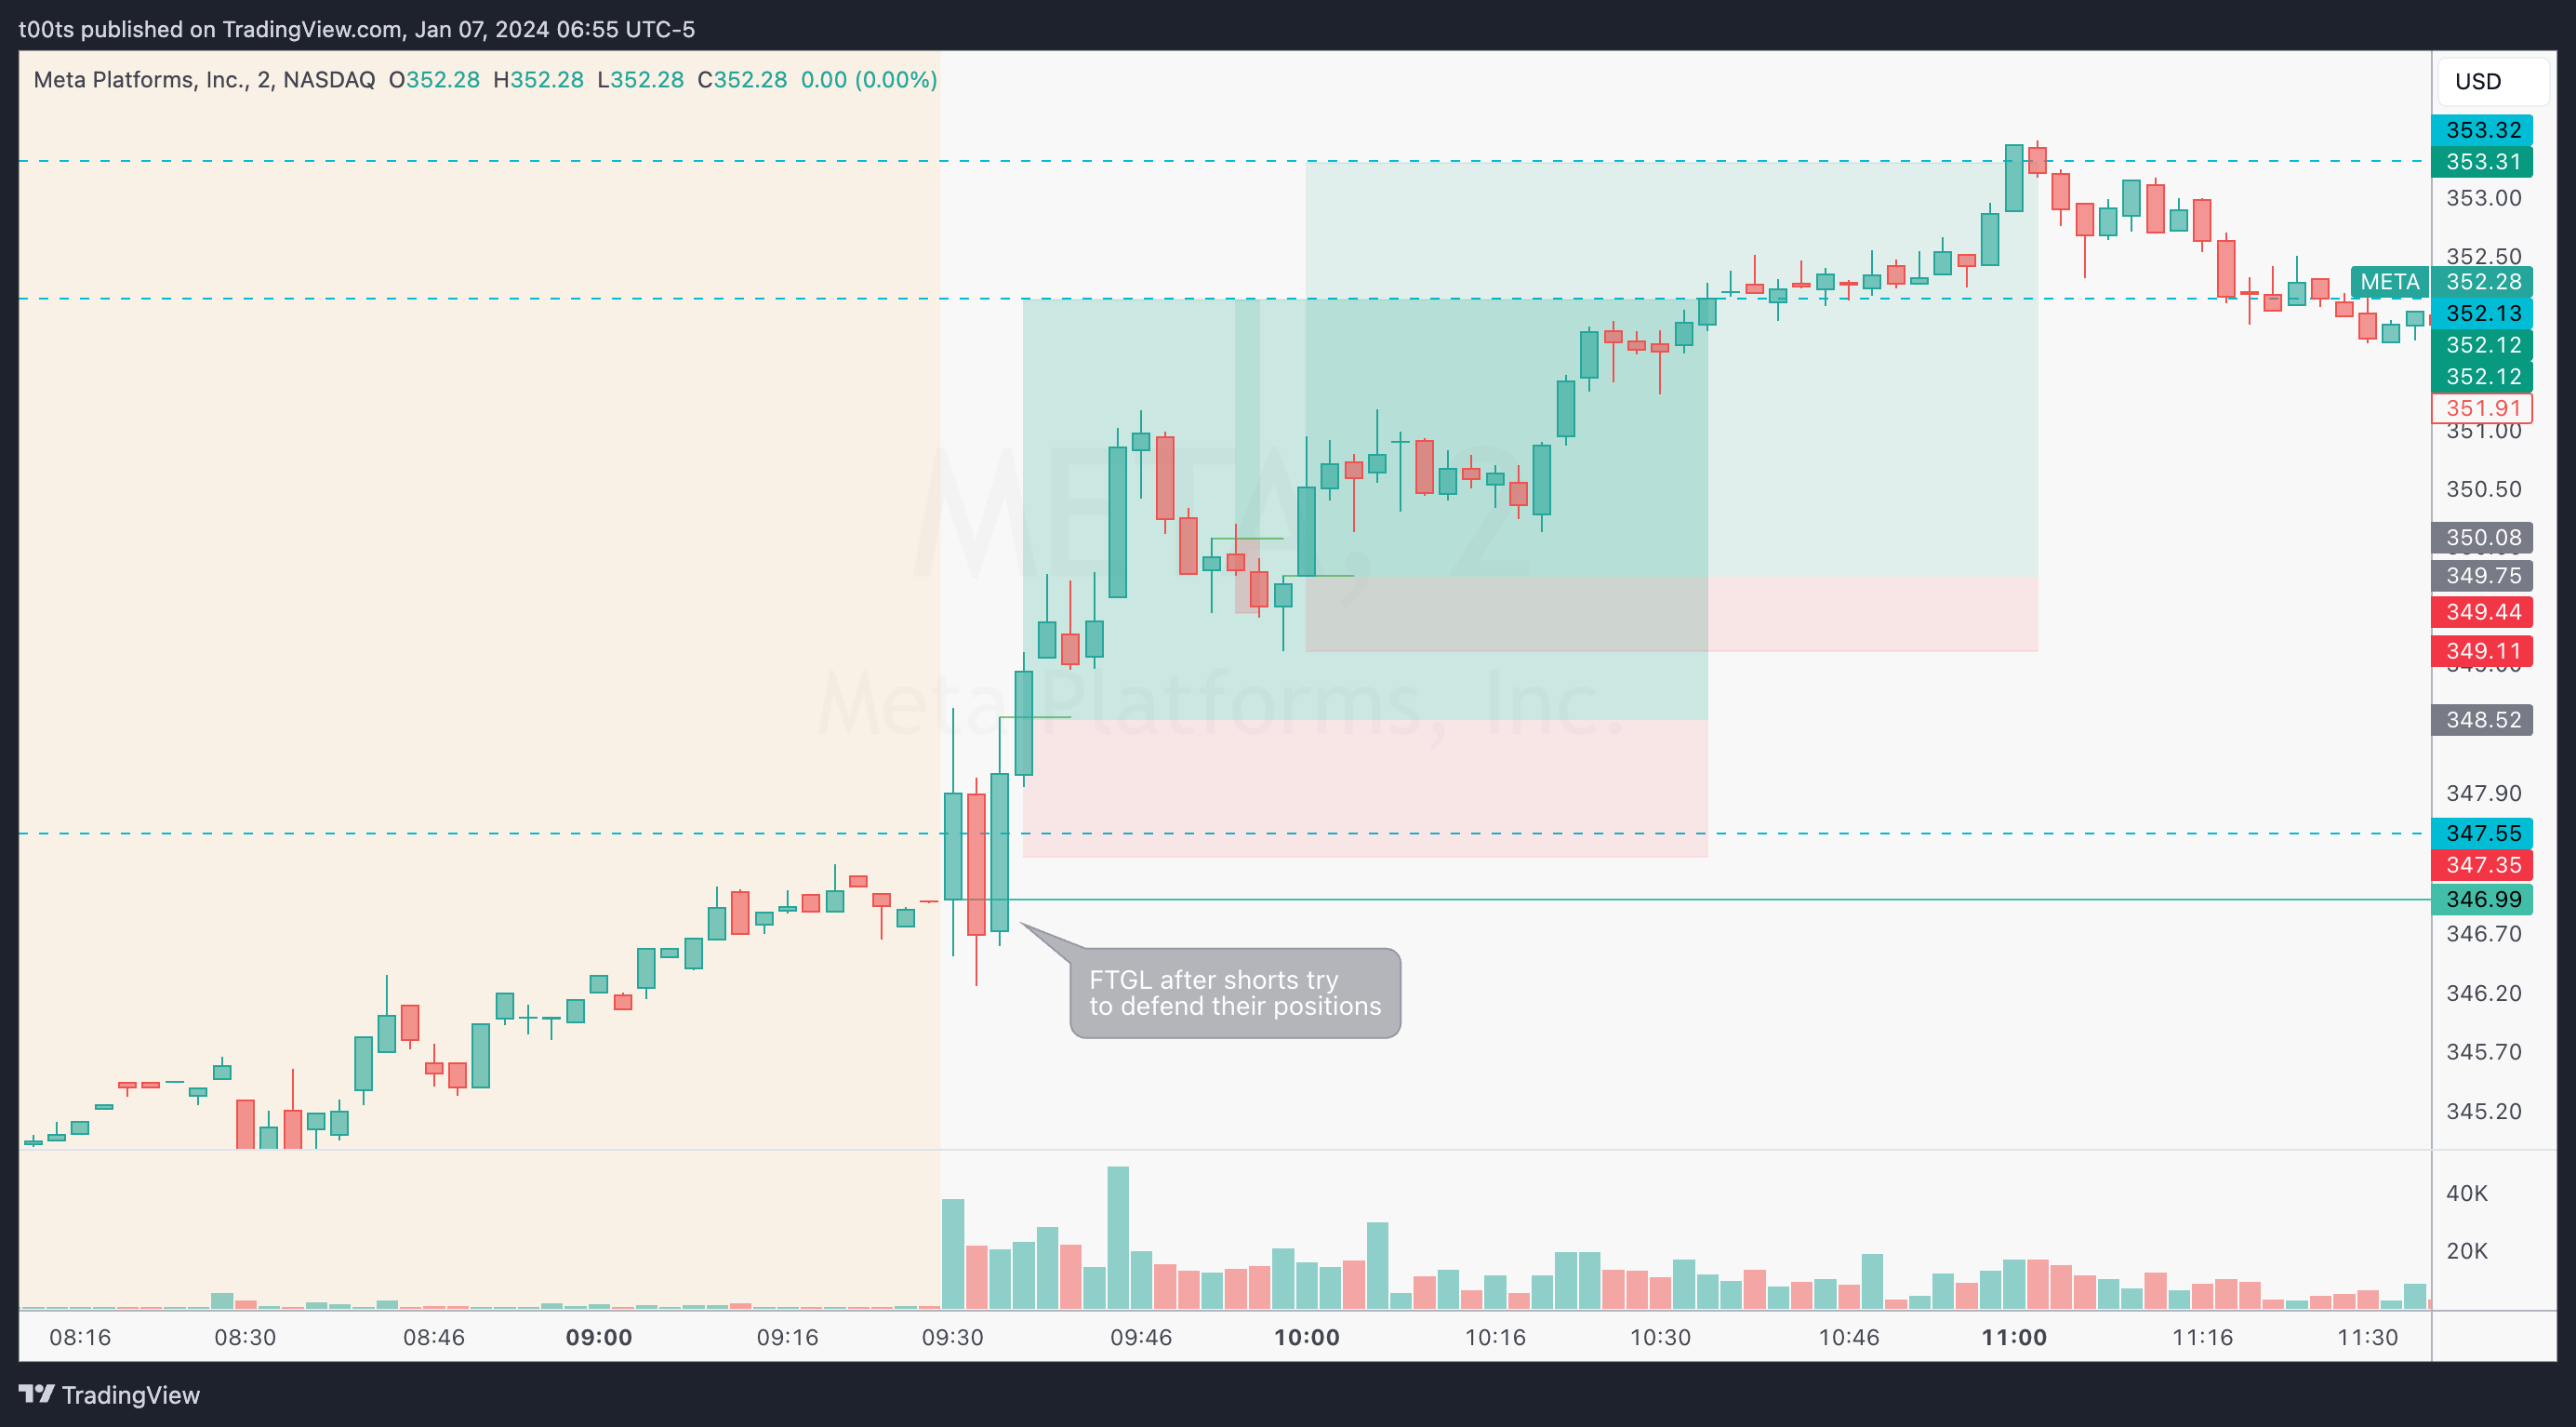
Everything happens quickly, but there are a few entries without the need to anticipate anything.
Our first entry happens the moment price breaks the highs of the bull trend bar that reverses the short attempt at the level. This trade offers around 3R, given we're risking against our level and we're not particularly close now. Of course, if you'd jumped in right when price breached the level to the upside you'd have a better entry, but we try to keep things systematic here and avoid look-forward bias in our analyses.
The 2m chart offers two more entries (marked with a “1” and a “2” respectively). These can be used to add to a core position, or to get involved if you missed the first entry, which is totally fine.
The first one is a pure momentum entry, after a single legged pullback. It fails, as they often do, leading to the second leg of the pullback which is really the one we should put our focus on in general. The second signal bar has a bullish close after a failure to go lower below the first low of the now two-legged pullback. I love these trades. Given the established trend, this would be A+ for me, especially on a higher timeframe.
Closing notes
Unless you really like trading META, your attention was probably on NVDA this day. Regardless, I believe this review reinforces the importance of macro context and understanding the relative strength of a name vs. the indices. It also gives us an insight into the virtue of patience and not rushing into anything despite our bias. As discussed, price could've triggered the short trade. But again, if all our cues lead us to the long scenario, you might want to skip that one. It's really up to you.
I am posting one trade writeup every day throughout 2024. I focus on large caps using levels and price action. The subscription is absolutely free and will always be. I will strive to provide value by offering clues and ideas for you to enhance your edge. Let’s grow together!
🙌🏼