
Meta Platforms (META) - Feb 22nd 2024
Using a stock's relative strength during a market pullback to our advantage

Bigger picture context
META had their earnings recently and the stock took off into new all-time highs after an already historical comeback. If you missed that previous entry where we went over their earnings, make sure to give it a quick read as it’s one of the most popular posts to date and will get you into context.
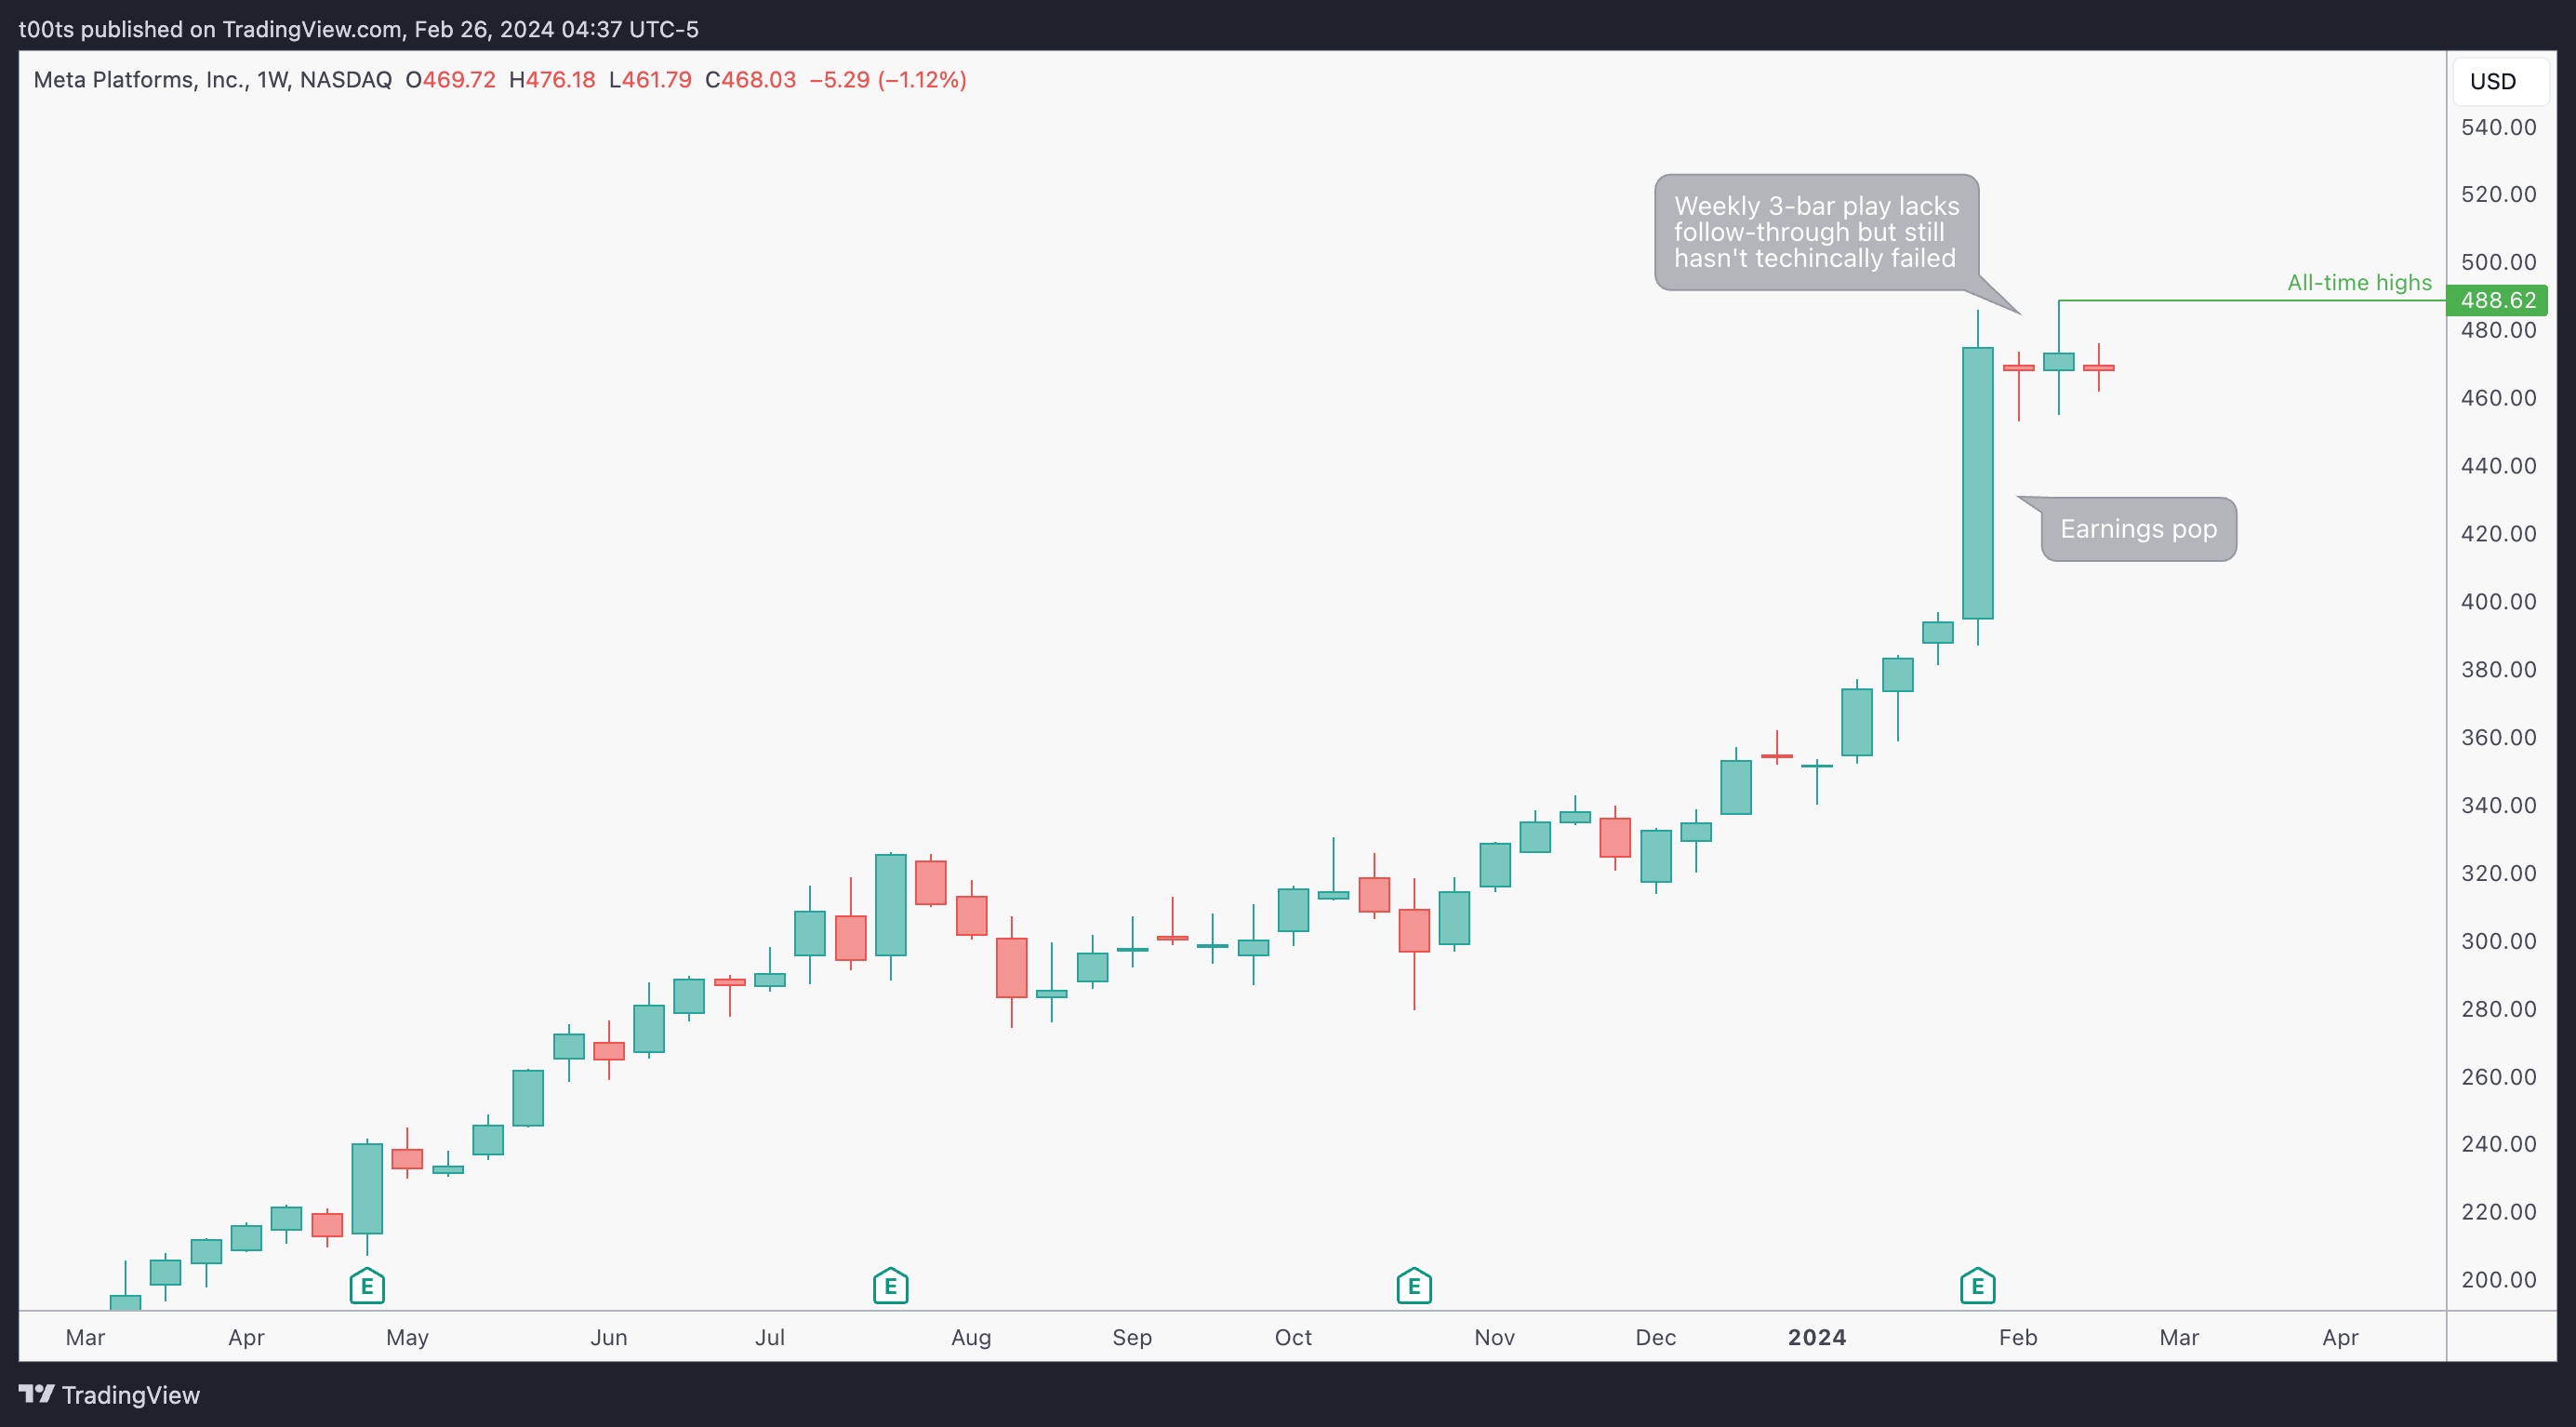
Weekly chart
After the earnings pop into new all-time highs, stock has been consolidating with no apparent signs of any short-term pullback happening anytime soon.
There's a 3-bar play that doesn't get follow-through, but it also doesn't fail as price is still holding on the following week and hasn't traded below that prev. bar lows.
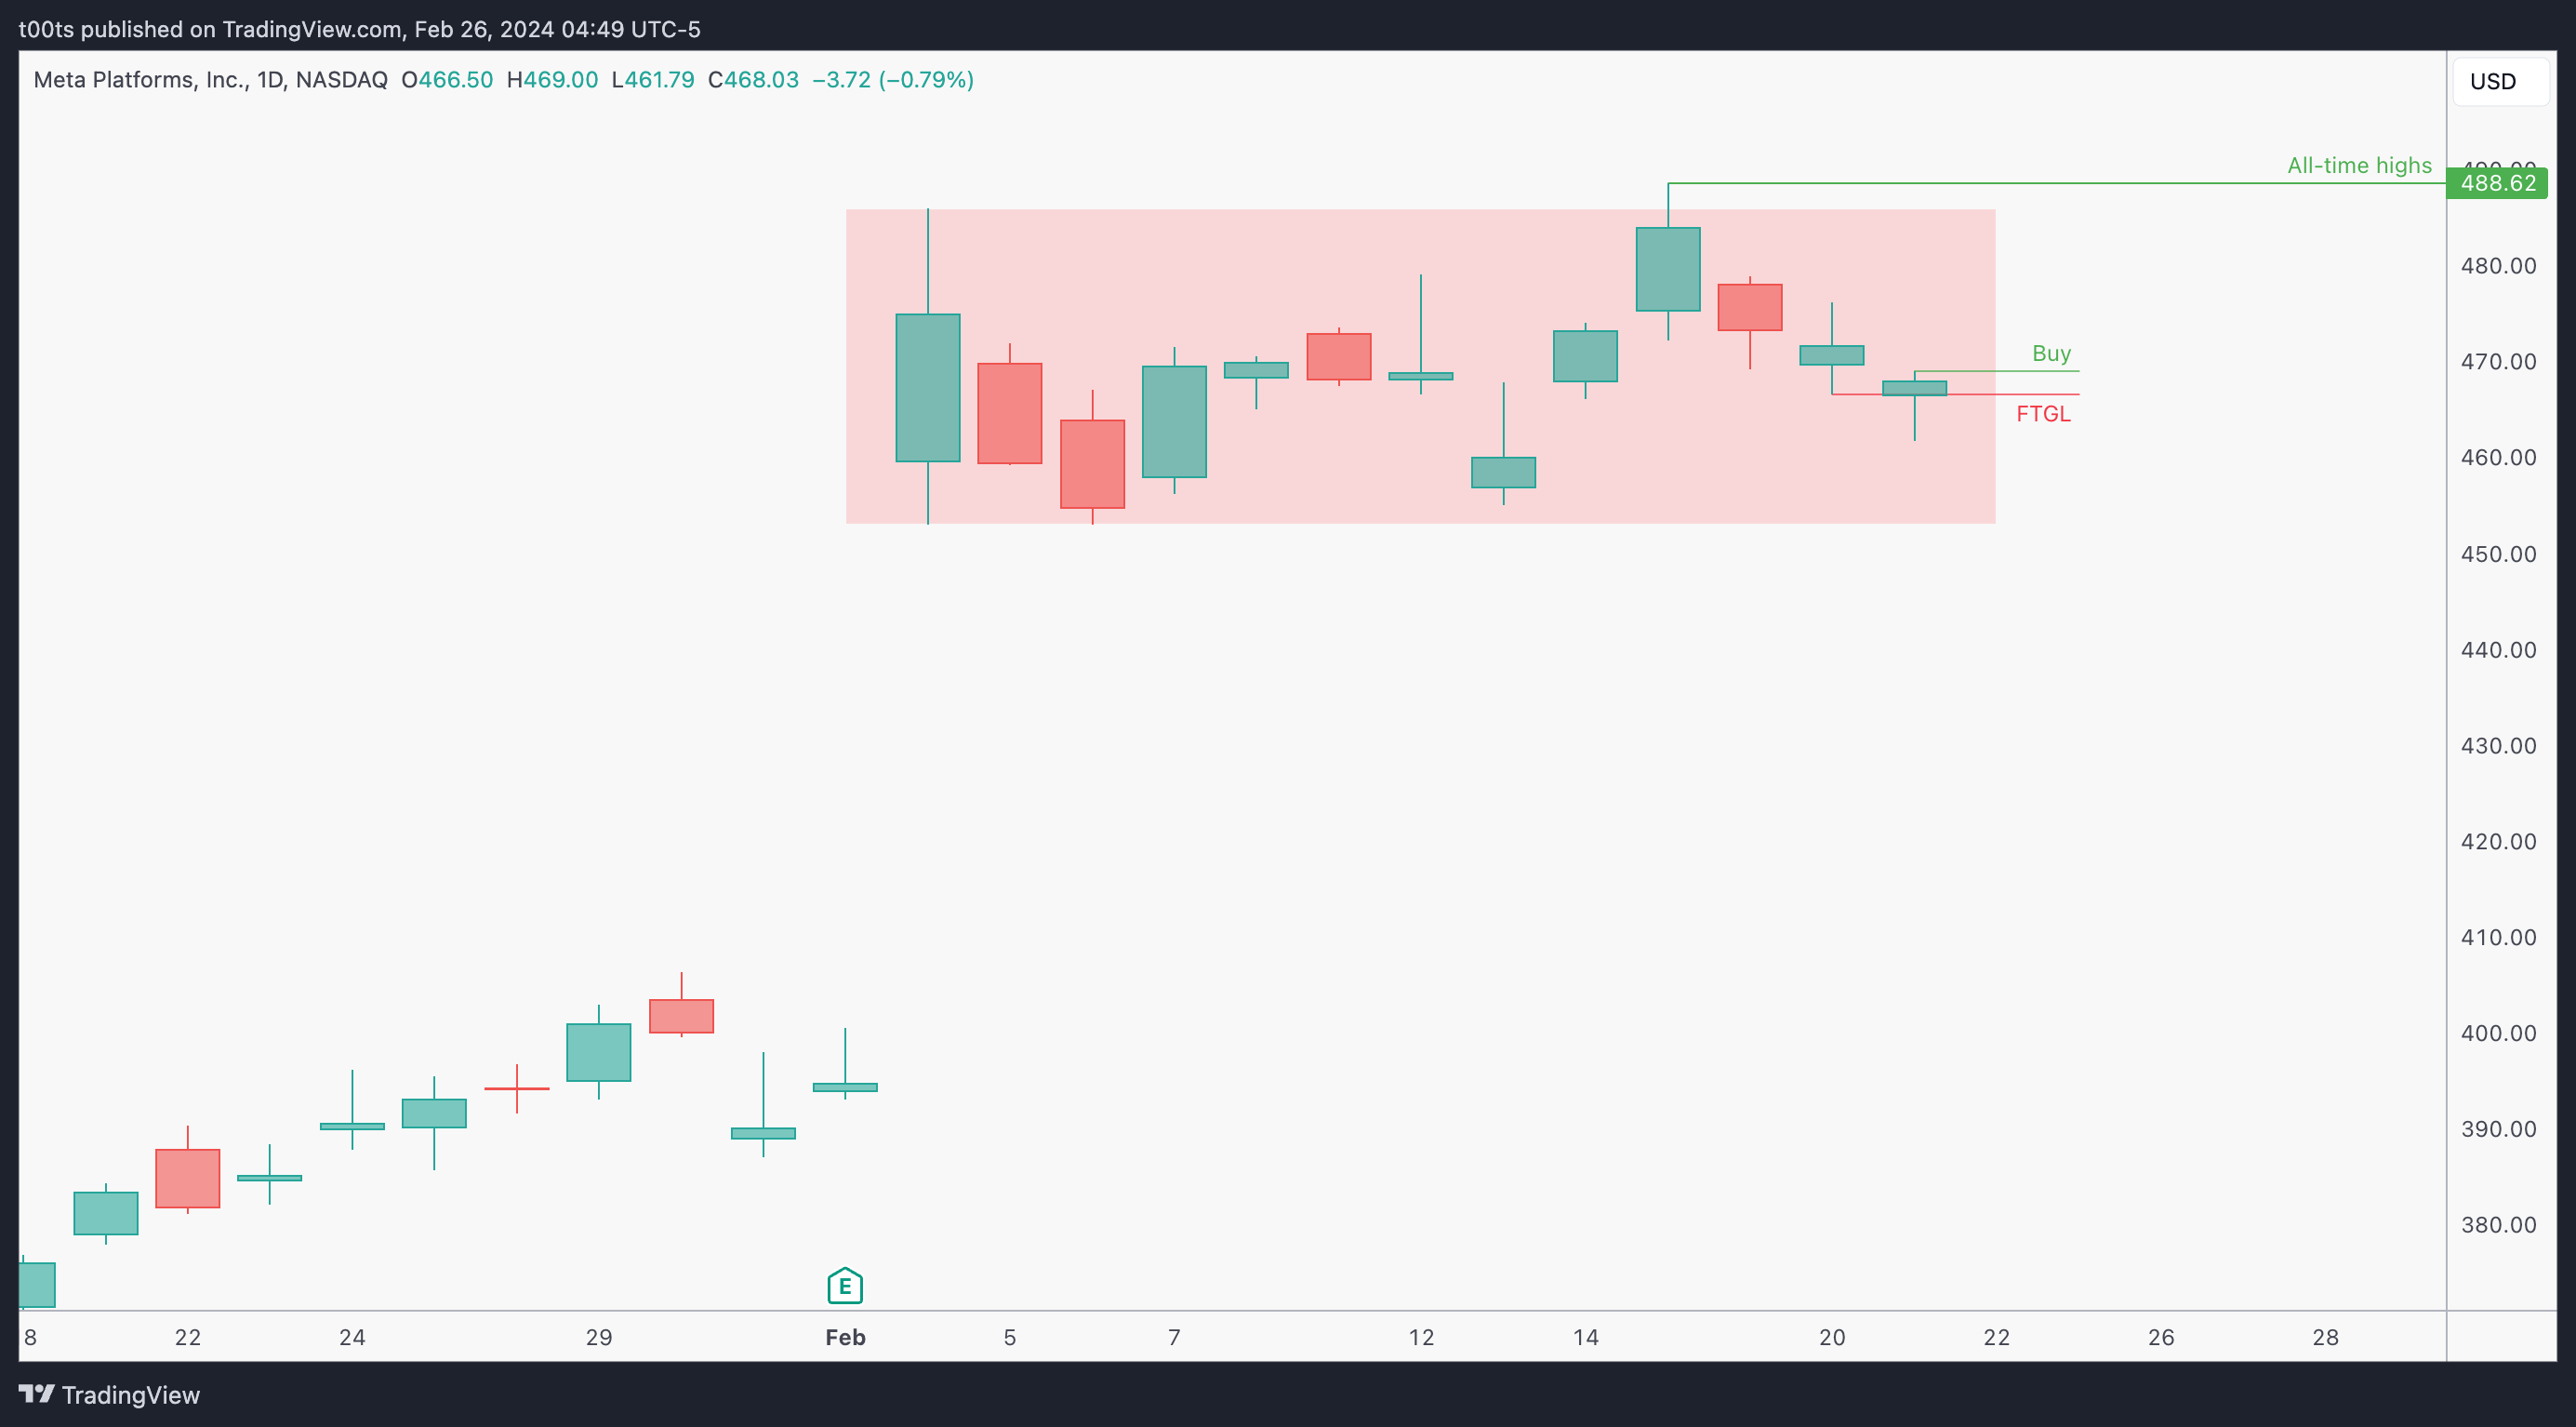
Daily chart
Price has ben ranging, just as the rest of the market on these few weeks. However, I feel its worth highlighting how after making a new all-time high, price has been pulling back setting up potential buy setups consistently, especially on this last day where we also get a clear failure to go lower with a green close.
These were days where other high-beta names were pulling back notable. Instead, Meta kept displaying clear relative strength as buyers kept holding the line and closing green day after day.
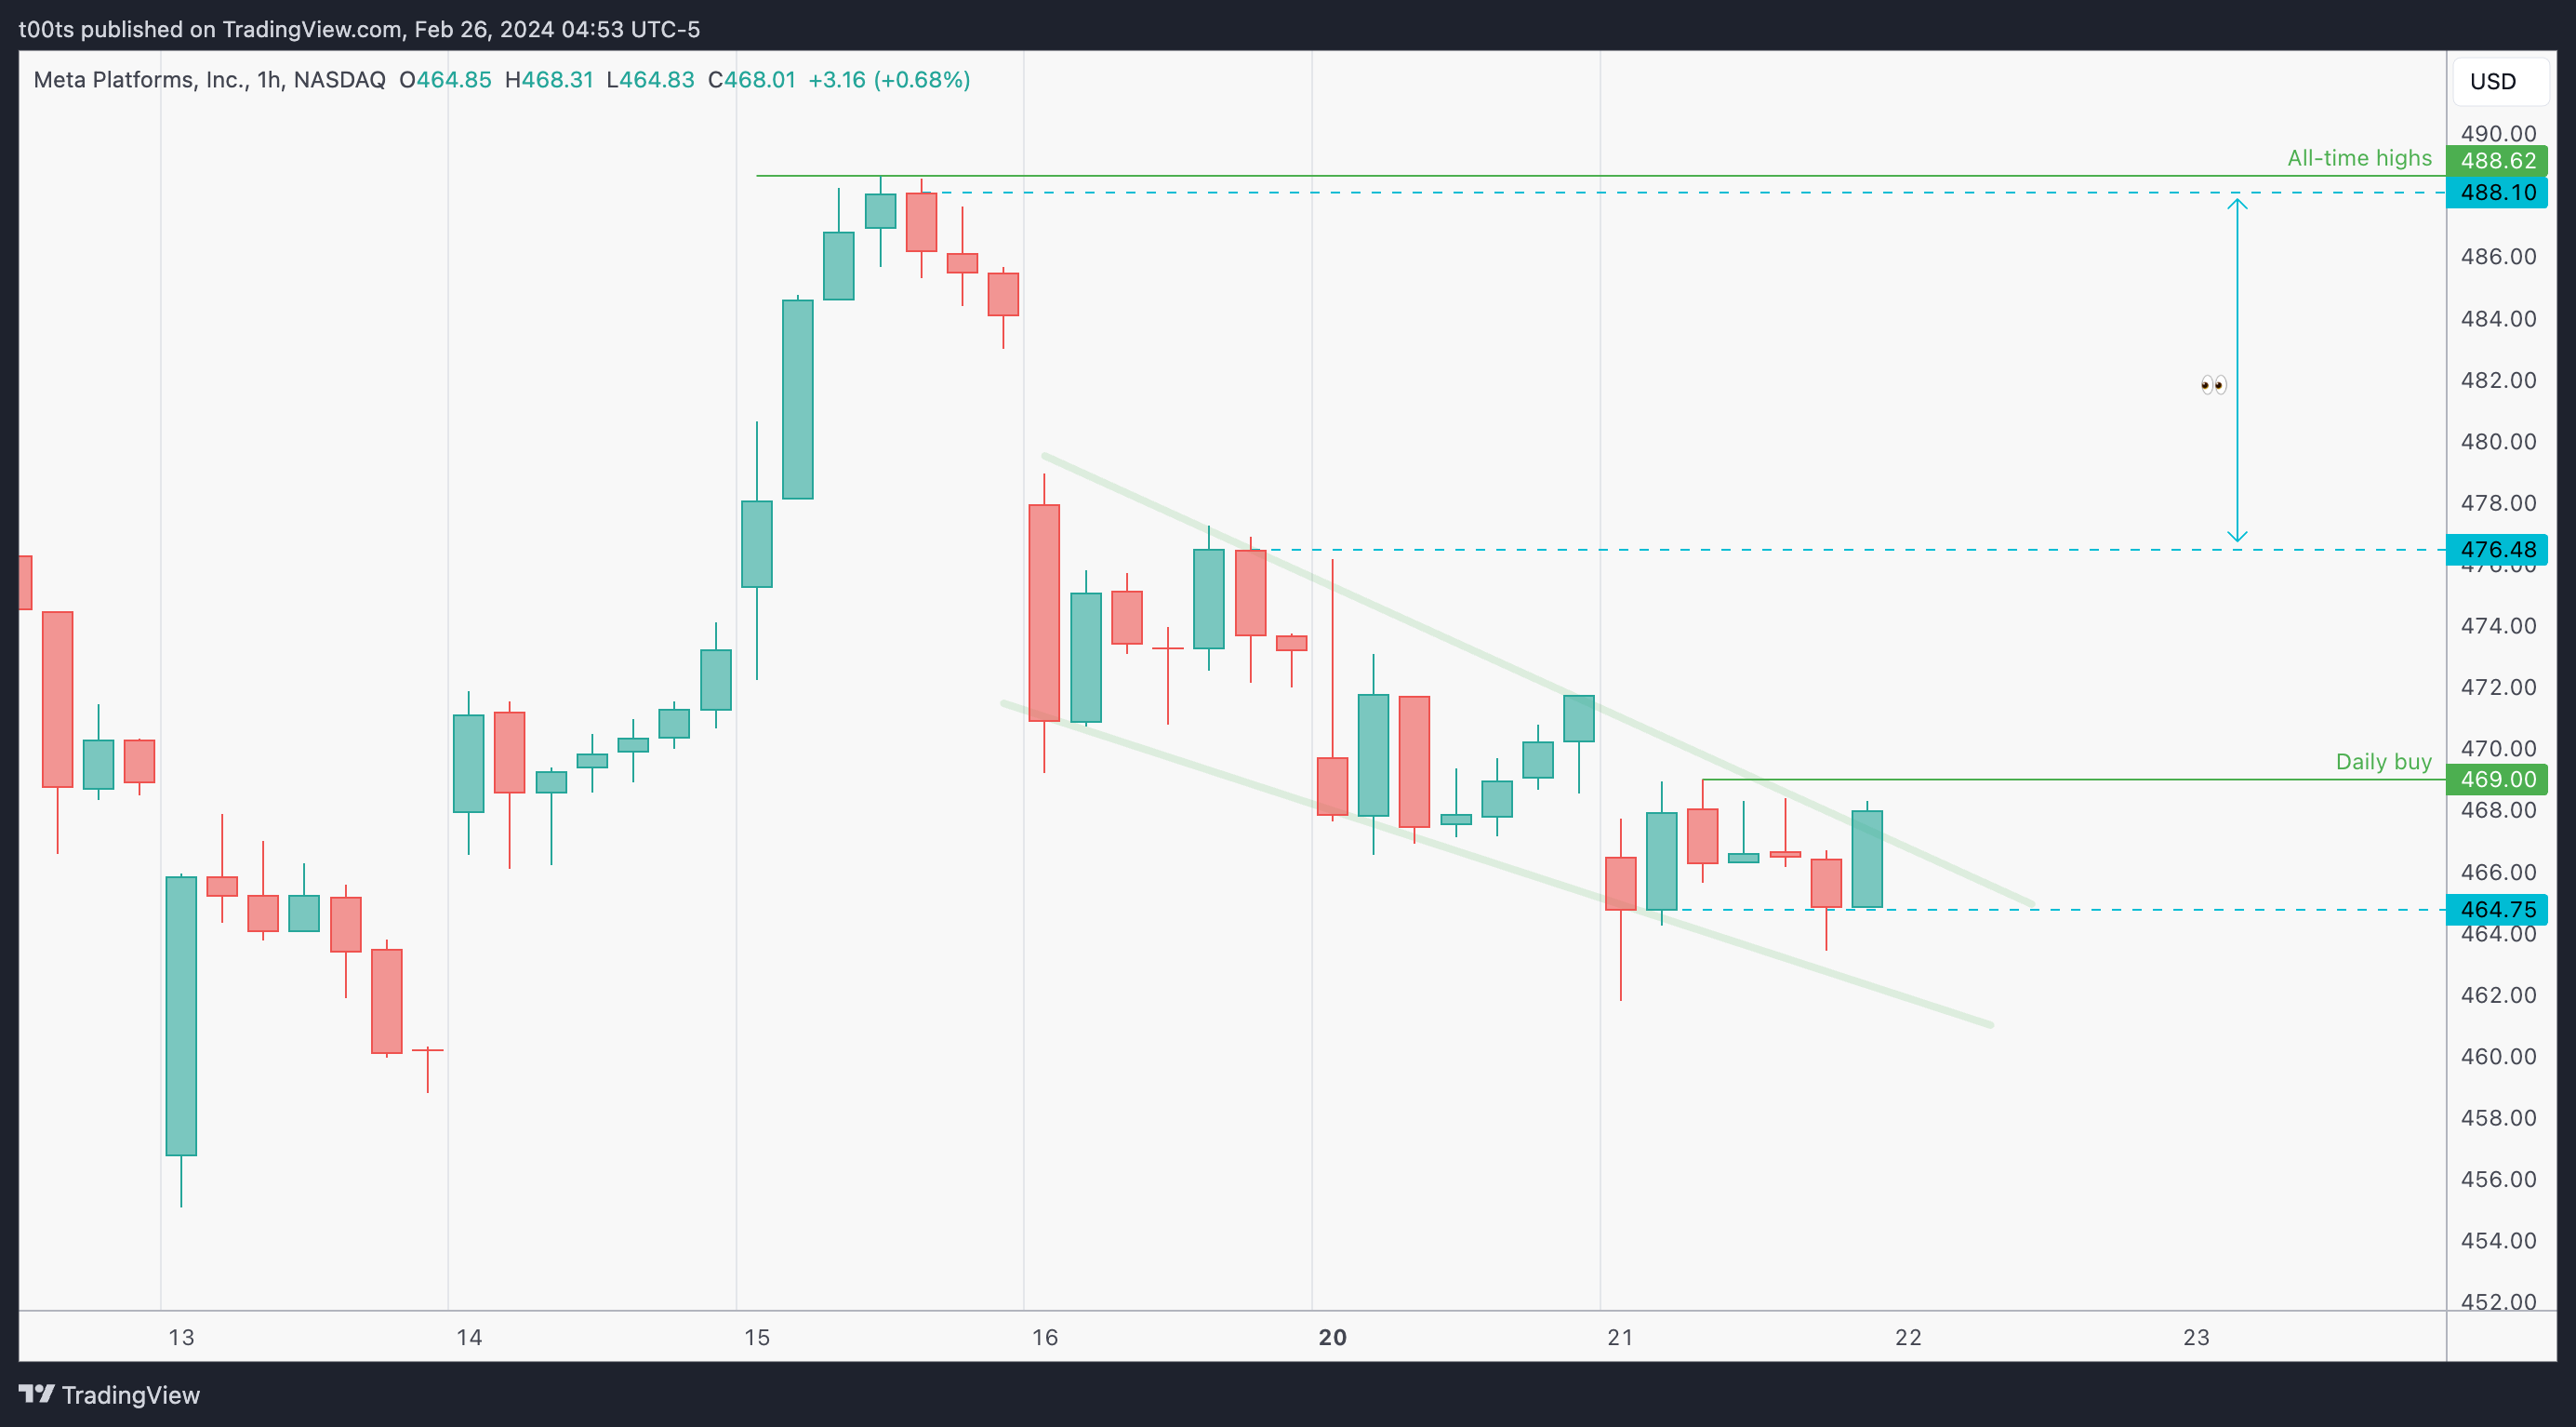
Hourly chart
In the hourly chart we can appreciate how price has been slowly coiling, creating a descending wedge. We also get a few levels of interest, which will be relevant as we head into the pre-market action.
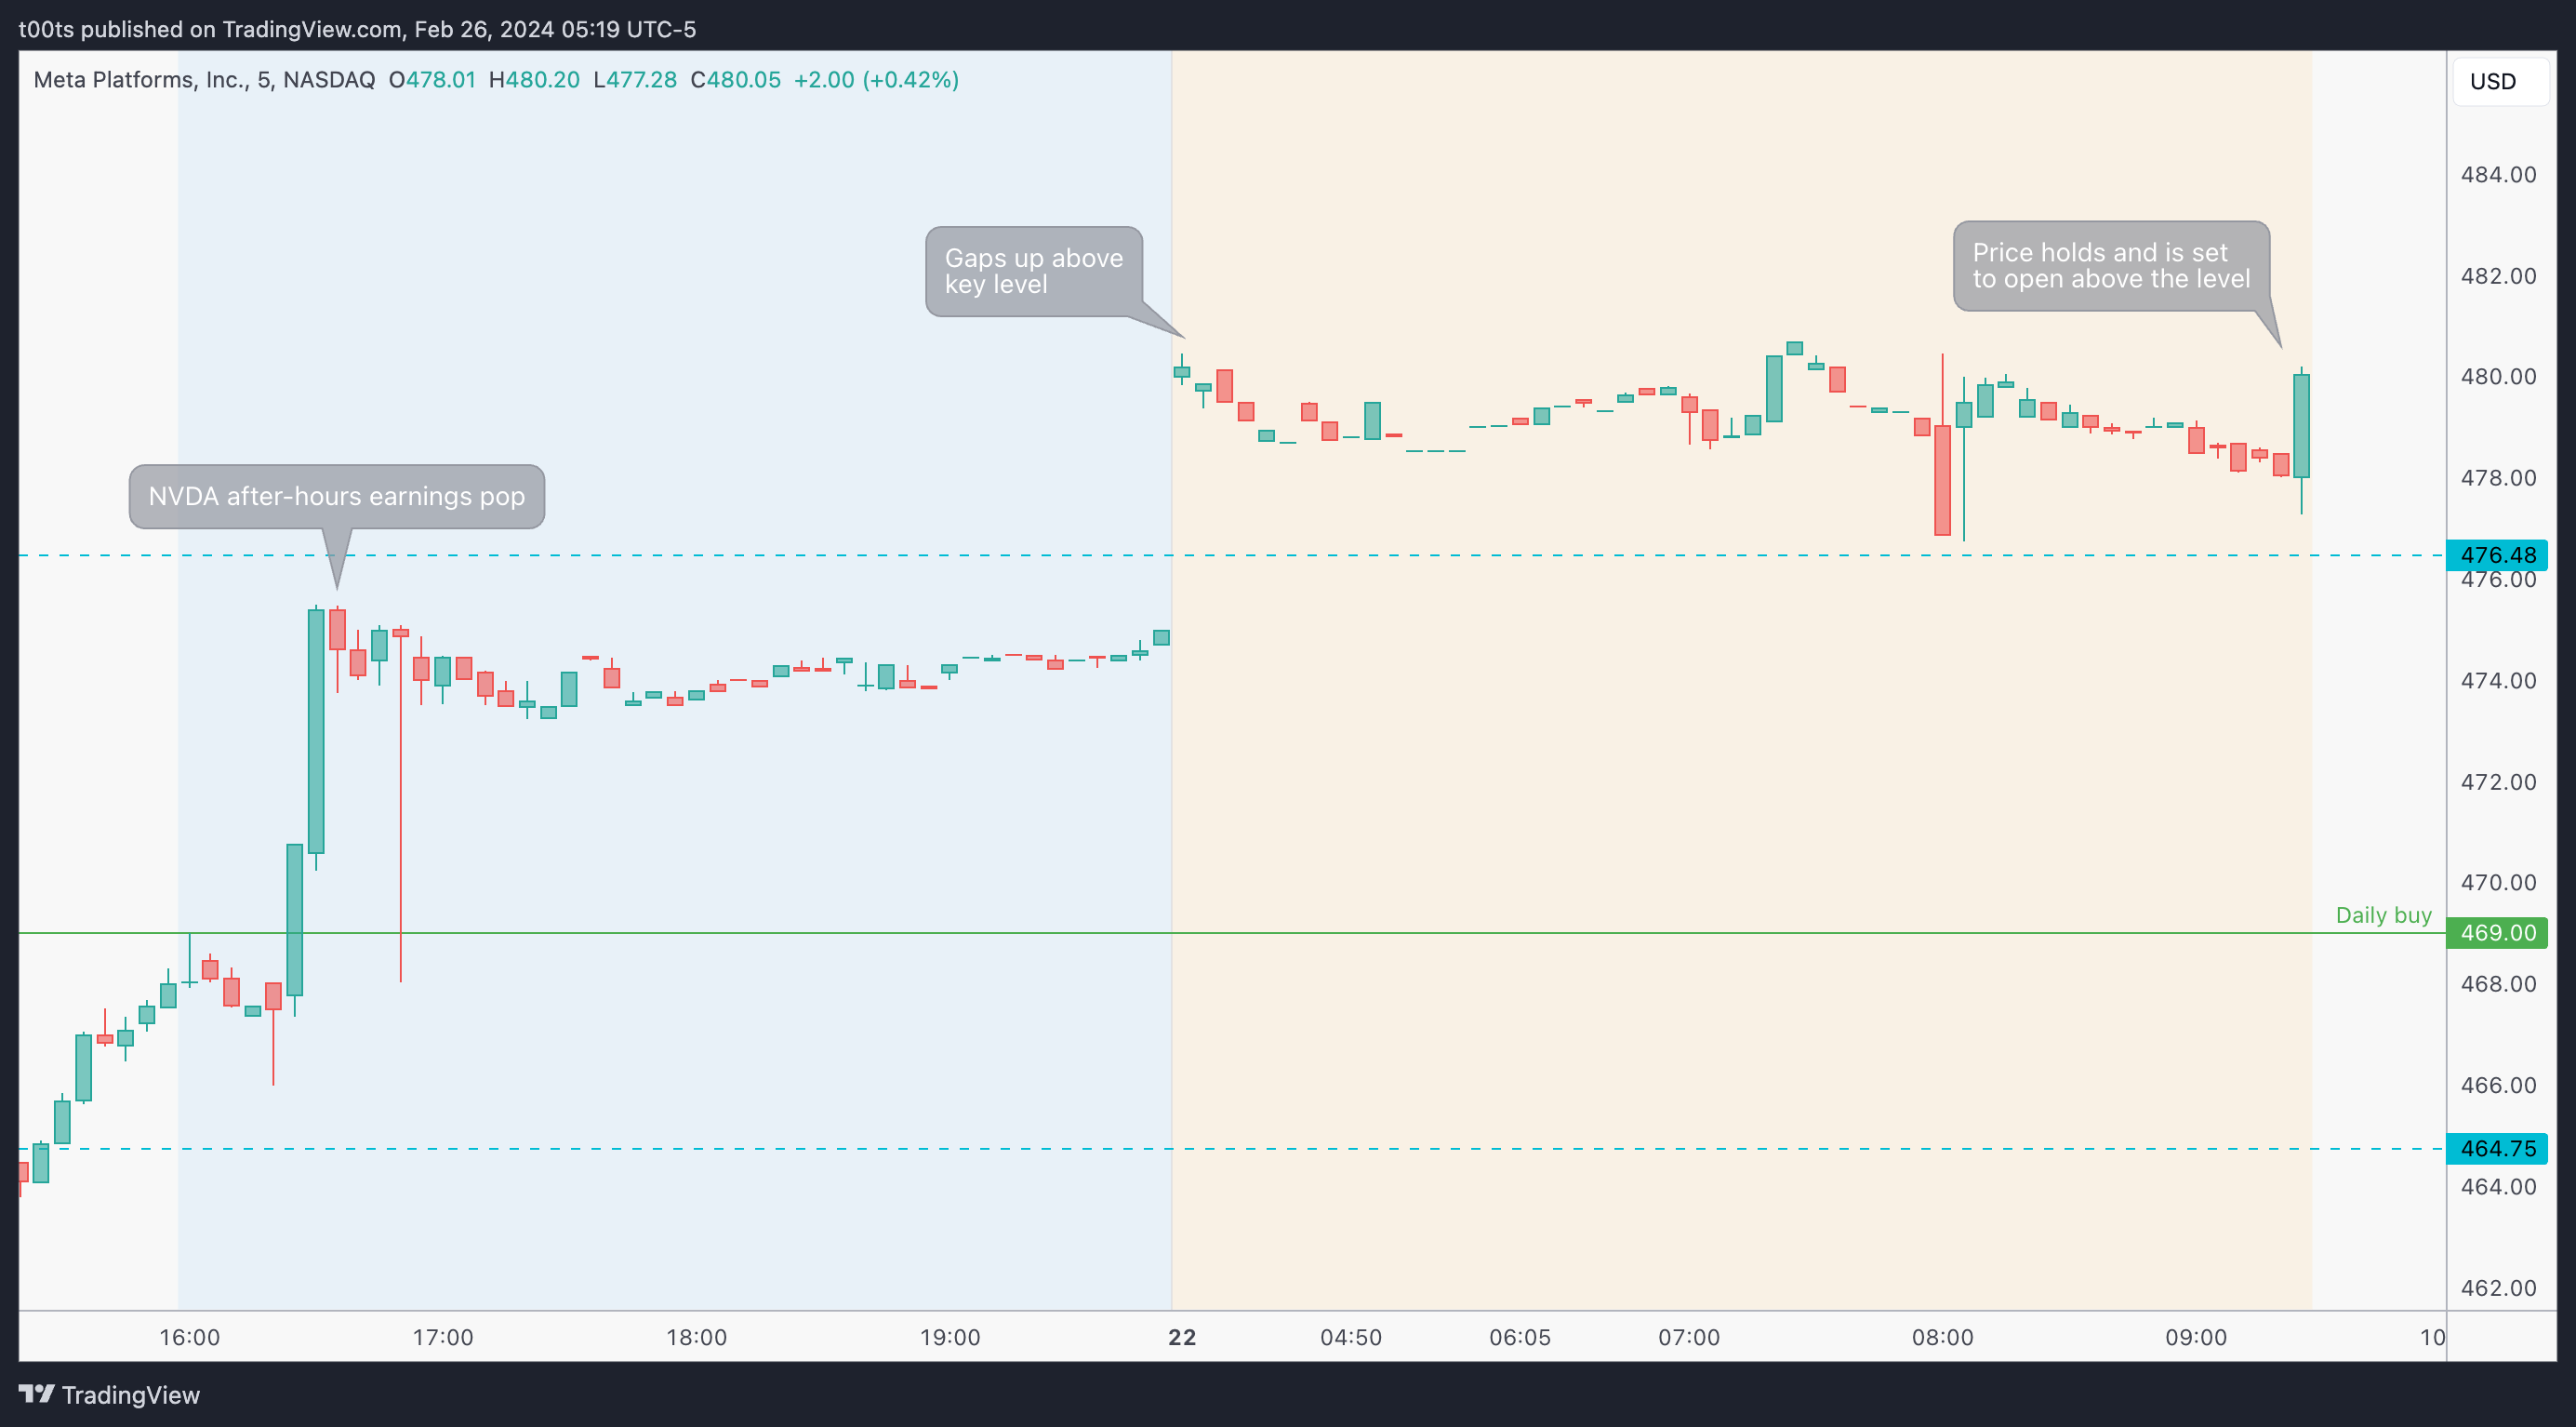
Pre-market action
Meta's stock is gapping up notably, which brings it into our attention. Price gaps up above the $476.48 level and holds throughout the whole pre-market, setting up for an open above it.
The trade
Anyone who's been following knows what's coming. This is a very common setup we've seen many times. So here's our CPT:
Cue(s)
Weekly chart consolidating at all-time highs
Daily gap up after failing to go lower
Stock gapping up and holding above a level
Intraday cue: Retest and bounce off the $476.48
Plan
When a stock is gapping above a level, we often want to see it retest the level and trade back above the opening print. Our stop is then set below the level and we can use the levels above as targets.
In this case, the open is a little too far from the level below, so our stop would be too wide. It's in these cases where we want to look for immediate reactions at the level and find buy points nearby, despite possibly being below the opening print. Here we found two, which we'll go over now.
Trigger(s)
Price trading above FTGL off the level
Price triggering 2m 3-bar play
2m chart (entry detail)
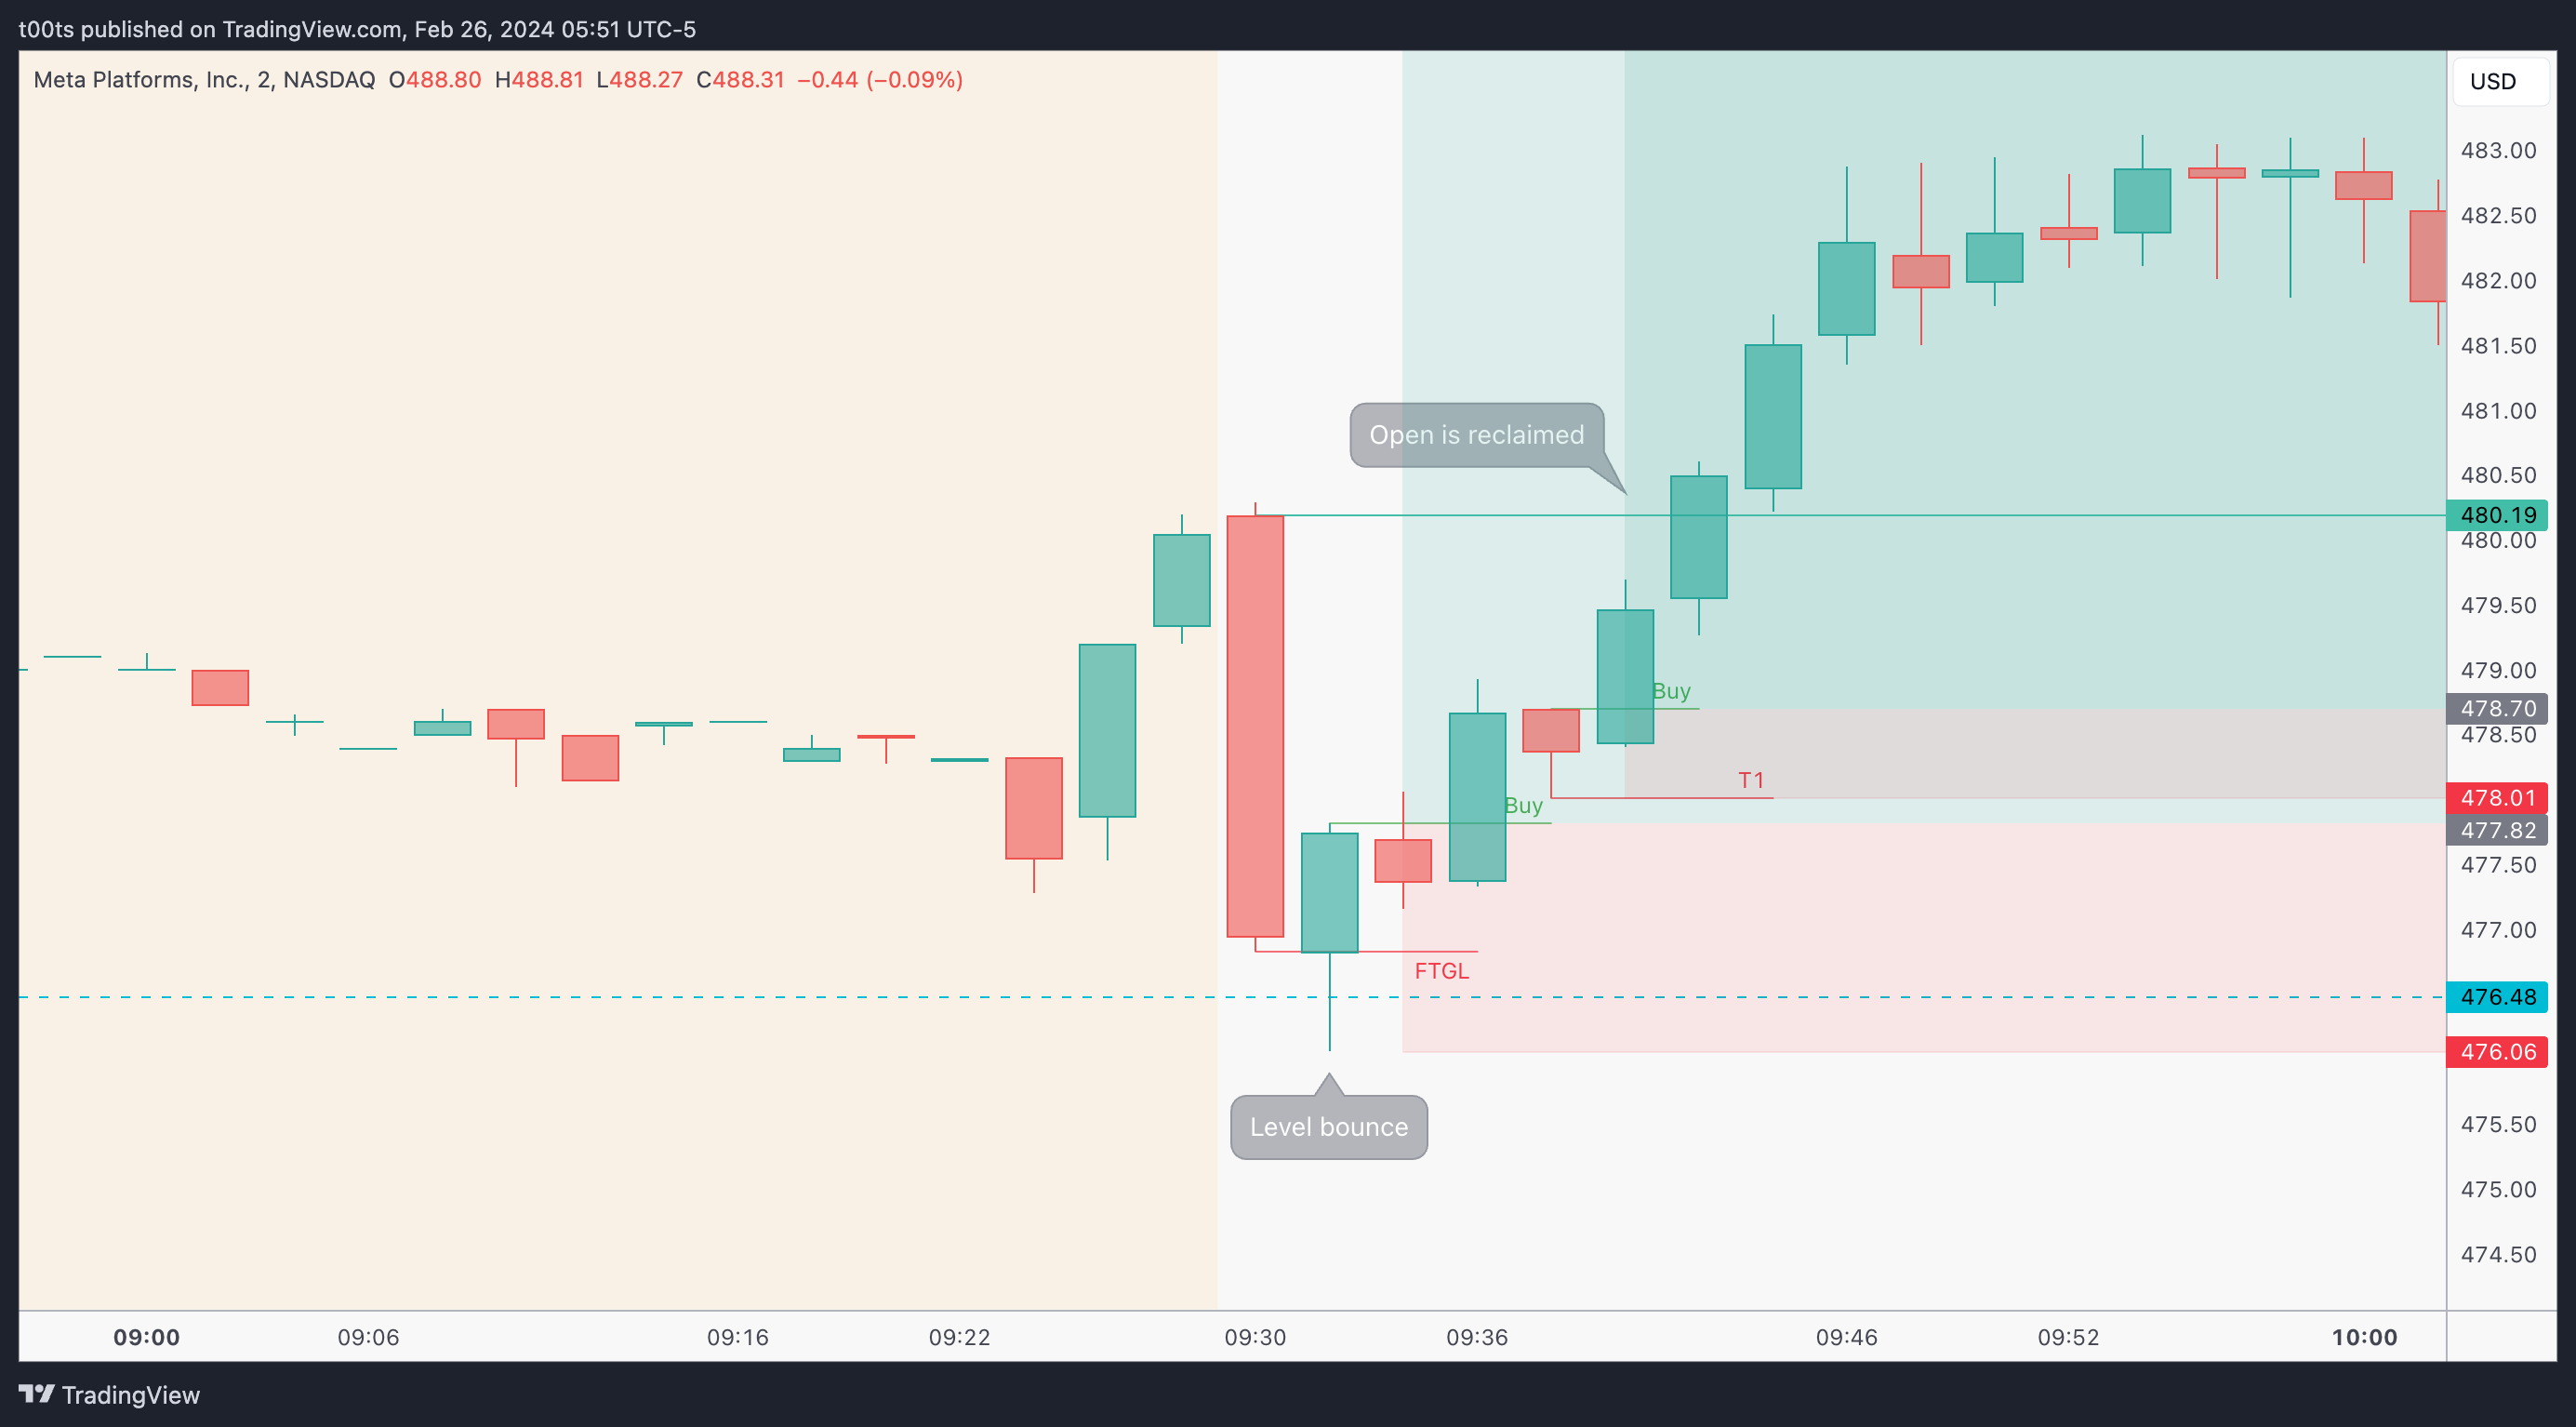
In this chart we can see in detail two potential entries the stock offered near the open.
The first one triggers when price trades above the bounce bar, confirming the interest of buyers in bidding price up.
The second one is a textbook 3-bar play that plays out wonderfully.
Both of these entries happen below the opening print, which is not ideal, yet they offer a much better risk-to-reward opportunity on the setup we're looking at, so, by definition, they're worth the risk.
5m chart
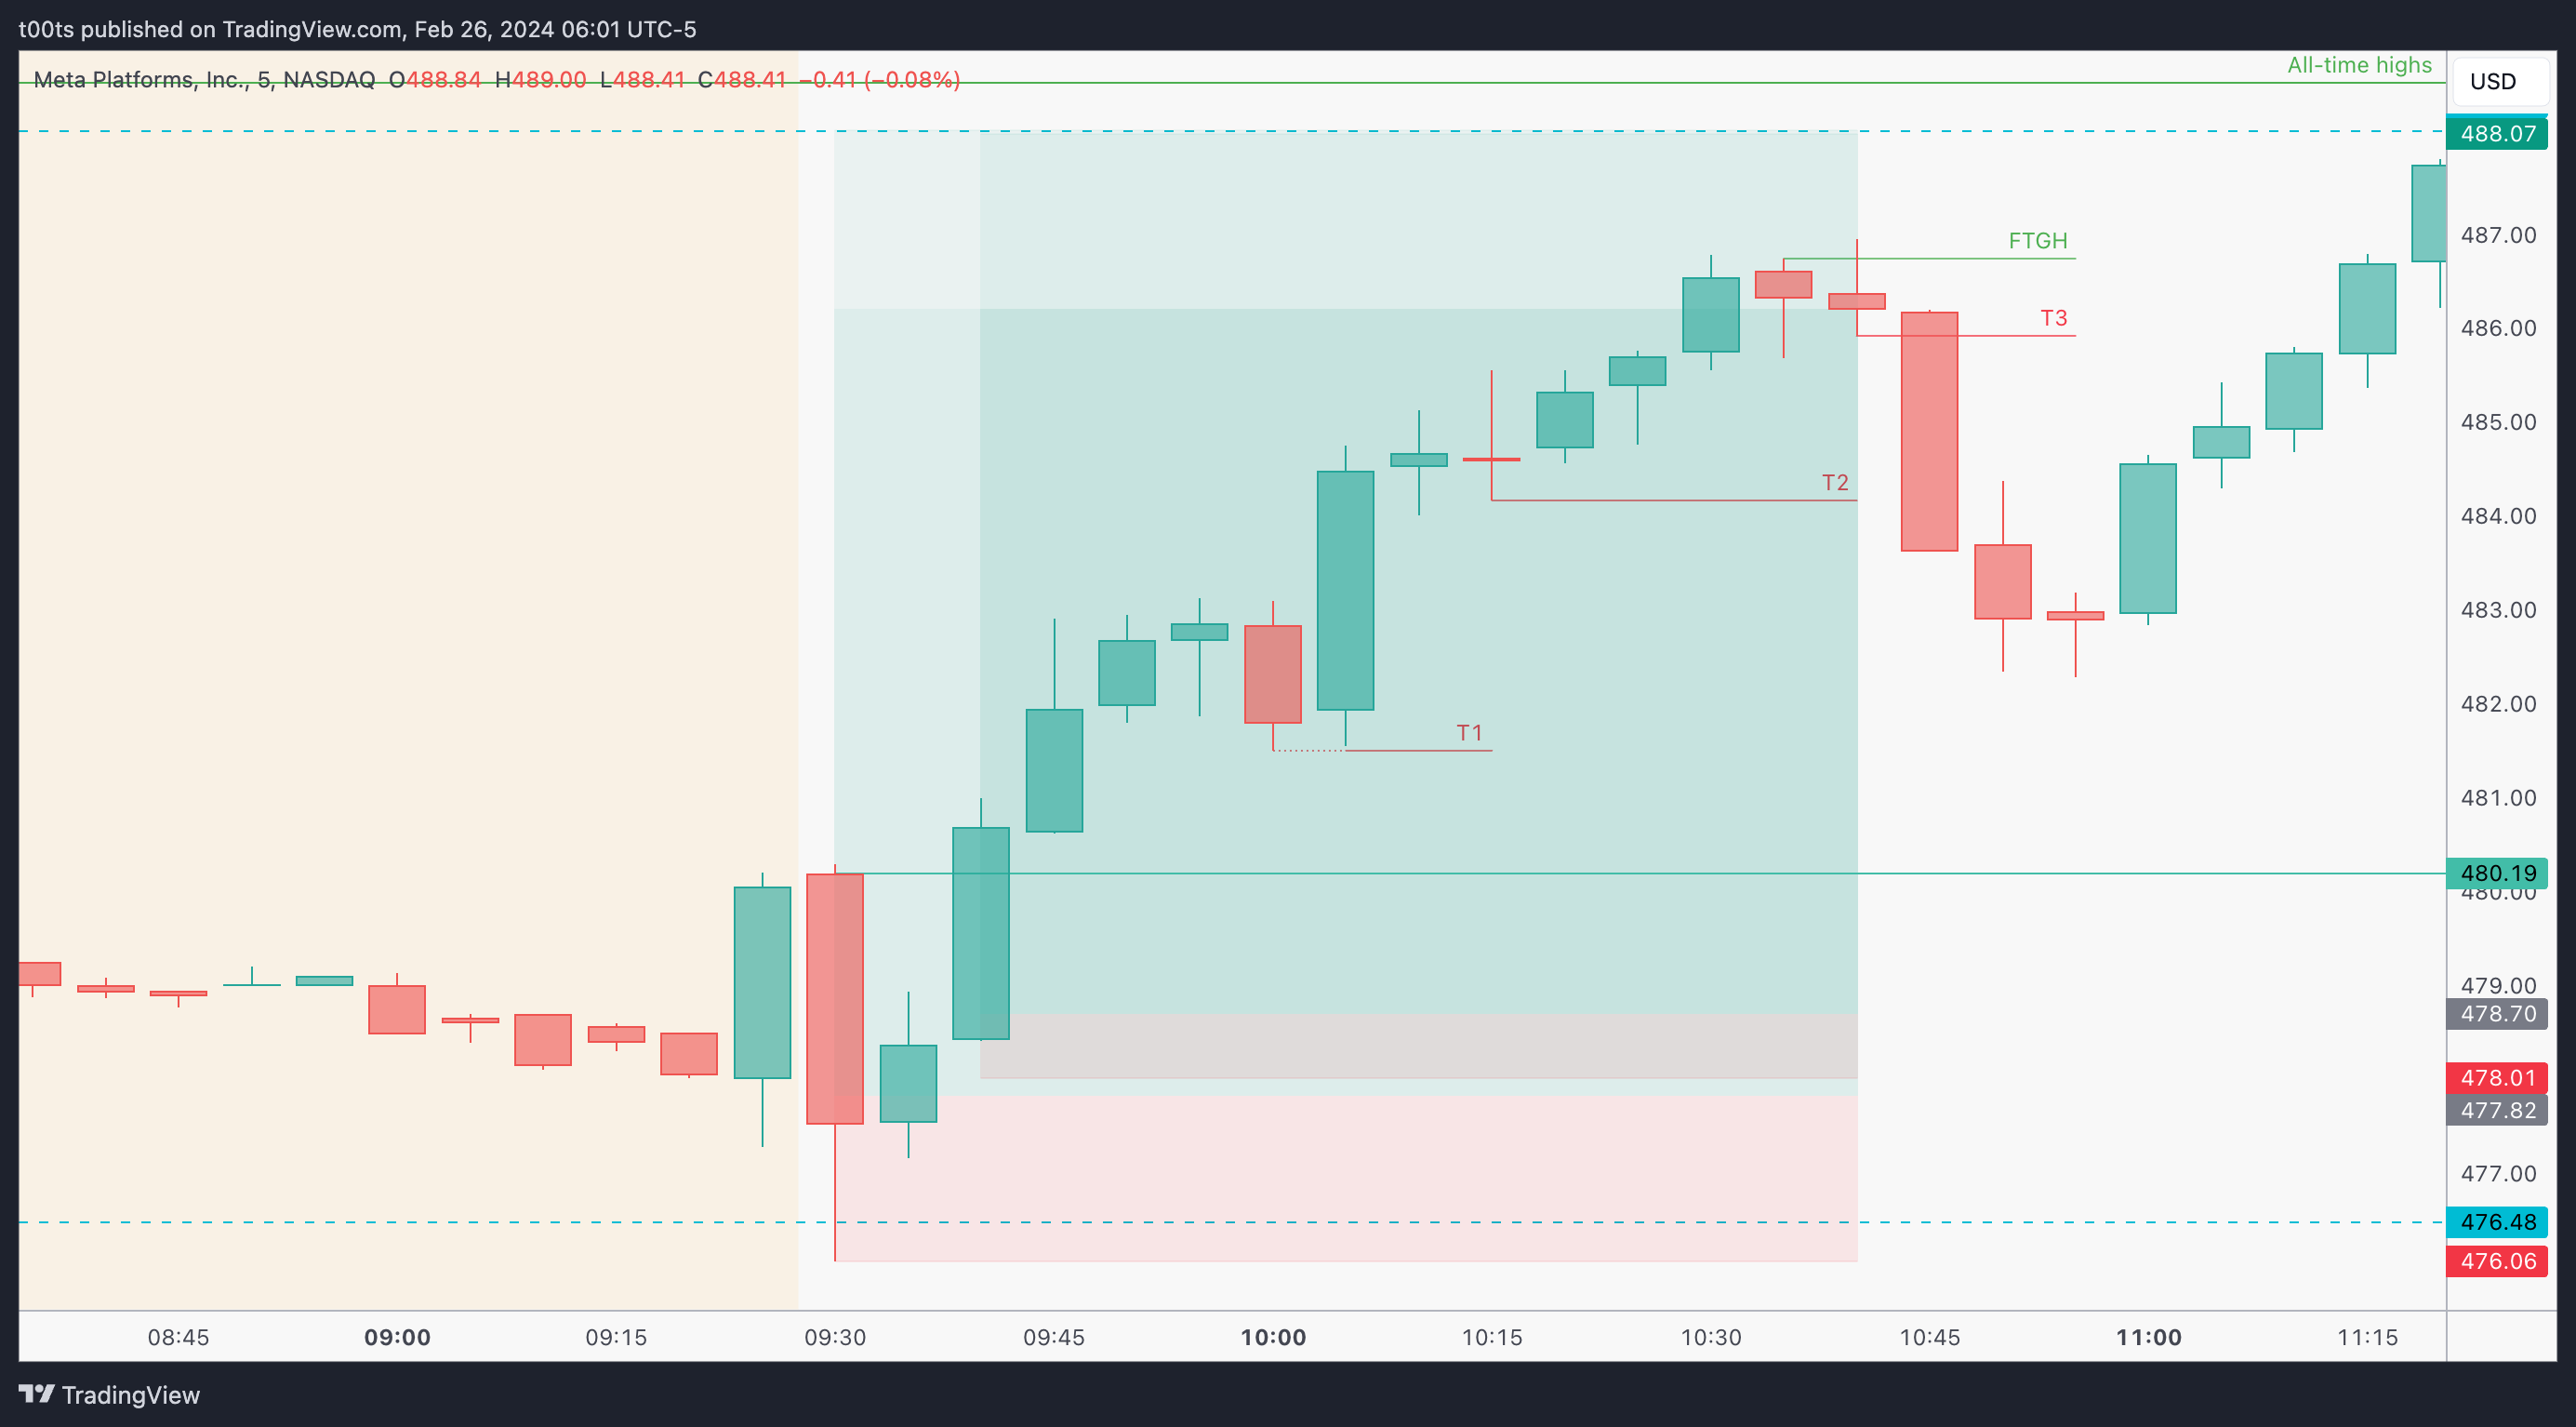
As soon as price reclaims the open, we can relax and switch back to our 5 minute chart to manage the trade properly.
The open is conveniently located near the $480 round number, so the moment price breaks that, we can use the open as our first trailing stop (not marked on the chart).
The first pivot after price consolidates resolves pretty quickly with a solid bullish trend bar, offering us our first mechanical stop trail at T1.
T2 is set after a failure bar but never gets triggered.
Finally, T3 is set below the lows of a failed breakout (3-bar play) bar, which triggers immediately.
After this pullback, price did later run all the way to the $488.10 target, but I'd argue it wasn't worth the hold.
Closing notes
We had to diverge a little bit of the usual script on this one in terms of our entries to lock in a better risk-to reward. If we had instead waited for the opening print to be reclaimed, the trade would not be so attractive.
This is where context and trader discretion play a role. It's important to know when it's ok to use more or less discretion. As a rule of thumb, it's always better to use less. So keep you discretion knob always in check and dialled at the lows of the range.
I am posting one trade writeup every day throughout 2024. I focus on large caps using levels and price action. The subscription is absolutely free and will always be. I will strive to provide value by offering clues and ideas for you to enhance your edge. Let’s grow together!