
JP Morgan (JPM) - Jan 4th 2024
Backside short after failing to hold new all-time highs

Higher timeframe context
JPM is one of those charts I've been staring at for a while as it's been rallying with no breaks since late October. This last leg up accounts for a 30% appreciation of value on the stock. Notable, to say the least.
For the sake of context, I'd like to bring a few things to your attention on this weekly chart.
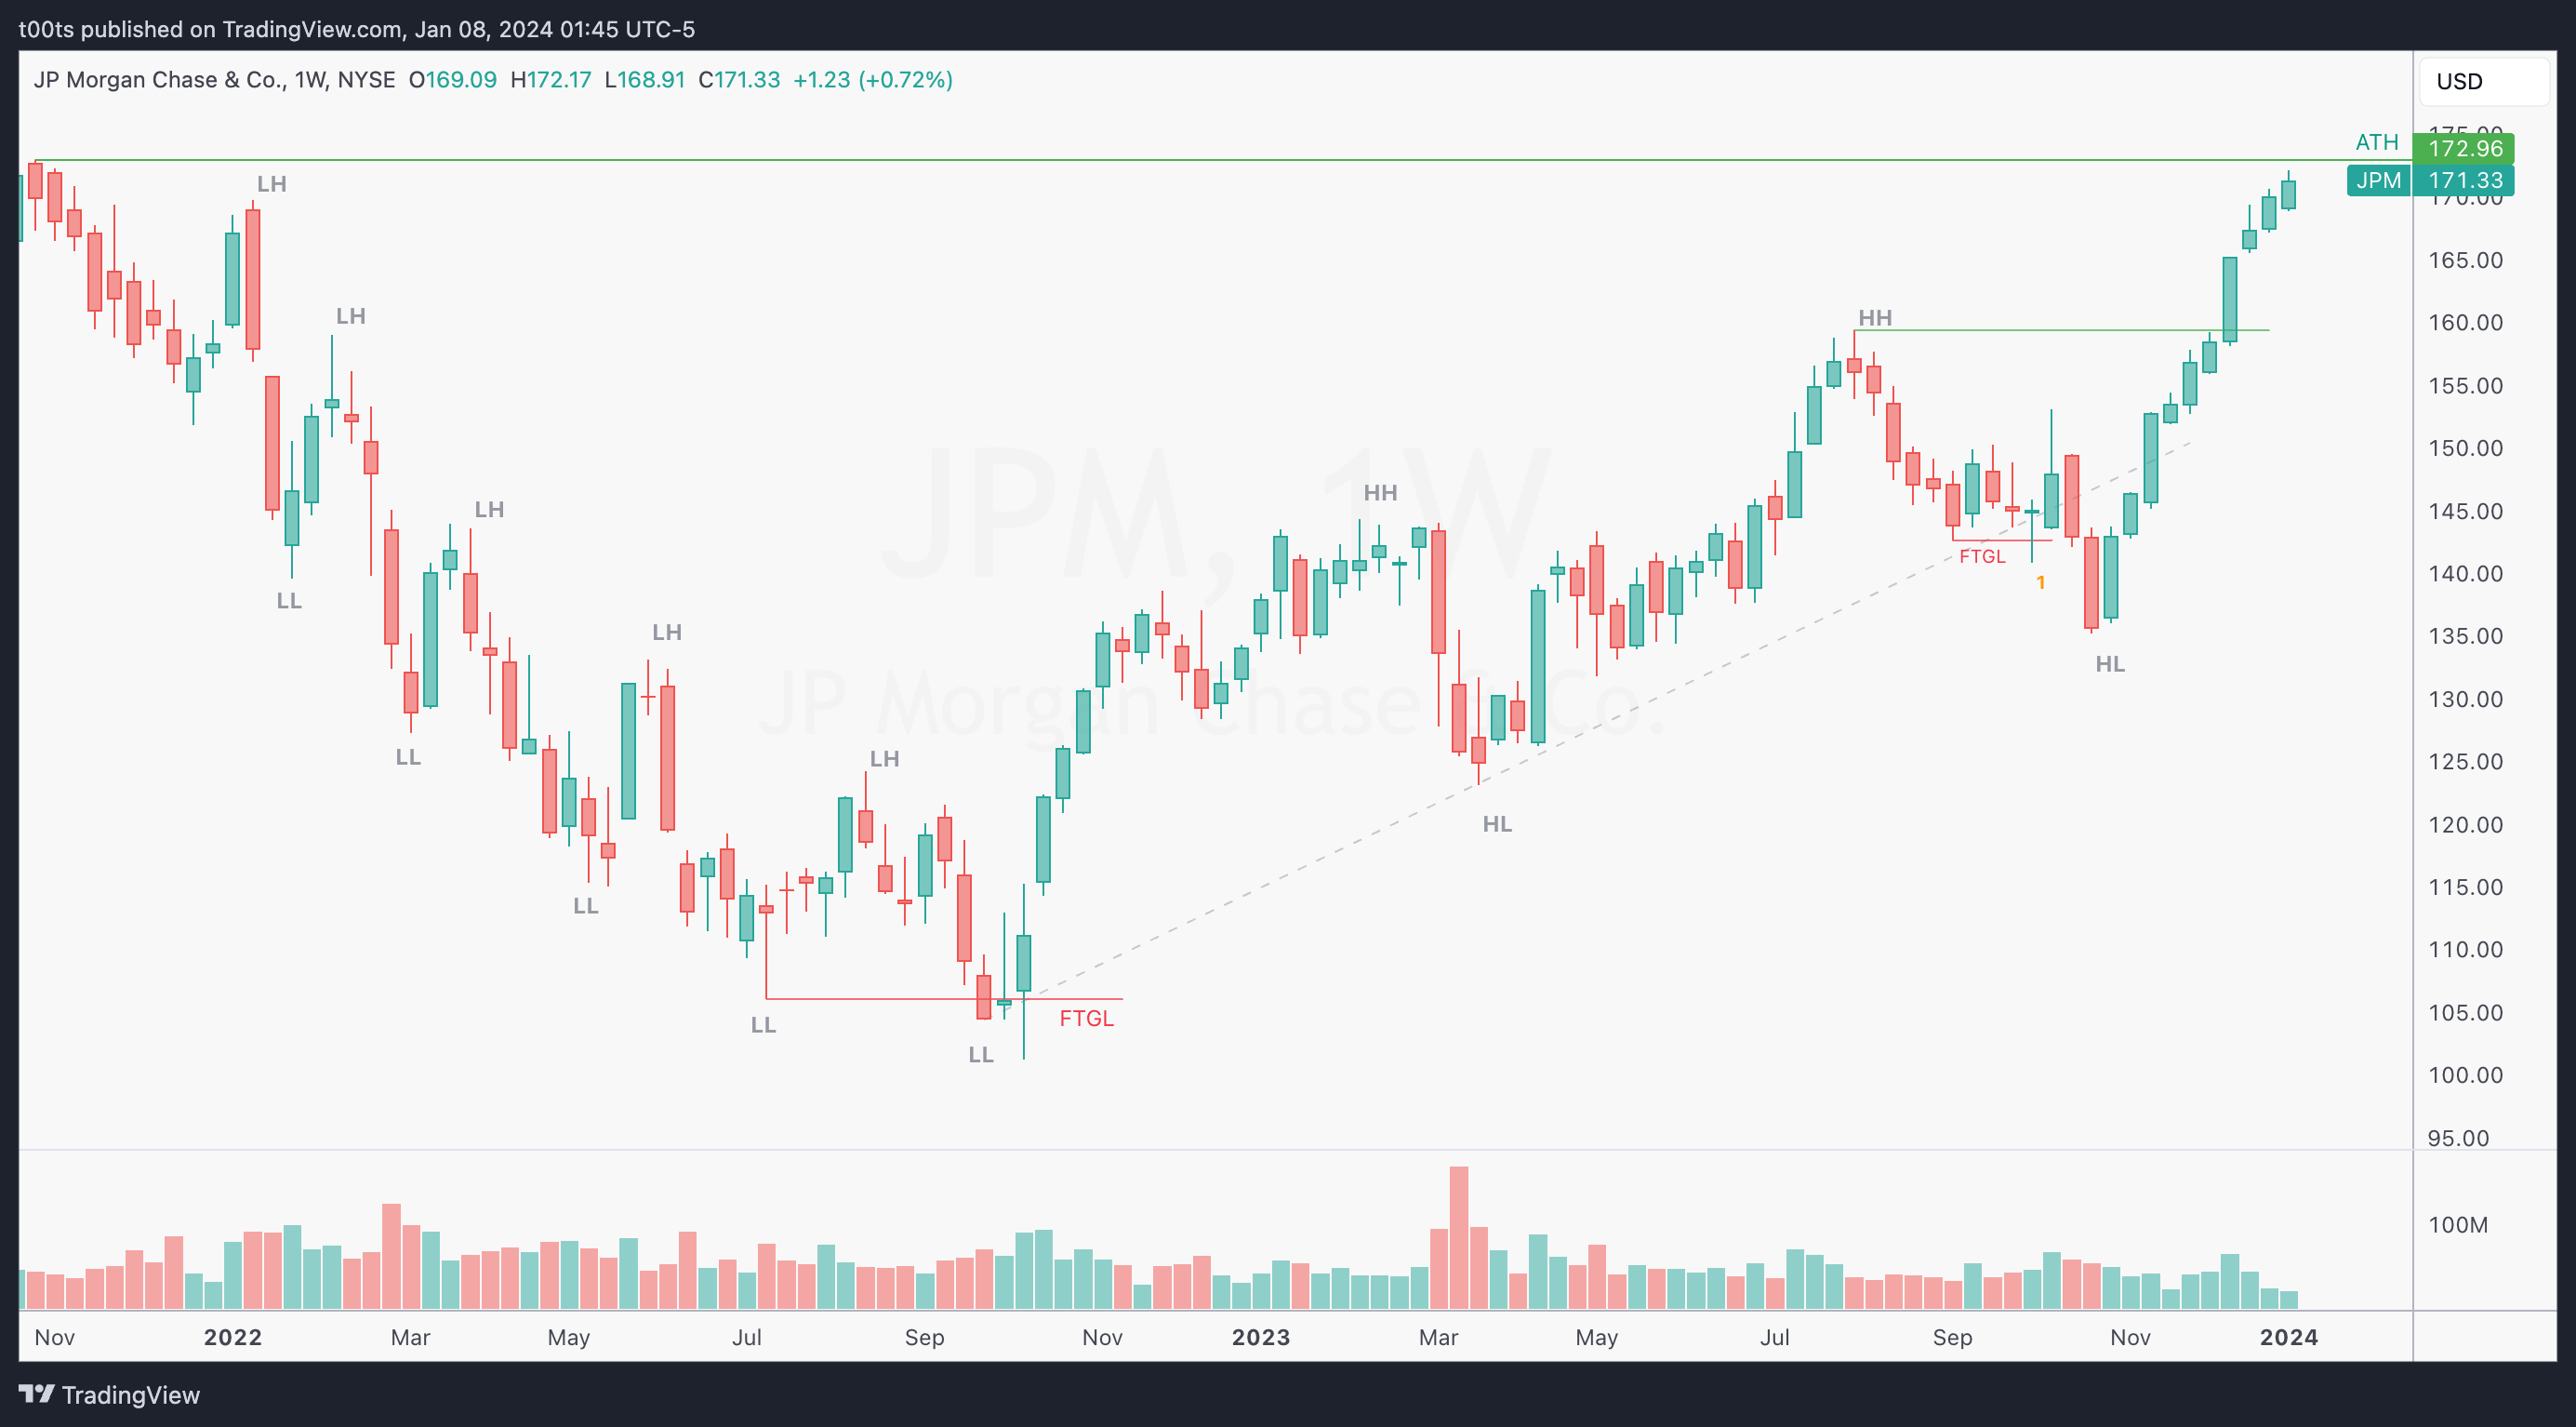
First off, we can see how the trend flipped on that strong failure to go lower around October 2022. These failures, more often than not, lead to great trades in the opposite direction. This one was no exception.
Now look at the failure pattern that happens a year later, around October 2023 (marked with a 1). It's a two-legged pullback with a breach below the first leg's low that fails to go lower. It also aligns with a long-term trendline. This is an A++ setup, yet... it fails! (To be fair, it does work a little bit but then fails) The failure was due to an earnings release that caused price to turn around. And despite those two strong weekly closes under the trendline, buyers managed to pick her up, reclaim the trendline, and squeeze the sh*t out of the shorts, leading to the current rally we find ourselves in.
Daily chart

The daily chart gives a little bit more detail but essentially conveys the same information. Stock is super strong heading into all-time highs. Something I thought was worth our attention here, besides nearing all-time highs, is that price is setting up for a bullish 3-bar play. This is a very common setup found recurrently across the market and can generally lead to great trades.
Hourly chart
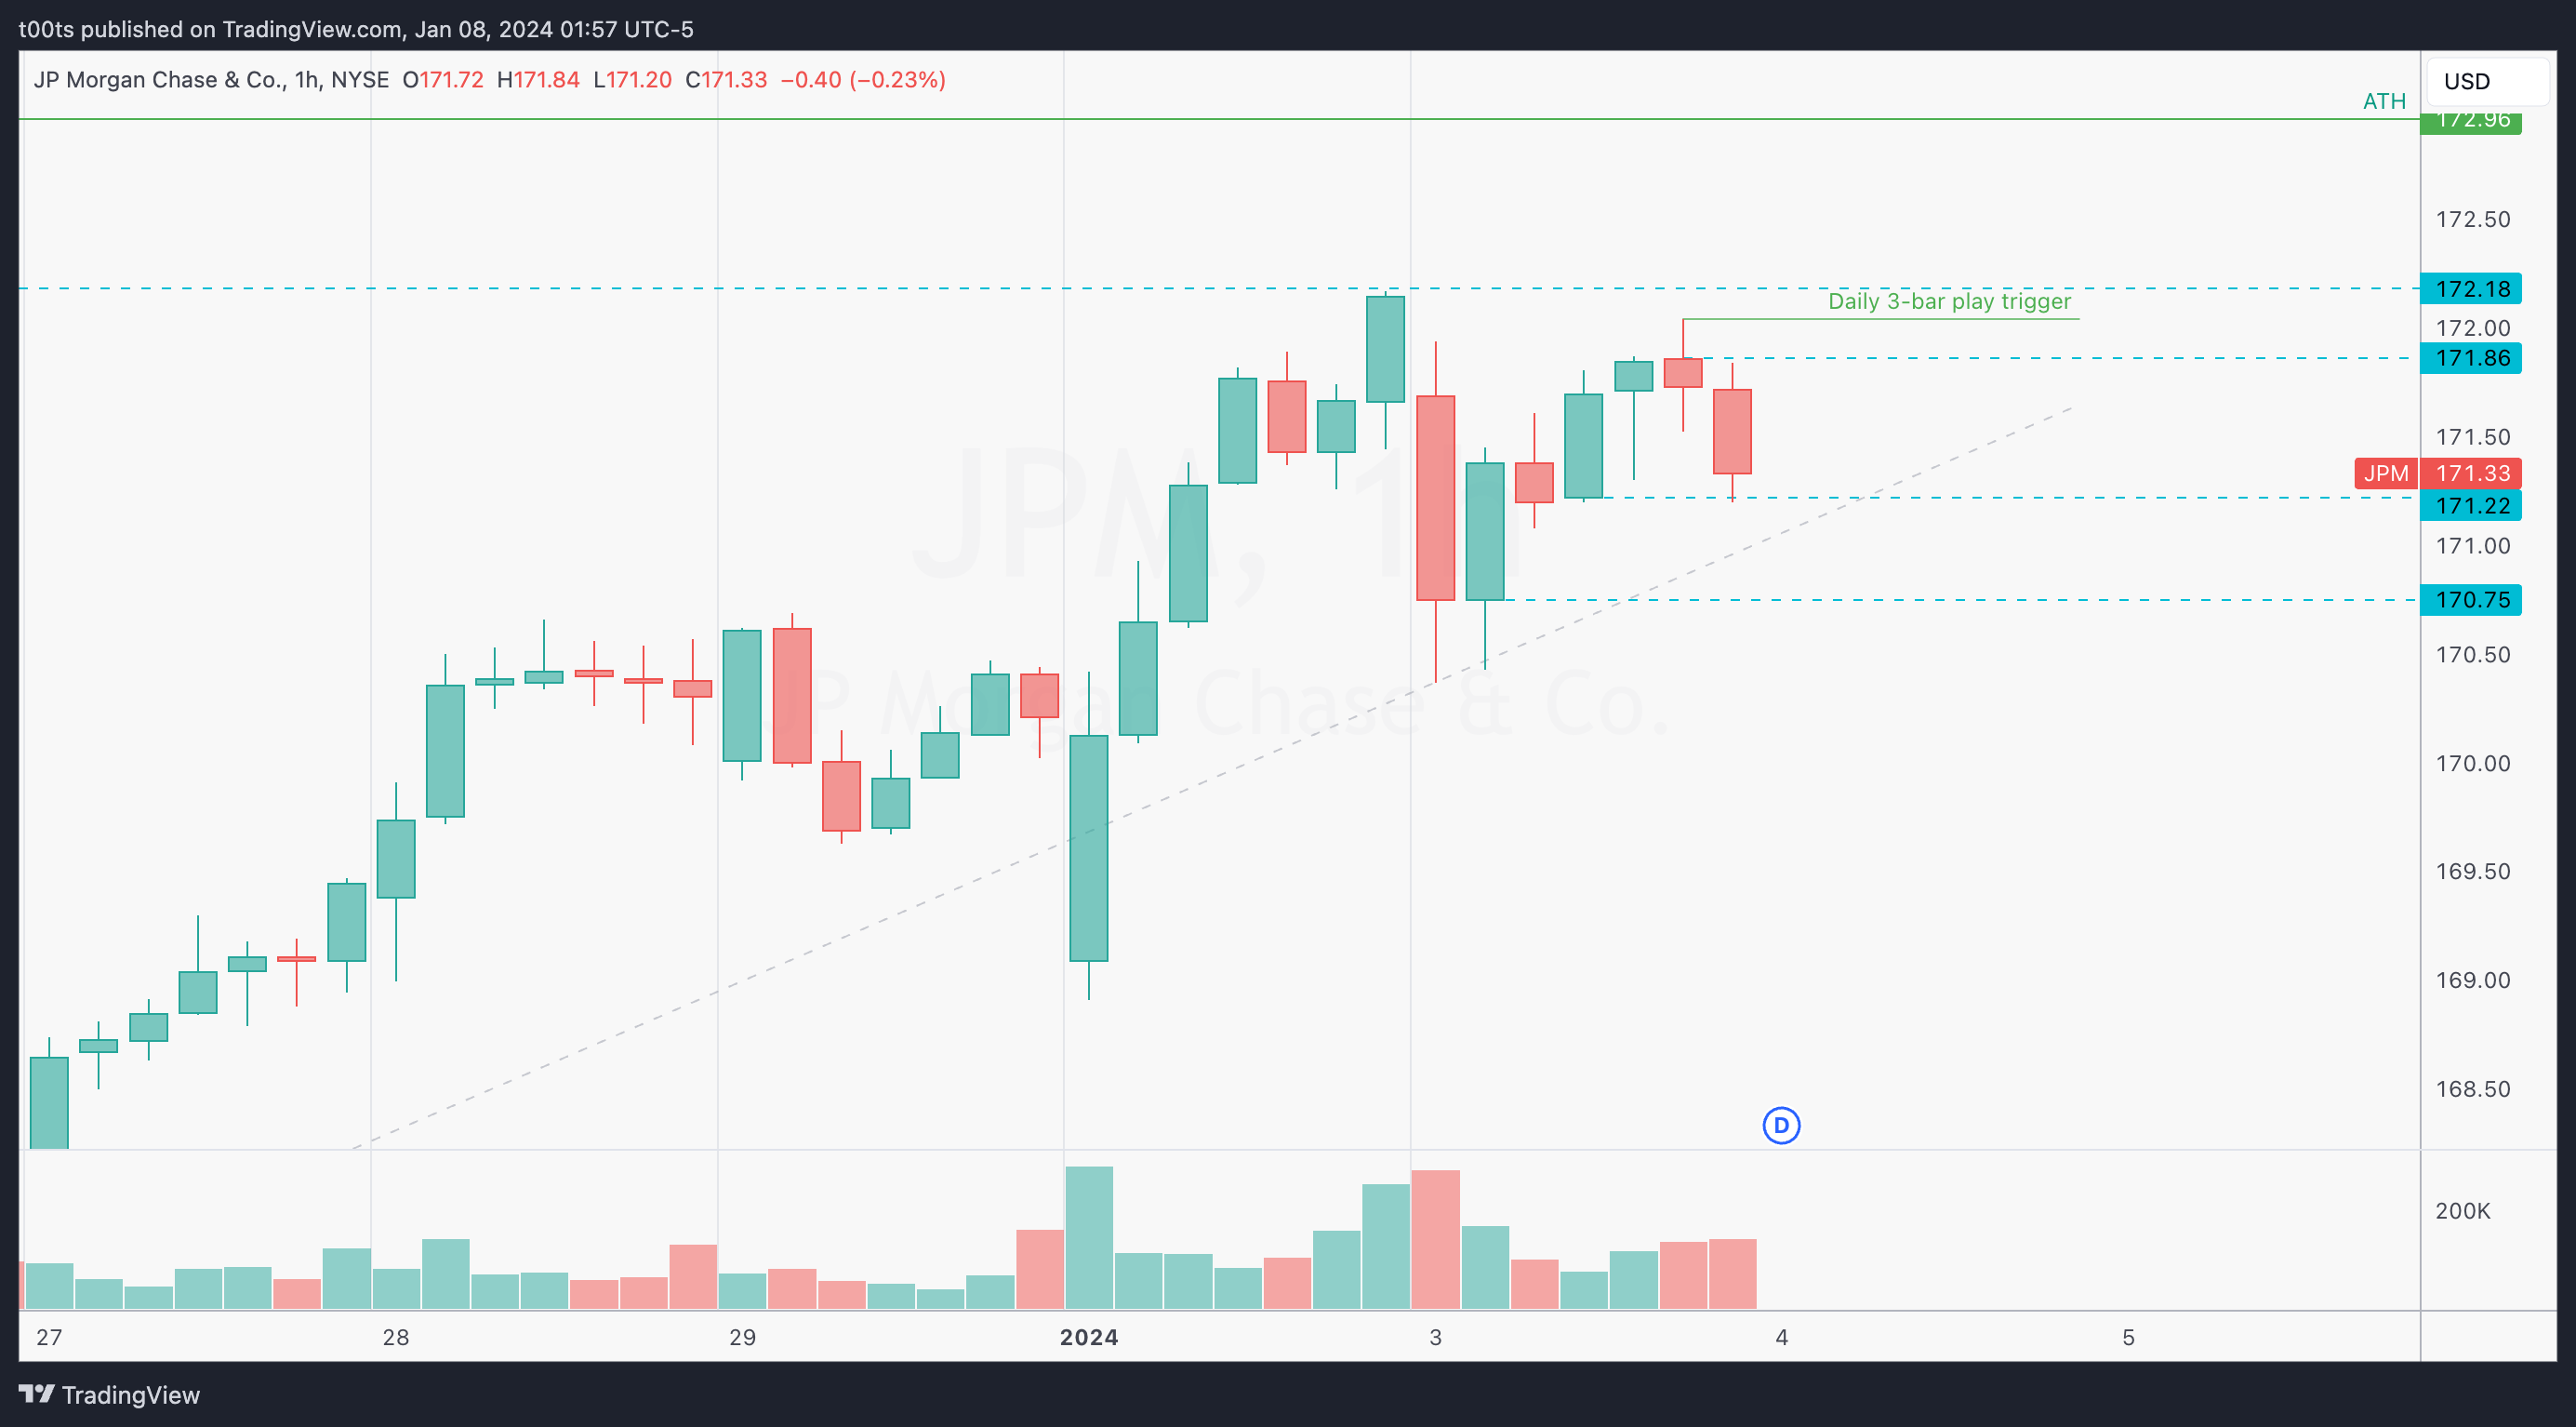
There's not much to highlight on the hourly chart. We can once again appreciate the clear uptrend. We have our levels in place, and I marked the previous day's highs to establish our trigger for the daily bullish 3-bar play setup.
Pre-market action
Pre-market action here was irrelevant. I didn't consider it (didn't even see it) to take the trade.
The trade
If you've been following so far, you probably expect a long trade. The truth is I wasn't even looking at this stock until it hit my alert when it made new all-time highs. Given the massive run we've discussed, and once the previous all-time high's were breached, I was interested in potential short scalps. As I’ve mentioned on previous posts, in order to take a counter-trend trade all we need is a level of reference to risk off of and a second entry.
Using our CPT Framework:
Cue(s)
Absolutely massive move up with no pullbacks into ATH's
Intraday cue: Just breached previous all-time highs
Intraday cue: SPY pulling back hard intraday
Intraday cue: Failure to go higher at HOD (high of day)
Intraday cue: Fails to hold prev. all-time high level
Plan
Once again, this stock is brought to my attention by an alert. The moment SPY starts pulling back (around 11:30 EST) I consider the possibility of a liquidity grab above previous all-time highs leading to a failed breakout and backside short opportunity. The plan is simple: As we always do when trading counter trend, wait for a second entry. Our first cue here was JPM failing to hold the new highs and breaking the uptrend. At this point, all I need is a signal bar that sets up a potential lower high.
Trigger
Price breaking below the bearish signal bar.
5m chart
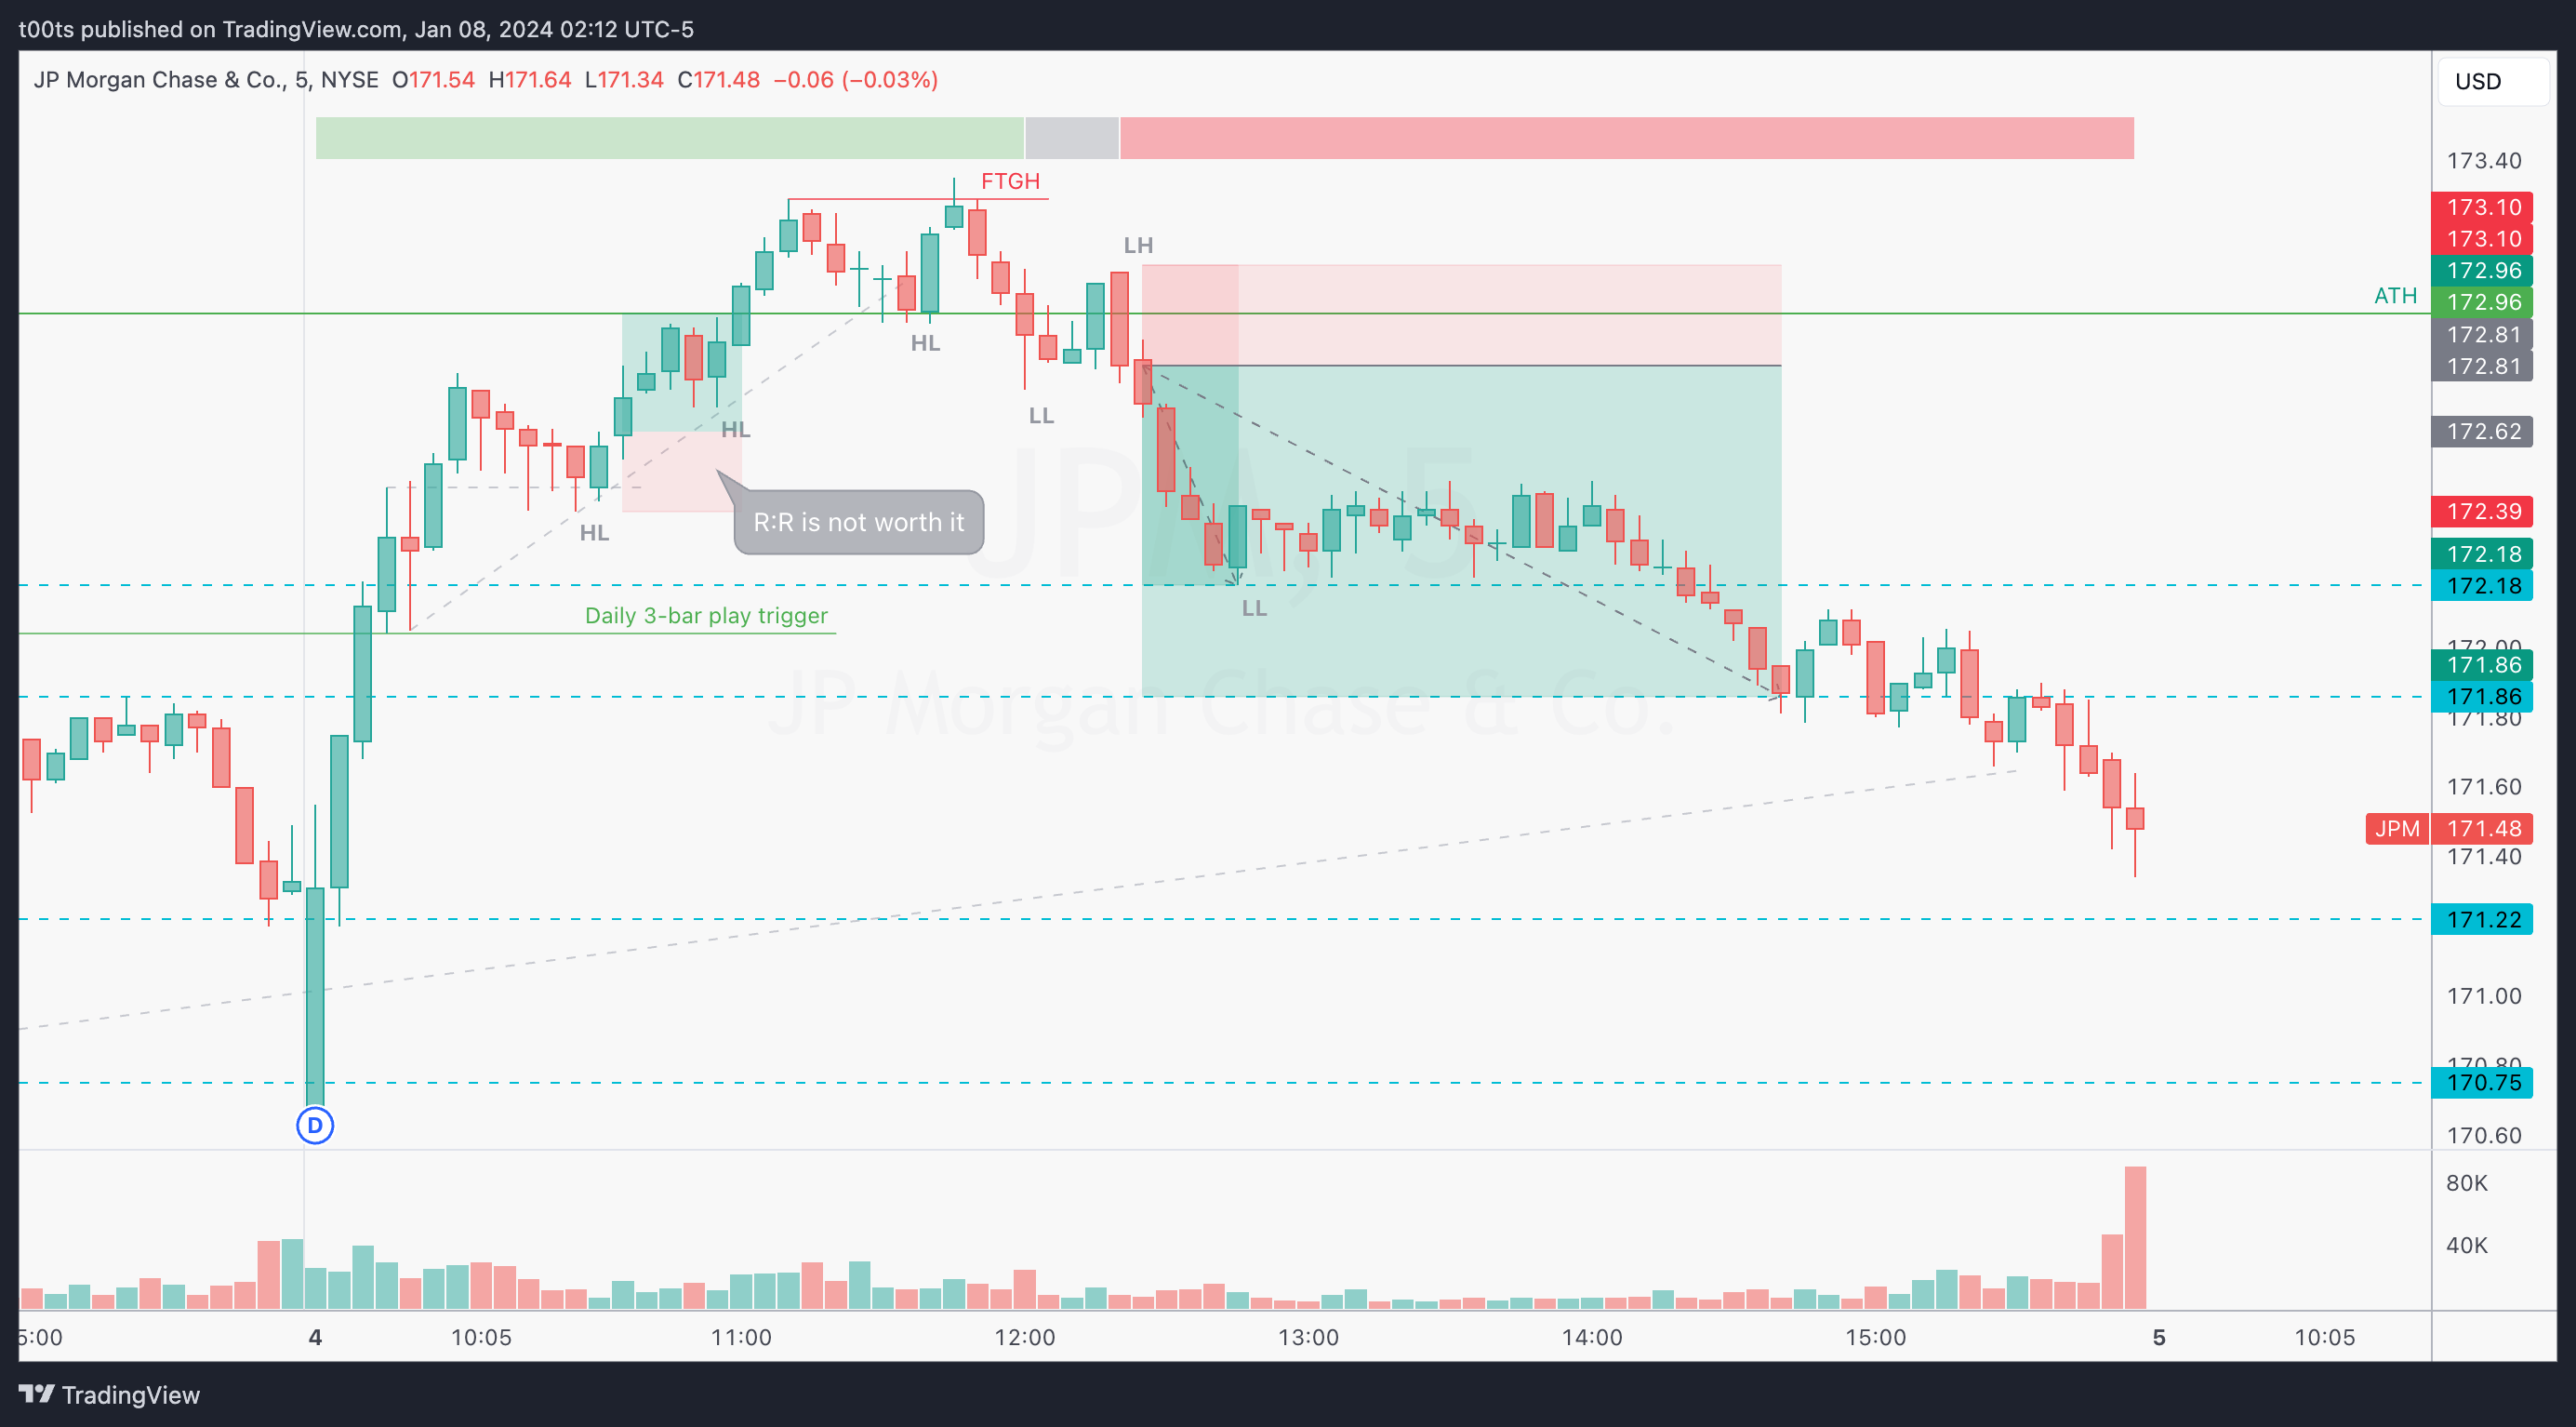
I've marked the highs and lows in the chart so it's easy to see the trend change. Everything starts on that failure to go higher at the highs, that leads to price breaking structure and losing the previous all-time high level. At that point, and considering how hard the SPY is pulling back, we're just waiting for our entry.
Our entry is not the prettiest and unfortunately doesn't allow for a higher R trade as we would like. That bearish outside bar that completely wipes the bulls' last attempt to hold the new highs is a good-enough signal bar for us to trade off of, risking its highs, and targeting the two levels we have below.
Why not swing?
I thought I'd address this. The answer is simple. The daily chart is still a very strong uptrend. There's really no signs of stopping yet. The trade we've taken is based on intraday information exclusively. We are trading against the overall trend, so there's really no setup for a swing. In order to look for swing shorts on this name we'd need a reversal pattern of some kind and then wait for our second entry. I'm sure we'll get one soon.
SPY chart

Here's the SPY chart for that day. I've only highlighted the trend leading to the exact moment where JPM tops. Notice how SPY is already pulling back. I actually posted an in-depth review of this day on SPY a few days ago, in case you’re interested.
Closing notes
When stocks breach strong liquidity levels, in this case those previous all-time highs, more often than not we see pullbacks. Reason being is that there's liquidity sitting on top of these levels. Essentially, stop orders waiting to get filled. Big players who've been trading this name long use these stop orders to offload their positions without moving the markets too much.
In this particular case, we didn't see high volume above these levels, and it's quite possible that price would've continued if it weren't for the SPY pullback. That's why we always wait for our second entry before jumping in a counter trend trade.
I am posting one trade writeup every day throughout 2024. I focus on large caps using levels and price action. The subscription is absolutely free and will always be. I will strive to provide value by offering clues and ideas for you to enhance your edge. Let’s grow together!