
S&P 500 (SPY) - Jan 4th 2024
How to approach a counter-trend entry for a monster swing short

Higher timeframe context
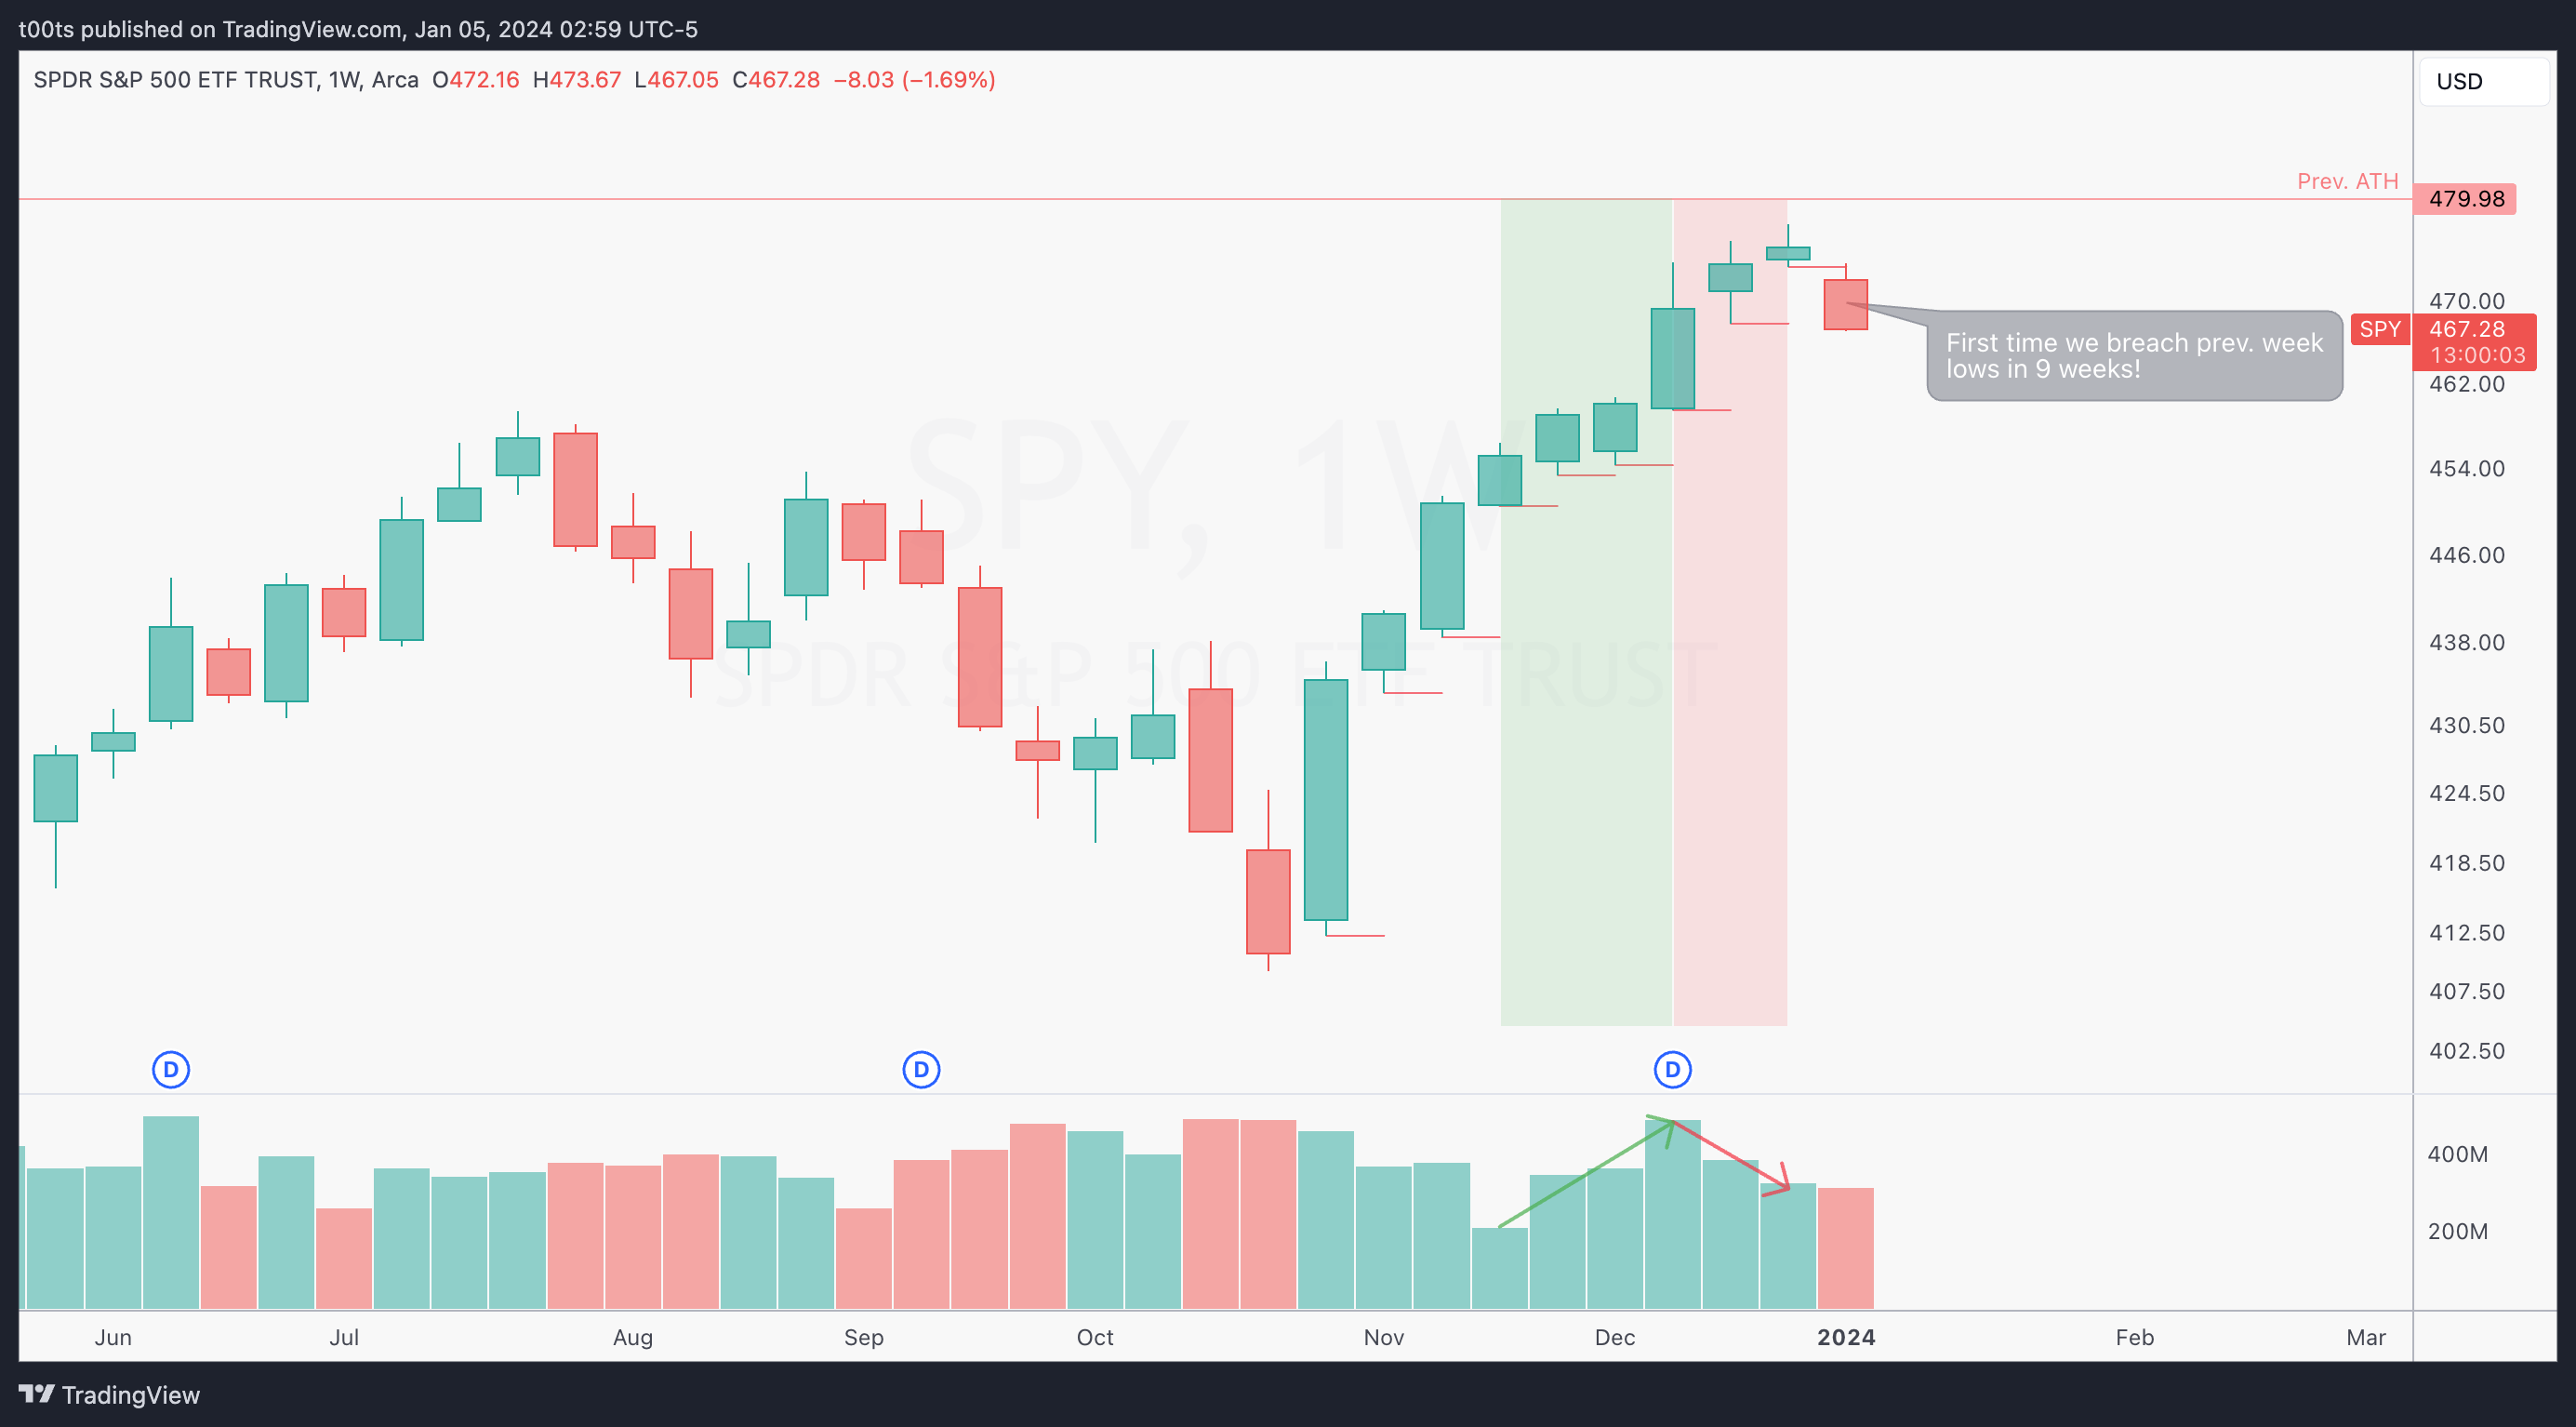
By now, everyone knows the market has been in melt-up mode for the past couple months, closing the year on a spectacularly strong note. Yet on the first trading day of 2024, SPY finally gapped down. For the first time in 9 weeks, it traded below the previous week low. It's worth noting that volume had been decreasing as we kept climbing up, but to be fair, those last weeks of the year are usually lower volume.
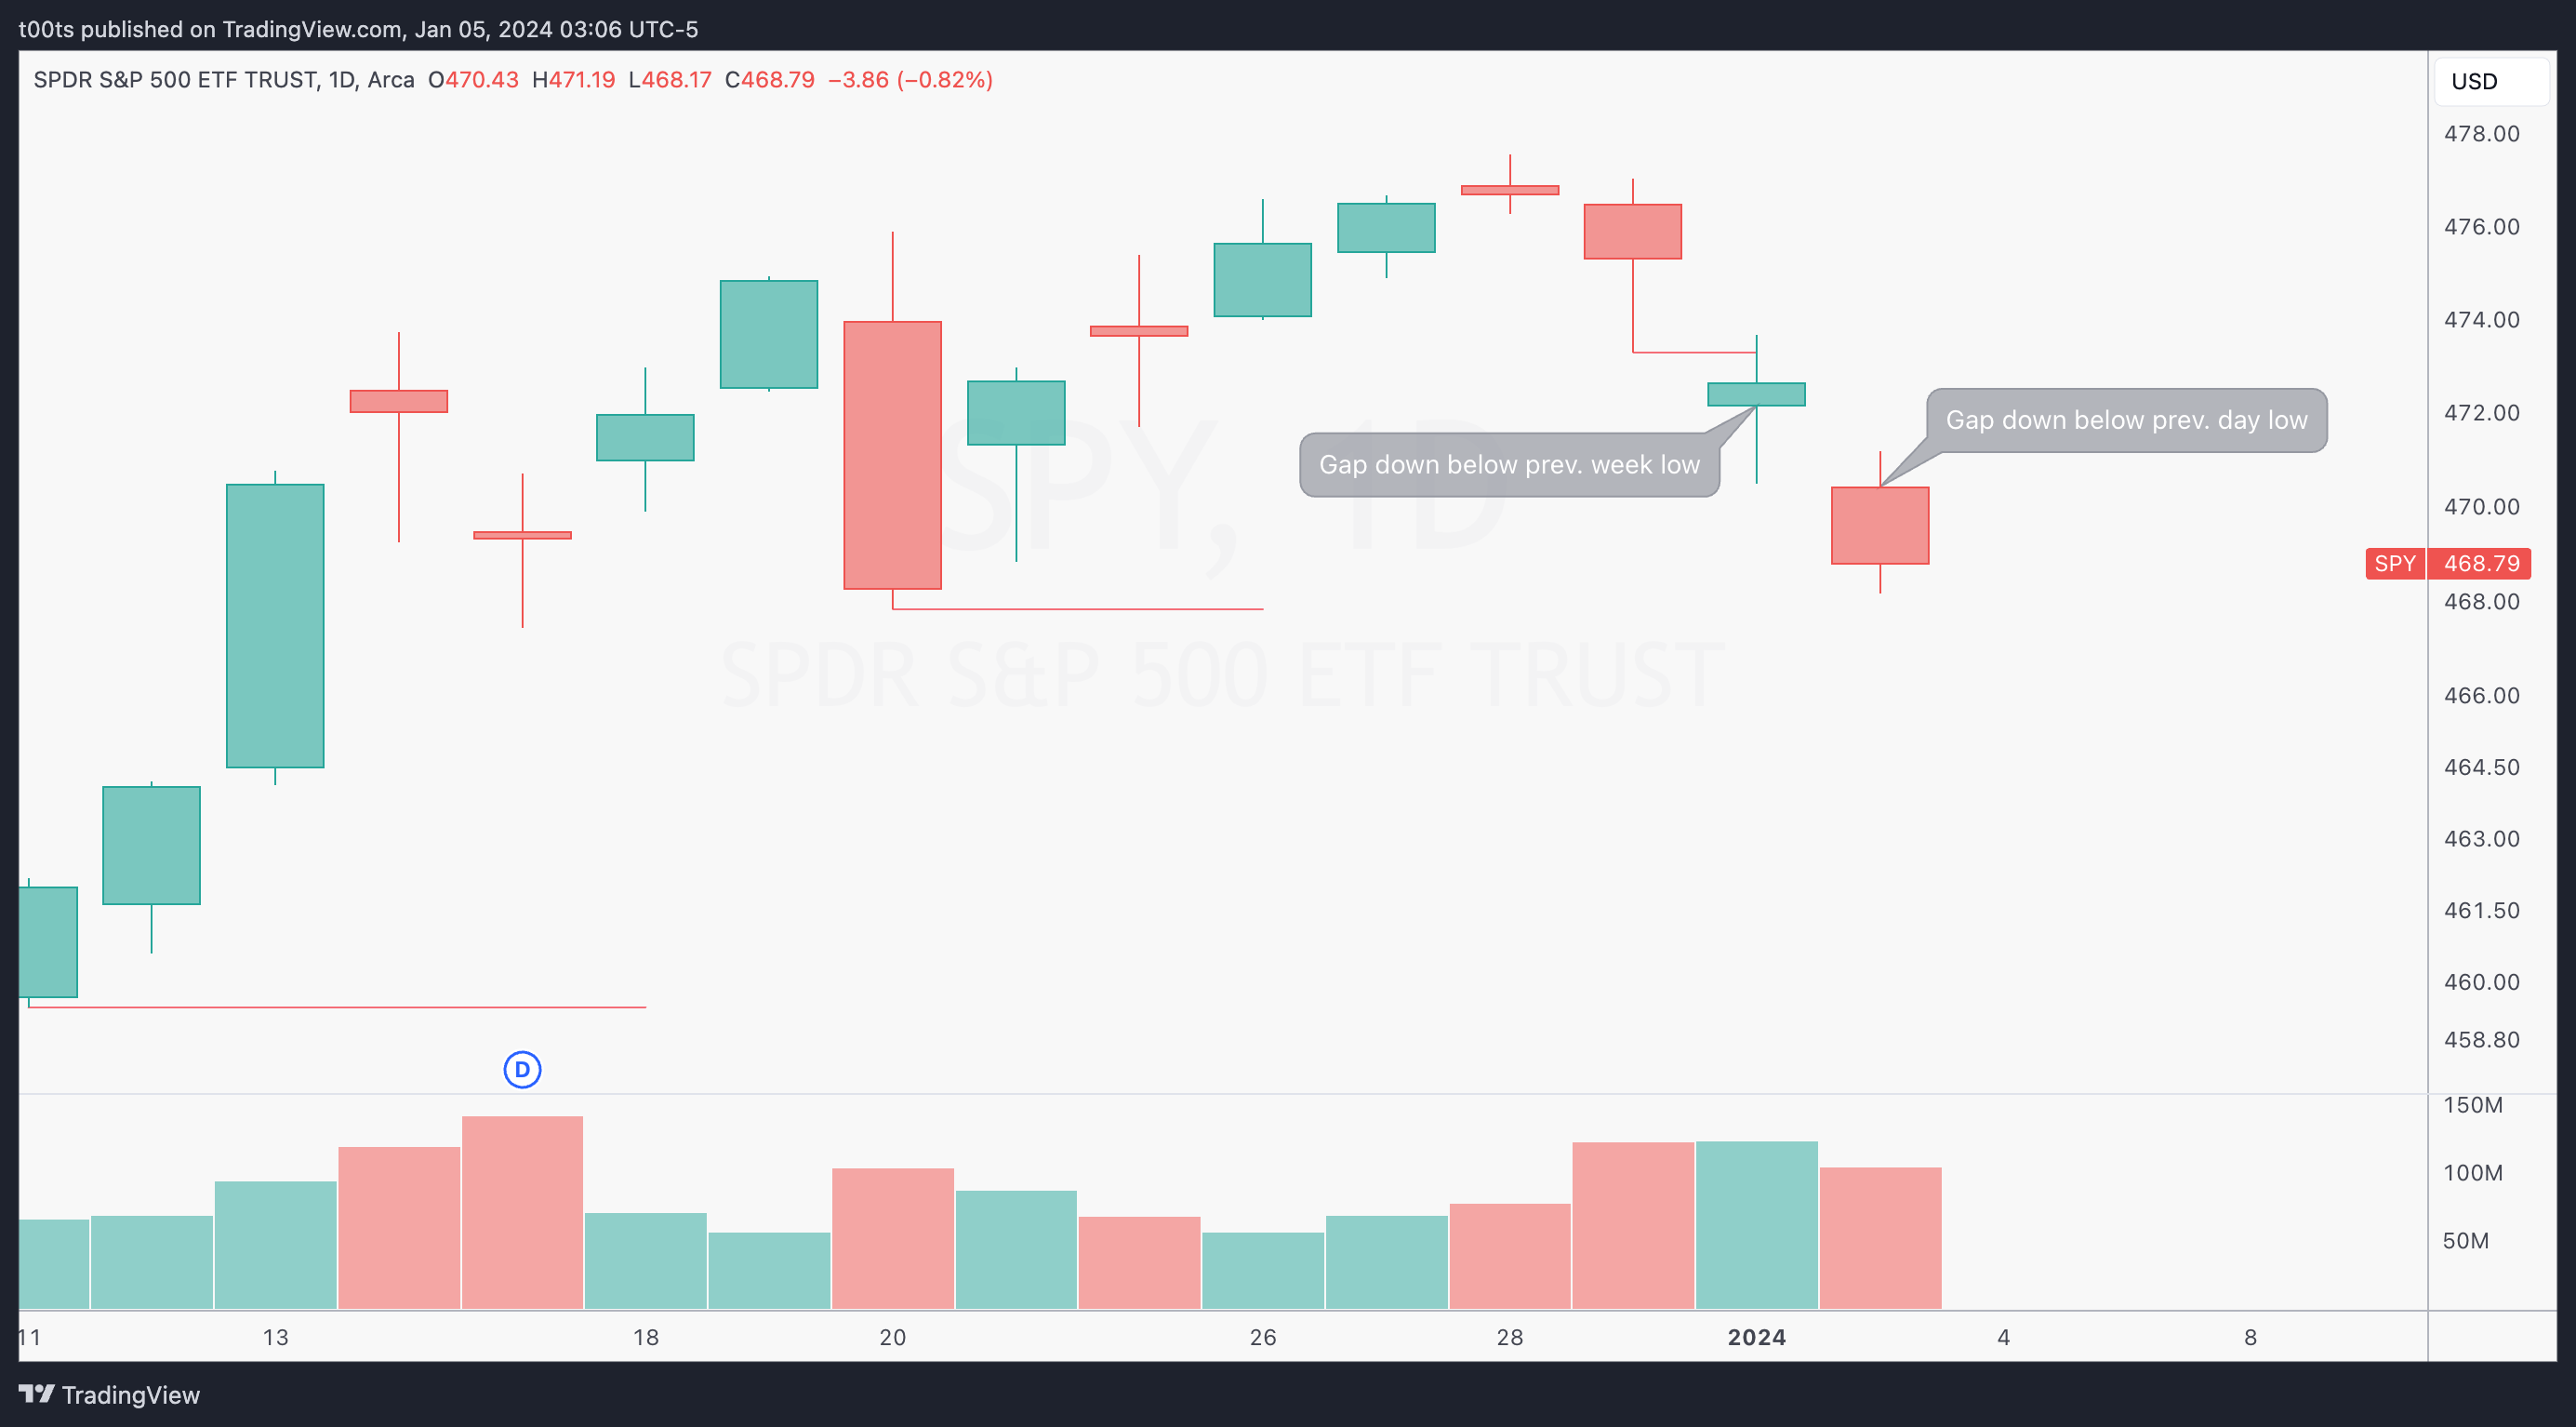
Coming into today, the daily chart shows two consecutive gap down days adding up to over 1% in losses. We haven't seen this in a while. Looks like bulls are tired and bears are taking control.
Weekly chart
Daily chart
Hourly chart
Here's where our bias for the day becomes more obvious. We clearly are in a short-term downtrend, thus we should be looking for shorts. Our key level of interest for shorts is that $470.95. We can observe a strong rejection yesterday, wiping out all the effort buyers had been putting in pretty much all day.
There's something that really stood out here to me, which was the lack of levels below current prices. There's nothing sitting between where we are right now and $464.18. That doesn't mean price can't reverse on our way down there, but the possibility of us trading down to the level is on the table if the trend resumes.

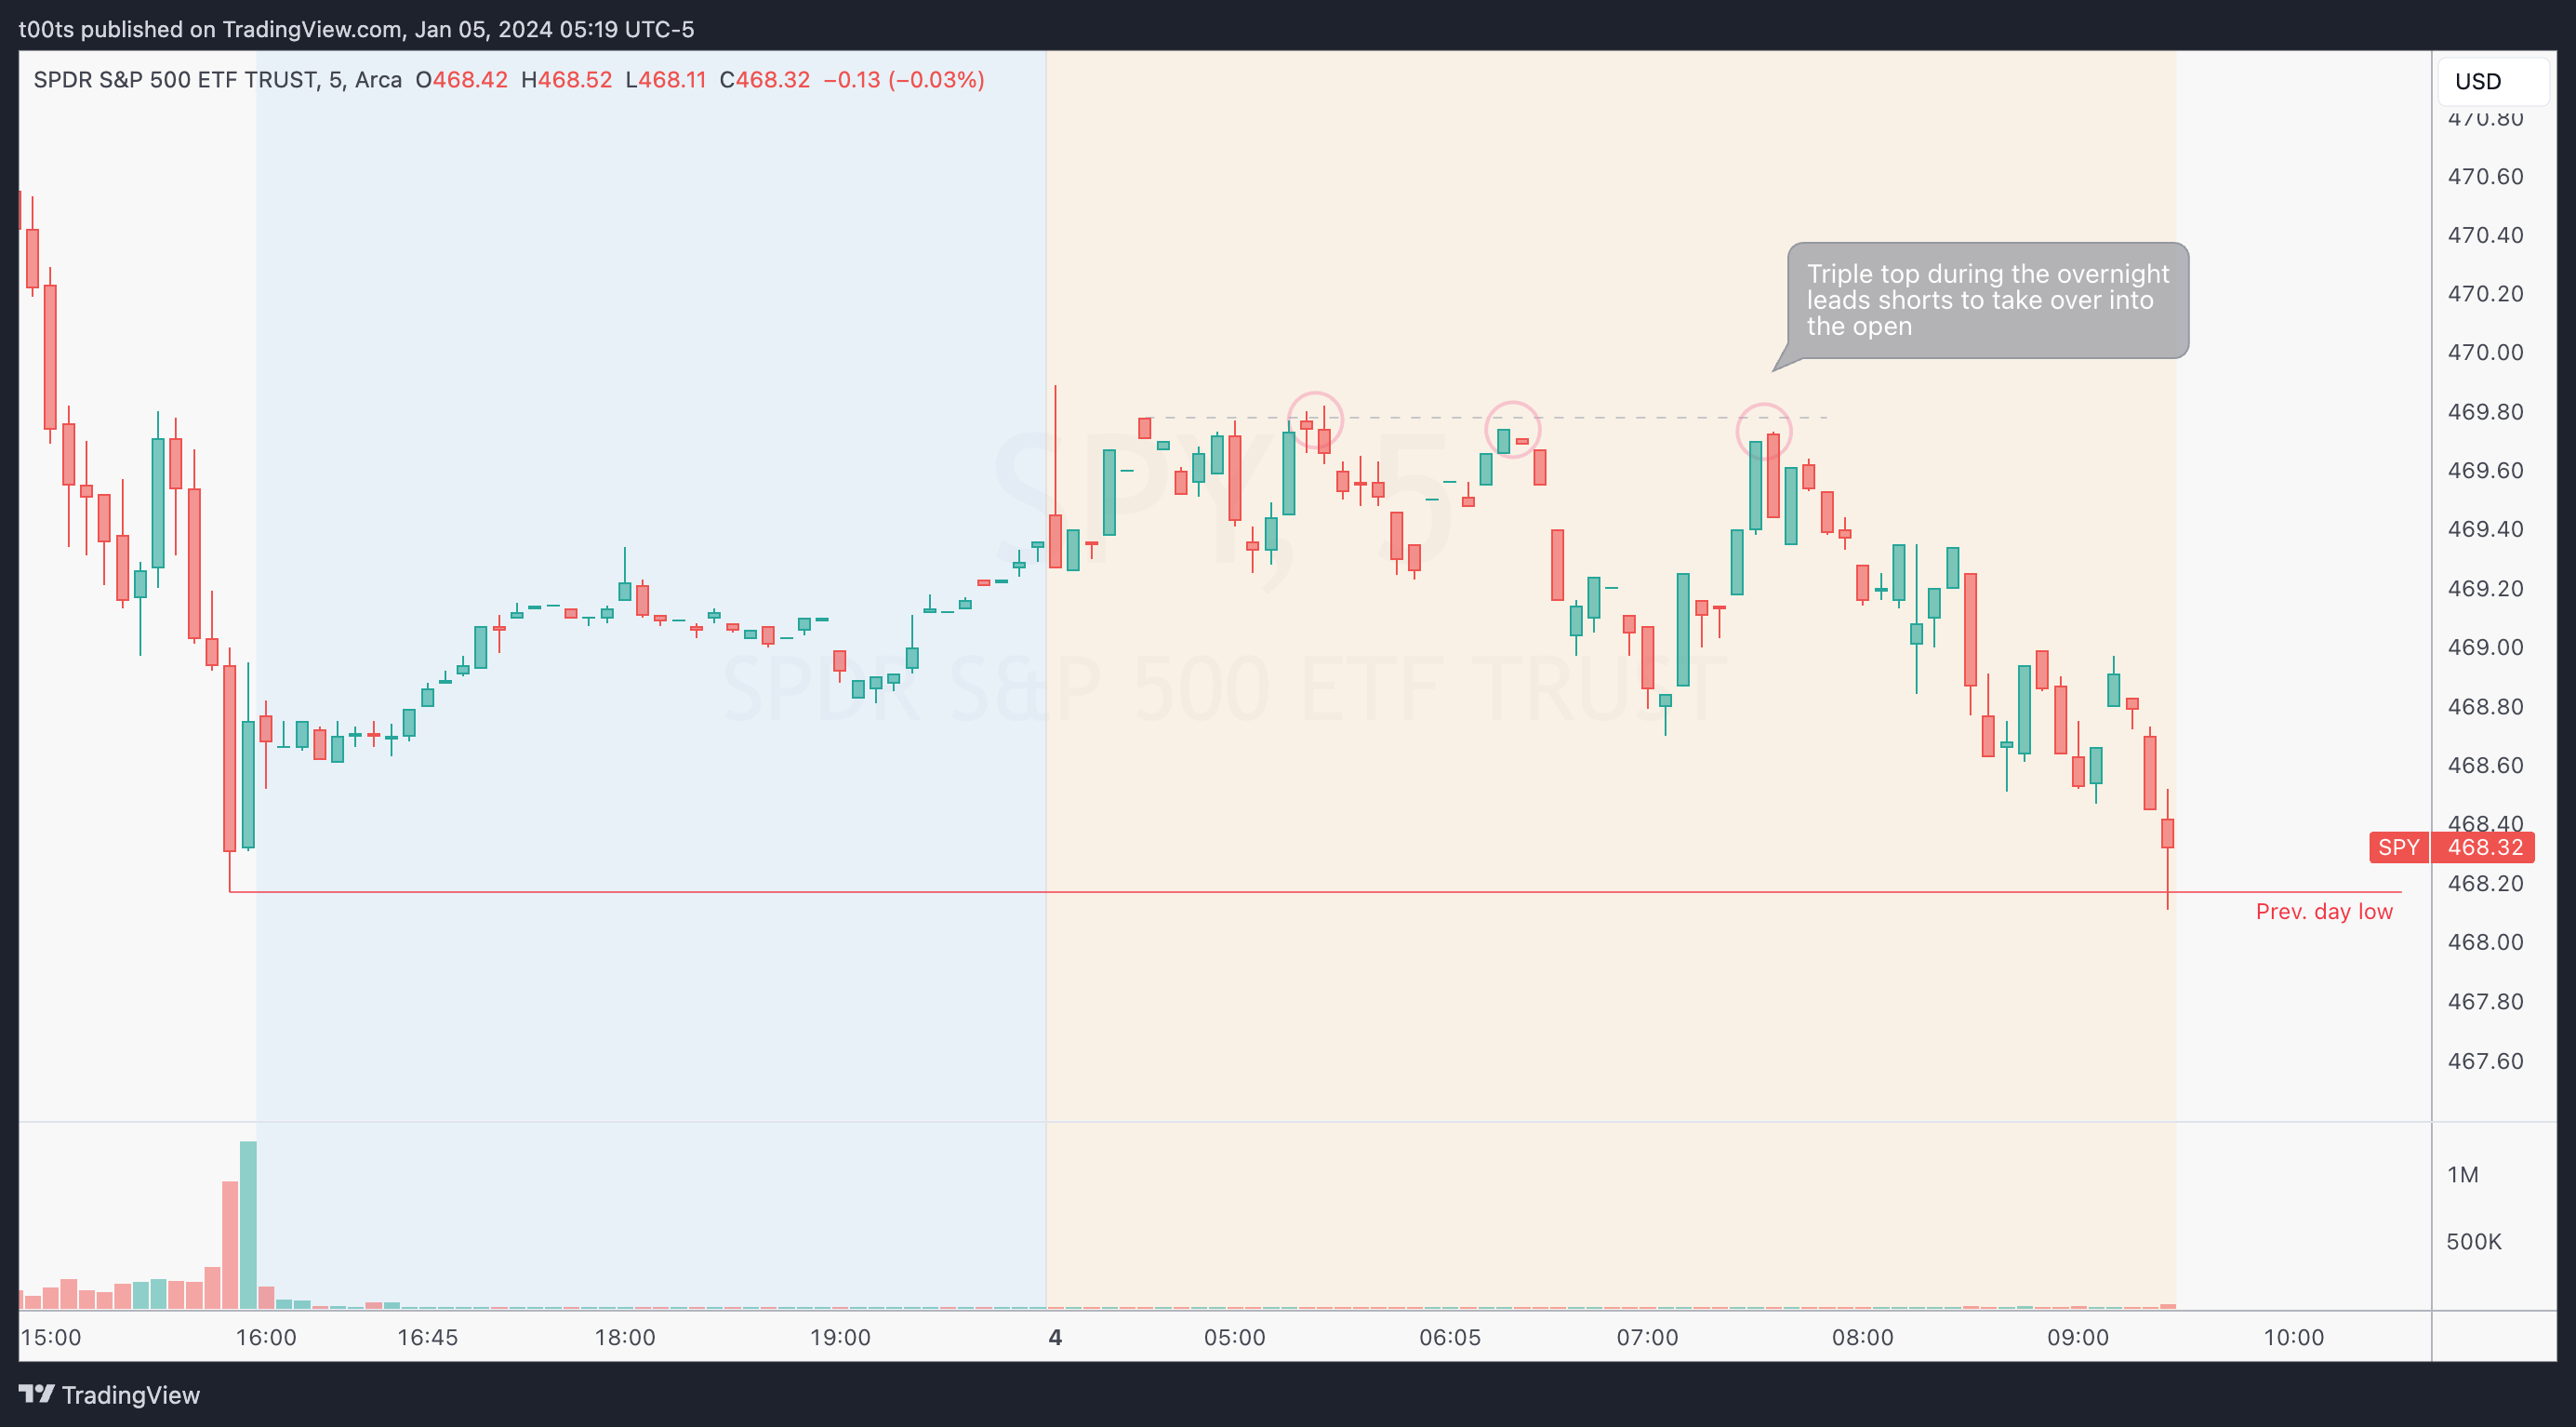
Pre-market action
SPY is set to open pretty much flat with respect to the previous day close. Price is trending down into the open as sellers have finally taken over and broke down the consolidation we've seen all night.
Given there's no levels nearby to trade off of, on these days we can make use of the previous day high/low and, of course, the price at which the stock opens. The choice isn't arbitrary, context matters. In this case, we're in a downtrend as we clearly observed using the hourly chart. This means we're expecting follow through to the downside if a bar's low is broken. So we'll keep an eye on that prev. day low.
The trade
By now we know we only take trades at levels. And today our levels are far, so we wait. We do nothing. That's what most great traders do most of the time anyways.
The day started with a failure to go lower right off the open. While this did allow for a long trade up to the level, we are going to focus on the short trade for now, which is the with trend trade. With trend trades are always more likely to succeed.
Which brings me to the question: How do I enter a counter-trend trades? The answer is simple, yet it cost me $1000s to learn: Wait for a second entry.
Side note: The counter-trend tag in my journal has historically been one of my most costly mistakes. Trying to find tops and bottoms is pointless and will lead to ruin.
So, as usual, let's use the CPT Framework:
Cue(s)
First weekly pullback in 9 weeks
Clear hourly downtrend
Intraday cue: Double top at our level of interest
Intraday cue: FTGH after the double top
Plan
Price has reached our level of interest. Look for a bearish reversal signal and, once confirmed, find a second entry to get involved in the short, risking HOD. Targets are the opening print and, eventually, $464.18.
Trigger
Price breaking the lows of the signal bar that gives us our bearish signal.
A quick note on psychology:
There's no plan until our cues are established.
There's nothing to plan for until everything listed above has happened. What I mean by this is that having a pre-market plan of “I will short if price reaches my $470.95 level” is fine as a reference, but you can't trade blindly off of that. SPY displayed a strong intraday uptrend up to that level after a failure to go lower at previous days lows.
If you're blindly jumping into a counter-trend trade just because we touch a level, more often than not you'll get run over. That will not only cause unnecessary losses, but will probably lead to tilt and revenge trading. The idea of shorting there is so burned in your head that you just want to prove yourself right and will keep trying until you make it or break it.
5m chart
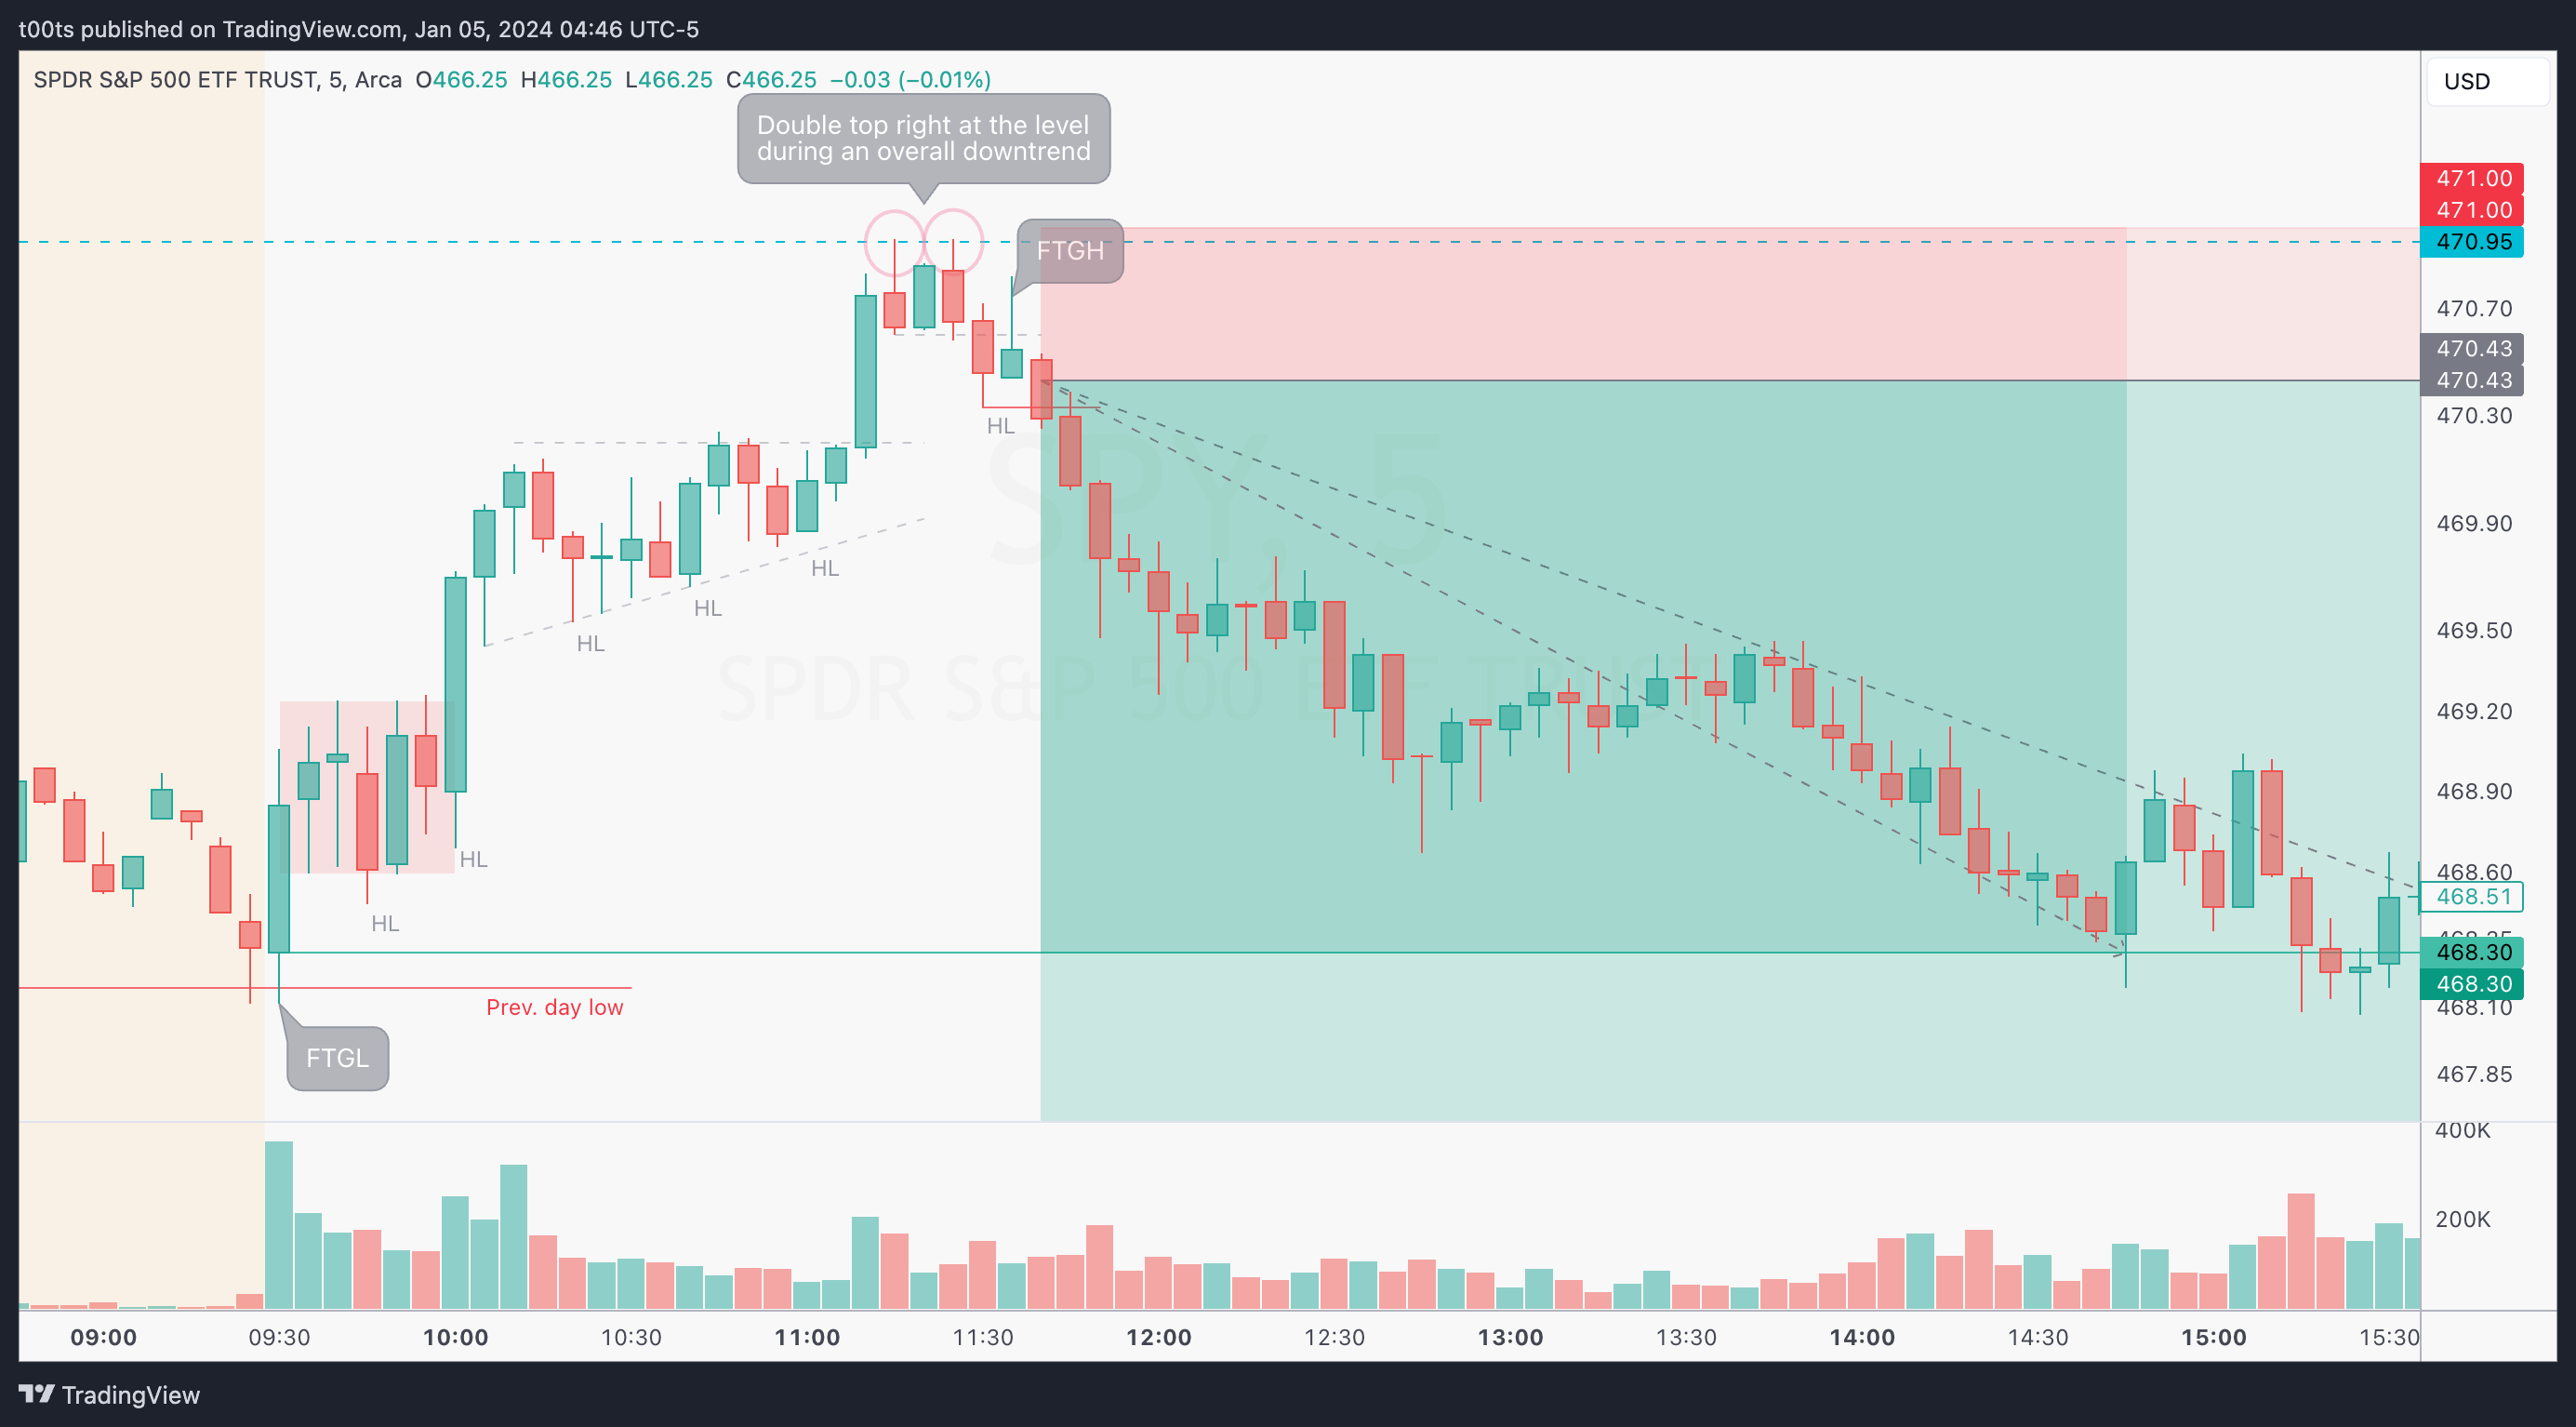
Notice how the entry is not on the double top. The 2m chart does give an early entry that allows for a massive risk-to-reward trade, but you'd be anticipating the double top before it's actually confirmed. While you can do that (and should if you've got your risk in check) I try to provide an analysis that's not based on us now being able to see what happened (e.g. hindsight bias).
The double top is confirmed the moment SPY prints that bearish trend bar that breaks the bottom of the range where the double top was formed. This is our first cue. The bearish reversal signal is confirmed. Now, we wait for our second entry. Anything that gives us a clue that sellers have really taken over and SPY is ready to resume the macro downtrend.
For those that have been reading this publication, you'll know I love to use failure patterns as cues and, in many cases, as the actual signal bar that triggers the entry. We got a beautiful failure to go higher when buyers failed to retake the double top neckline. At that point, you have everything you need to take the trade. Just wait for the trigger and go for it.
Closing notes
This was an absolute killer with trend opportunity to capitalize on the overall market weakness we're experiencing. The intraday downtrend remained intact for the rest of the day, leading into a very weak close. Taking partials at the opening print and maybe right before the bell was a reasonable thing to do, but given the lack of levels below, one should be planning to swing at least 1/3 of the initial position into the next day.
I am posting one trade writeup every day throughout 2024. I focus on large caps using levels and price action. The subscription is absolutely free and will always be. I will strive to provide value by offering clues and ideas for you to enhance your edge. Let’s grow together!