

Higher timeframe context
Yesterday we talked about how the weekly chart had broken out from a massive multi-month descending wedge and we're currently forming what's commonly known as a bull flag, which should lead us to a continuation move up. If you want to see the weekly chart in detail, check out yesterday's writeup.
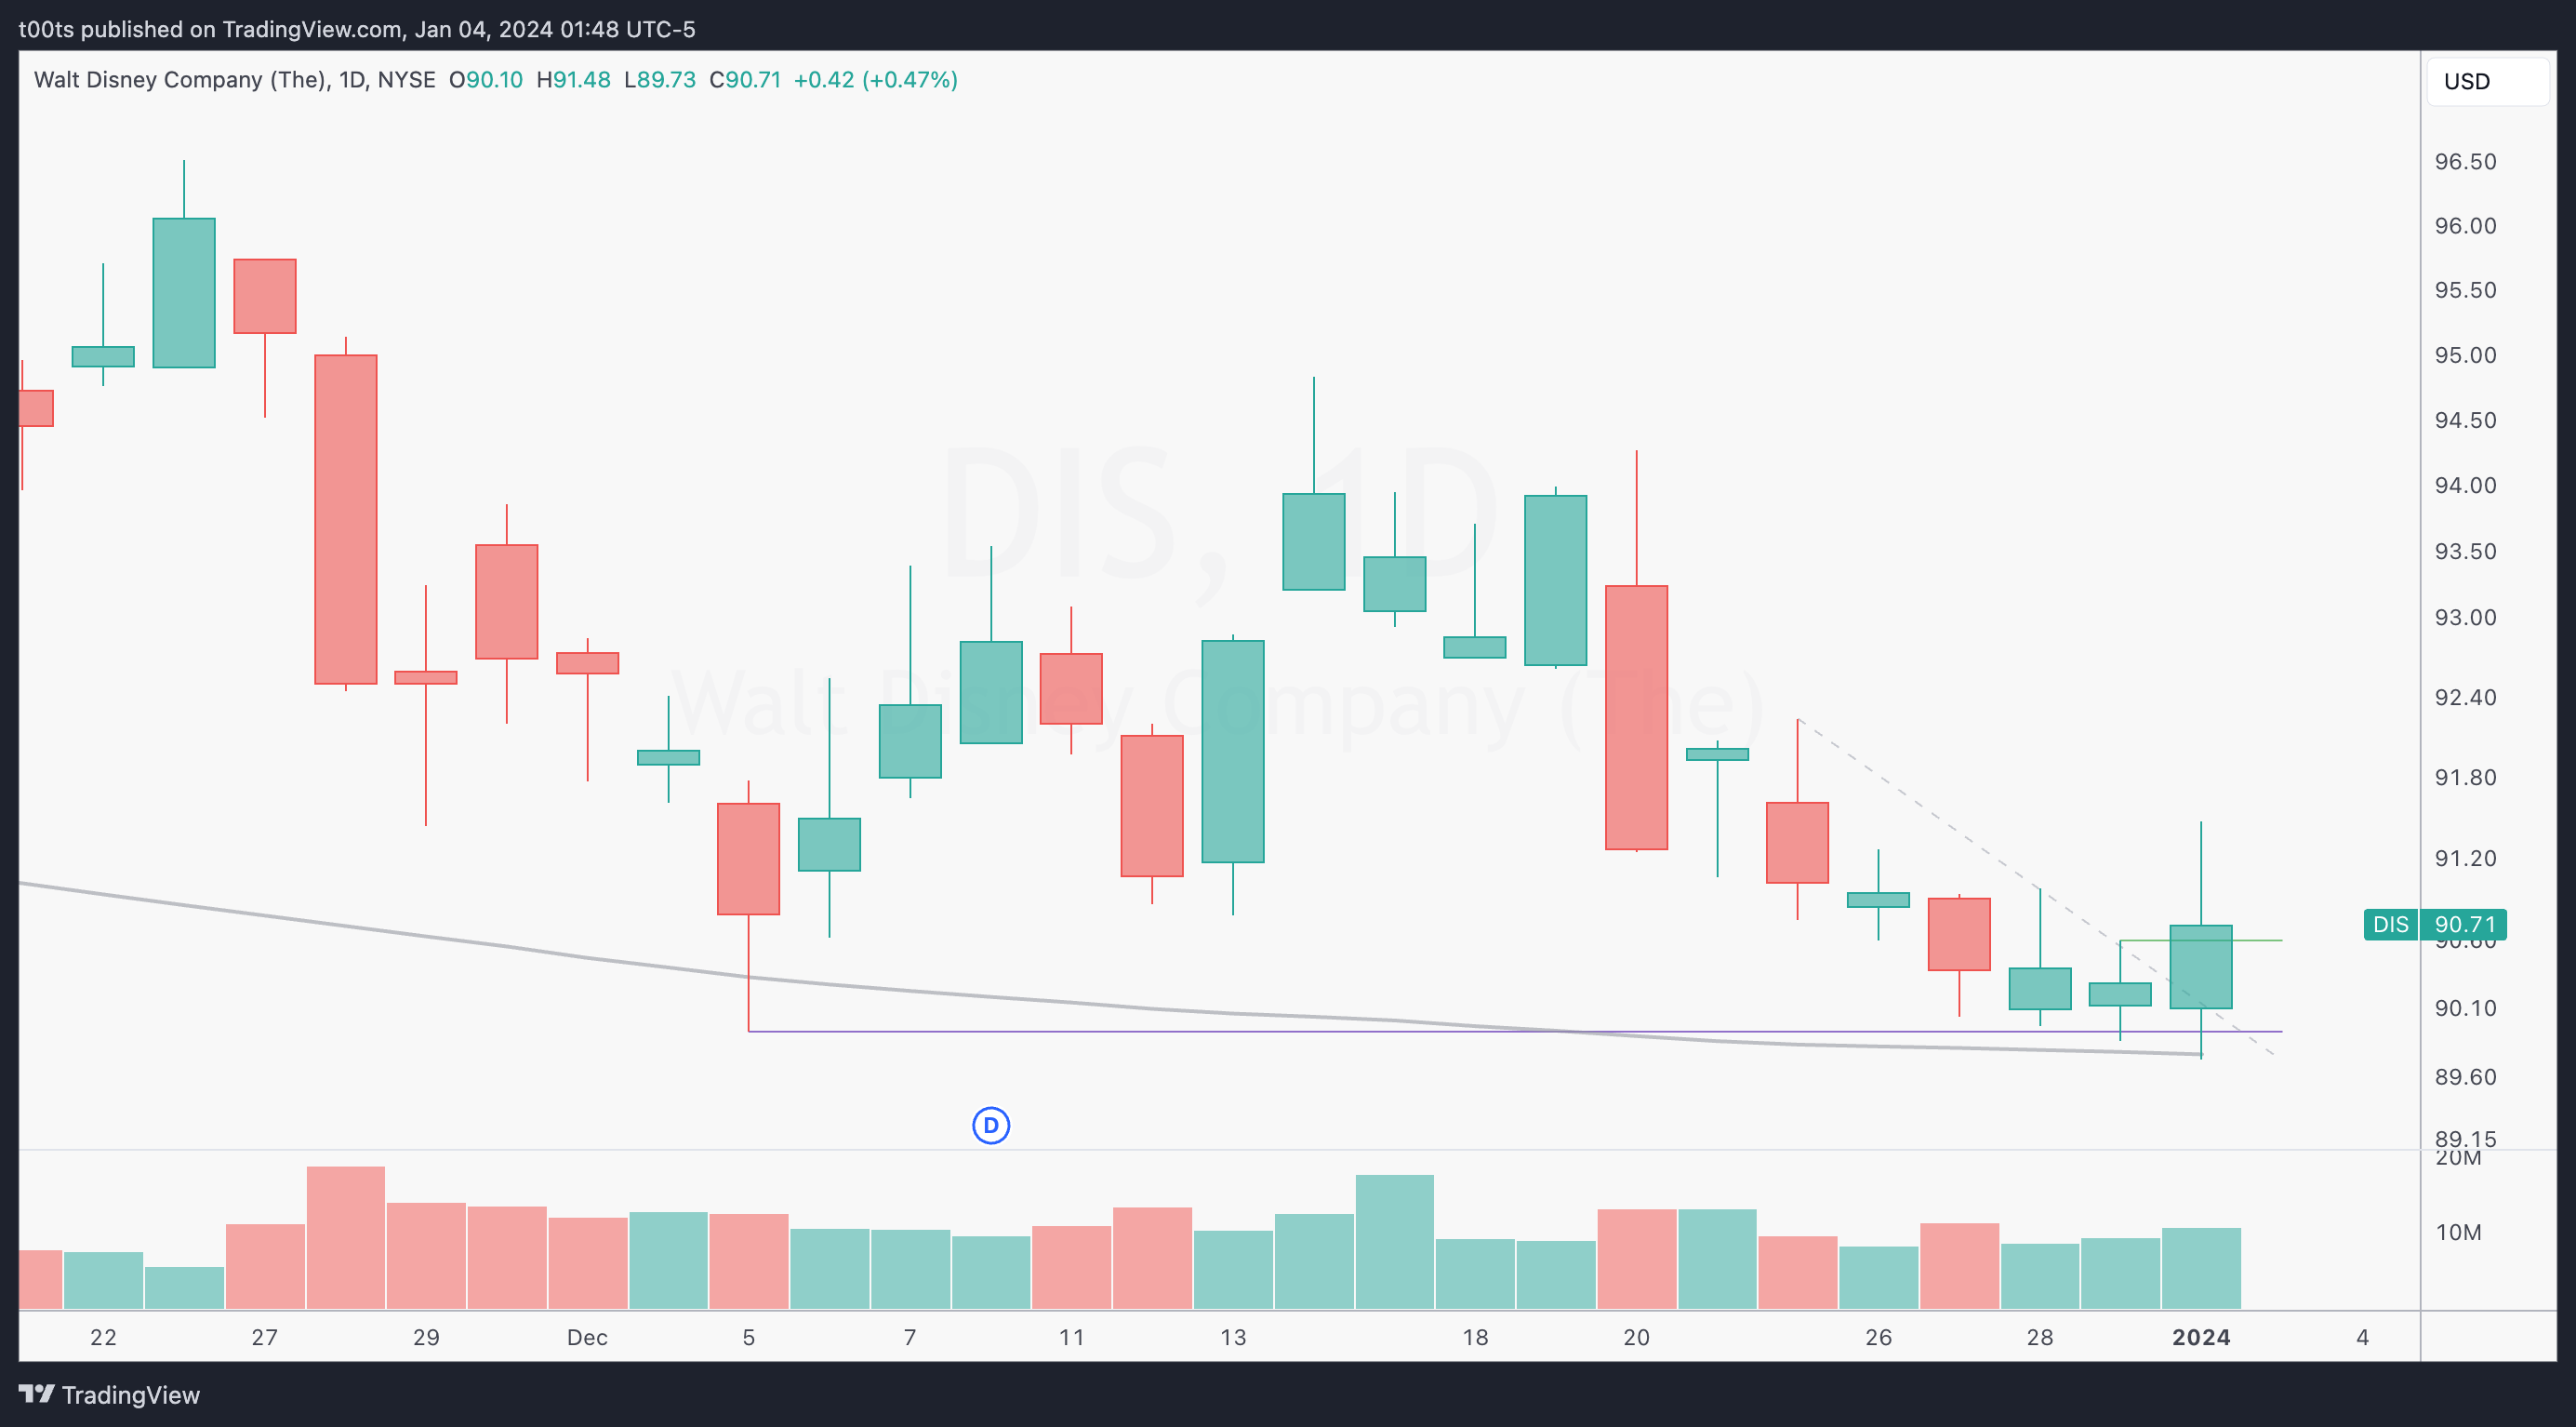
Going into today, I do believe there's a couple of details worth going over from the current daily chart. First off, we can see that yesterday we wicked below previous day's lows and bounced off the 200 moving average. In fact, if you recall from yesterday's writeup, this was exactly the intraday cue we used as confirmation to look for an entry. The second thing I thought was positive and led me to hold my full swing position was that price closed above previous day highs, breaking the downward gray trendline.
Daily chart
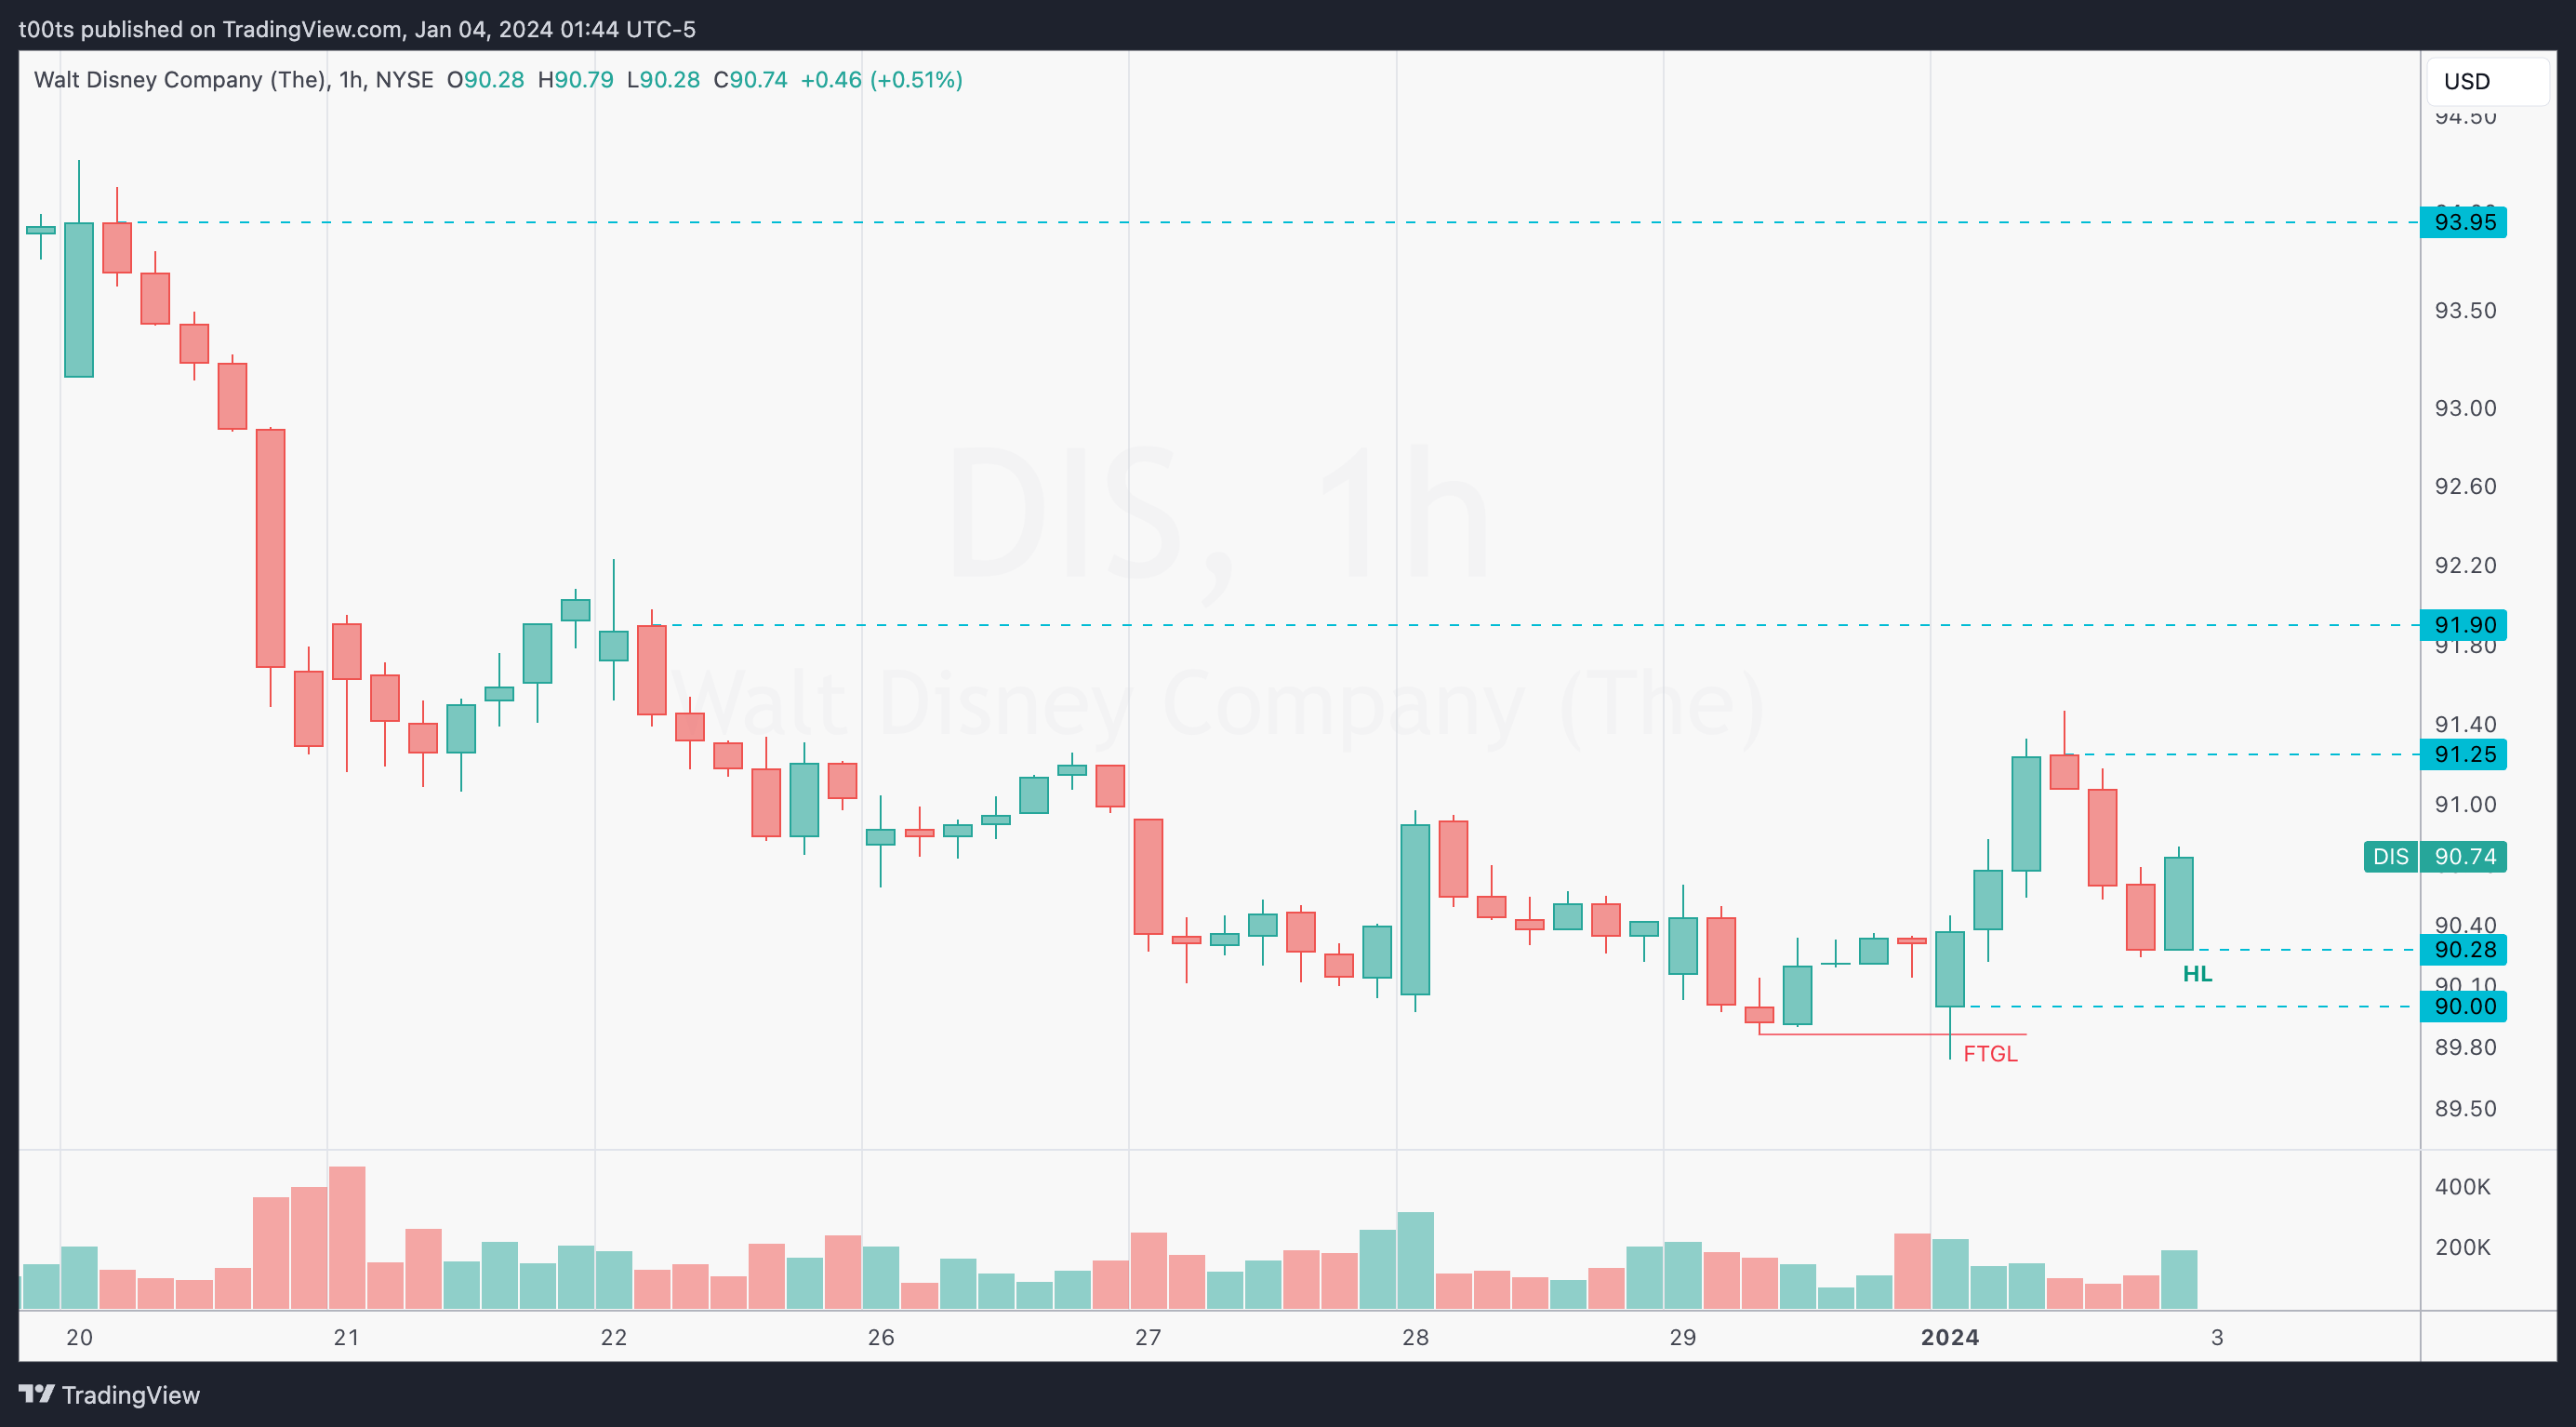
Hourly chart
Keeping it very simple here, the hourly chart shows two key things that are interesting going into the day. One we already saw on the daily chart, which is this clear failure to move lower when price traded below previous day lows. The second important detail is that, despite the harsh turn mid-day, price managed to close the day by printing a bullish engulfing trend bar while setting up a new higher low into tomorrow. These are all small clues that may seem mundane but offer key information for the avid trader.
Pre-market action
In this particular day, this stock was on watch for me given the context outlined in the previous post. It's not unusual to eye a setup on the macro timeframes and trade it intraday for a few days while it develops. I personally was swinging a position at this time, but even if I wasn't, Disney would still be on watch.
During most of the pre-market Disney (left) showed notable relative strength vs. the S&P (right). This was encouraging for bulls, until that last hour before the bell where sellers got nervous and started selling, giving up all prior gains and more.
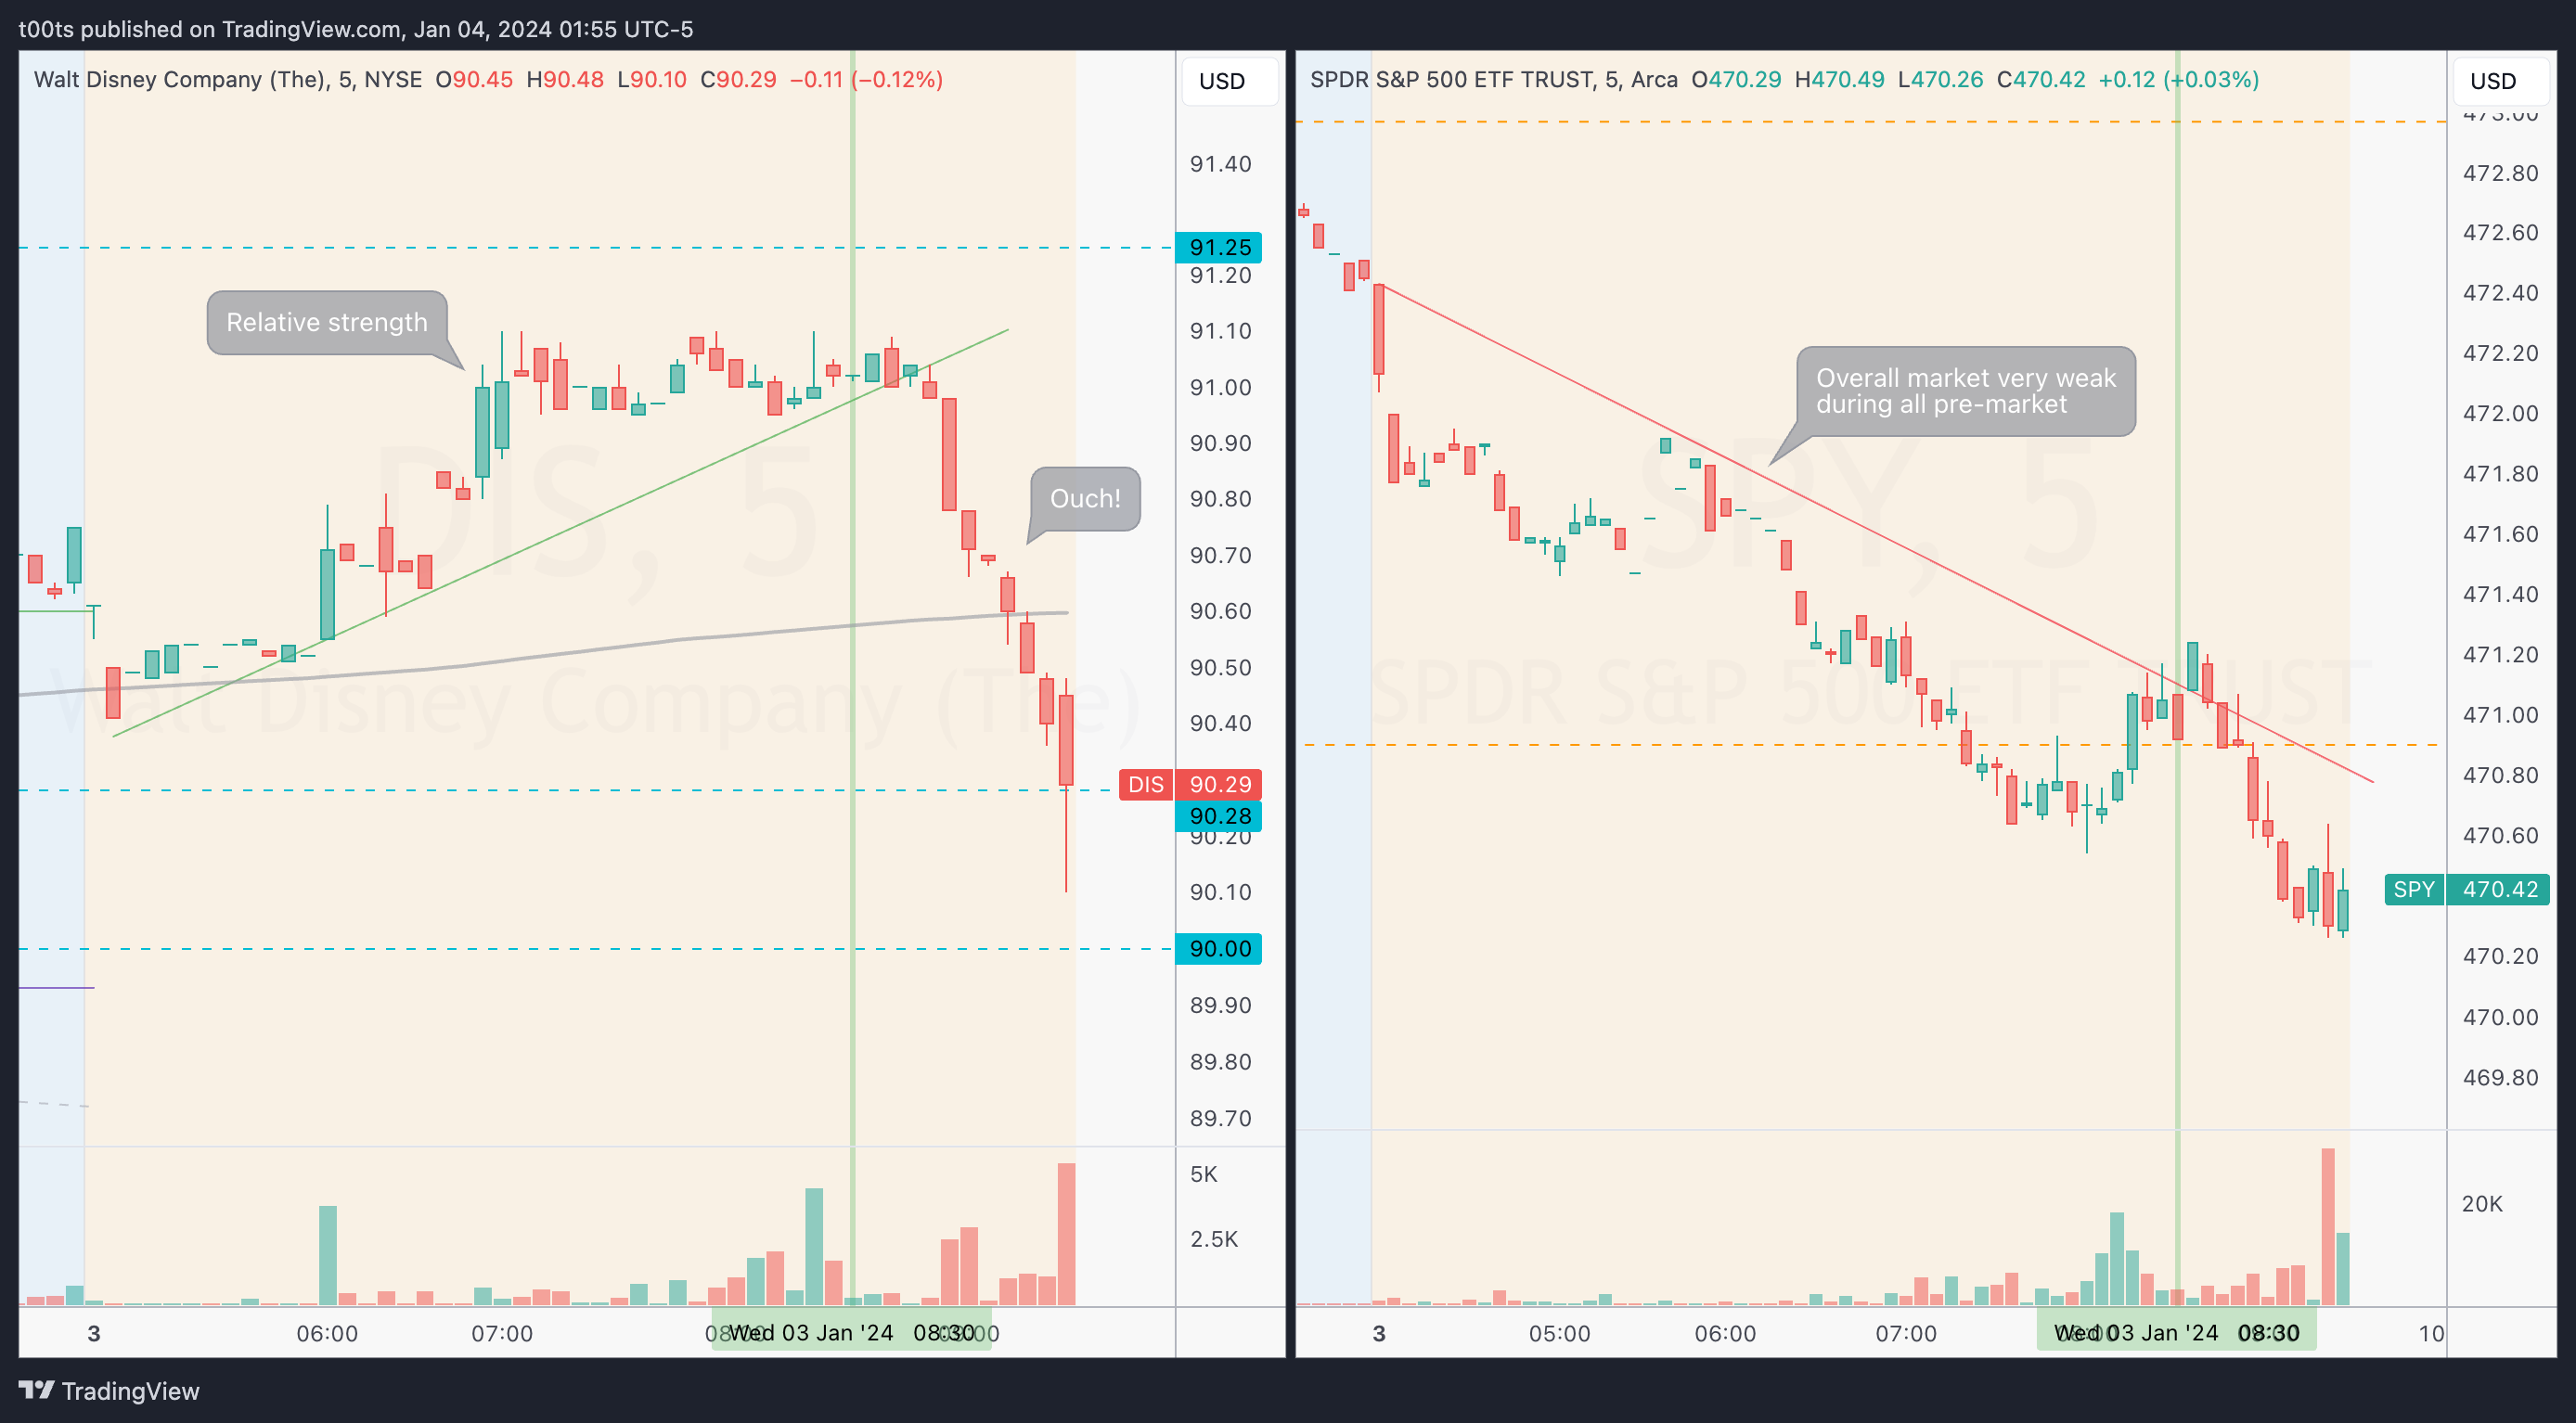
Around 10 minutes before the bell, I posted on 𝕏 that I'd be using the $90.28 level as reference to hold onto my current position or ditch it.
The trade
Once again, theme of this trade was patience and persistence. Disney gave another huge opportunity for those capable of not doing anything stupid in the meantime. The focus was set on our $90.28 level, and we just had to trade off of that if we could find a convincing signal bar. Levels above were $91.25 and $91.90.
So, as usual, let's use the CPT Framework:
Cue(s)
Weekly bullish structure
Daily chart at potential lows of pullback's second leg
Daily chart sitting on top of 200 SMA
FTGL on daily chart + Bullish hourly structure
Pre-market strength
Level holds the open
Intraday cue: FTGL with high volume at our key level
Plan
We've seen that right off the open bulls want to defend the $90.28 level. We're therefore interested in taking any trade that sets up off that level. So the plan is simple: Look for a good signal bar off (or near) that level and, if the entry is triggered, risk its lows.
Trigger
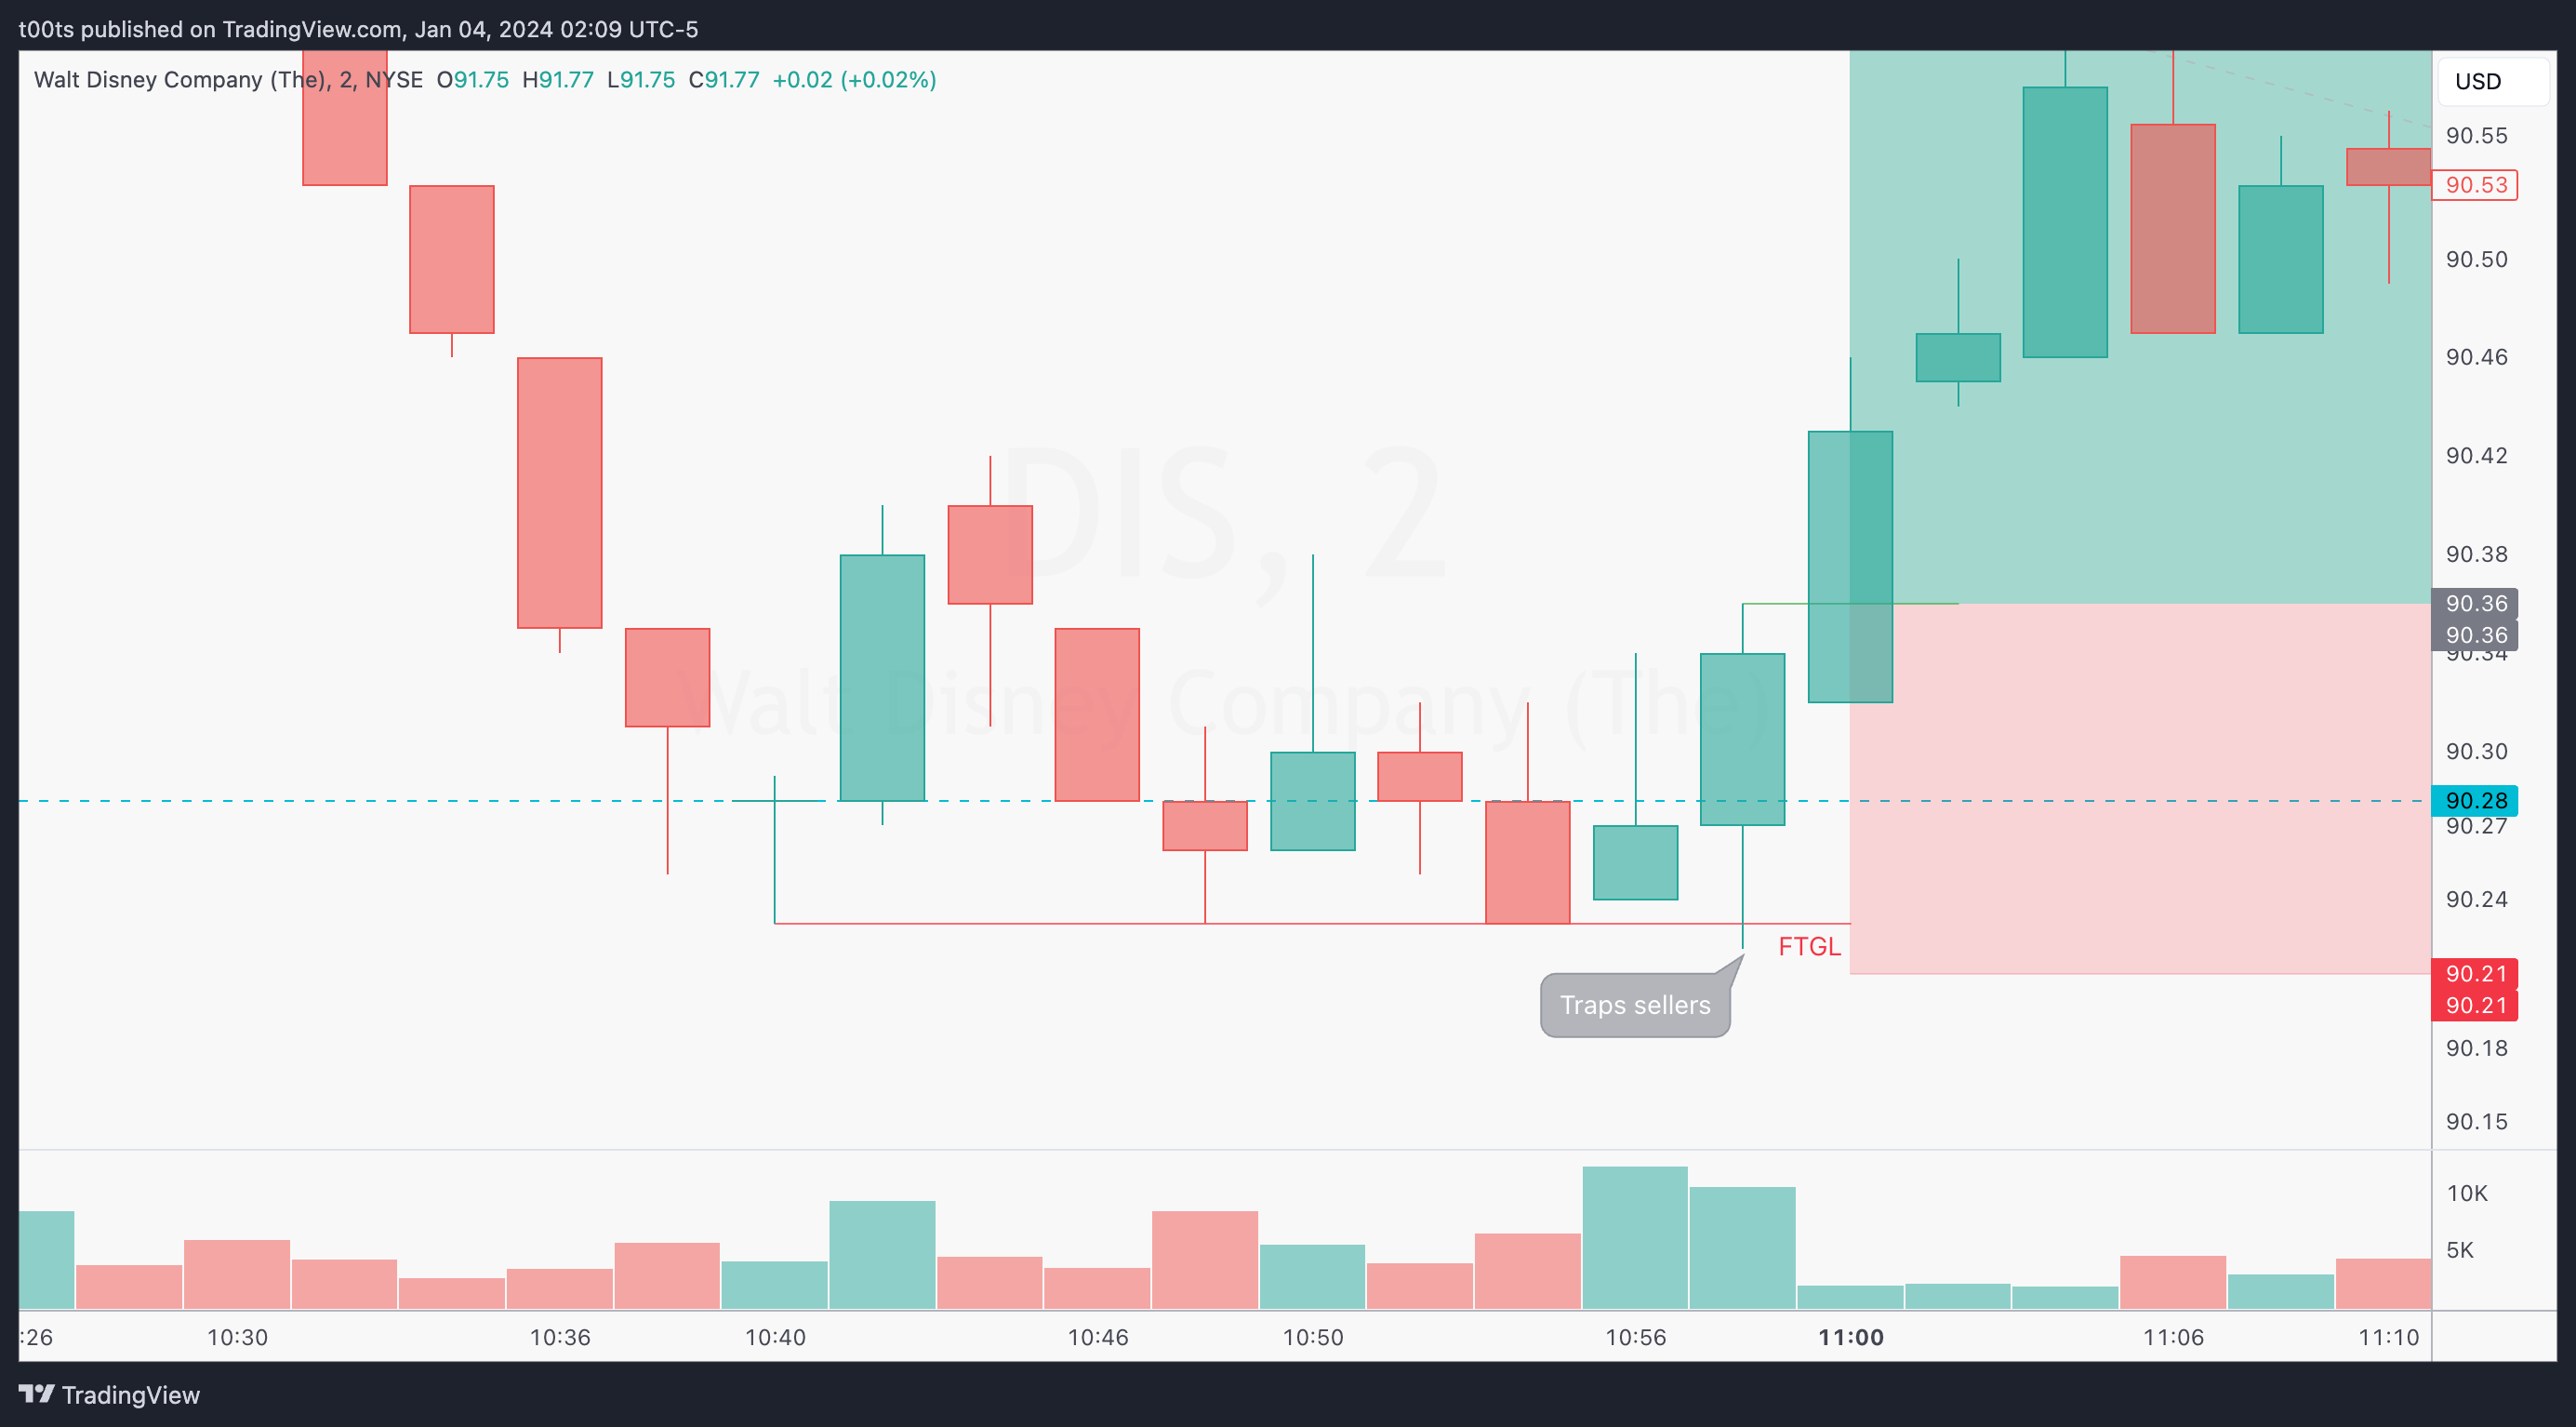
Price breaking the highs of the signal bar. In this case, the 5m FTGL bar shown on the chart below, which traps sellers and doubles the volume of the previous few bars.
5m chart
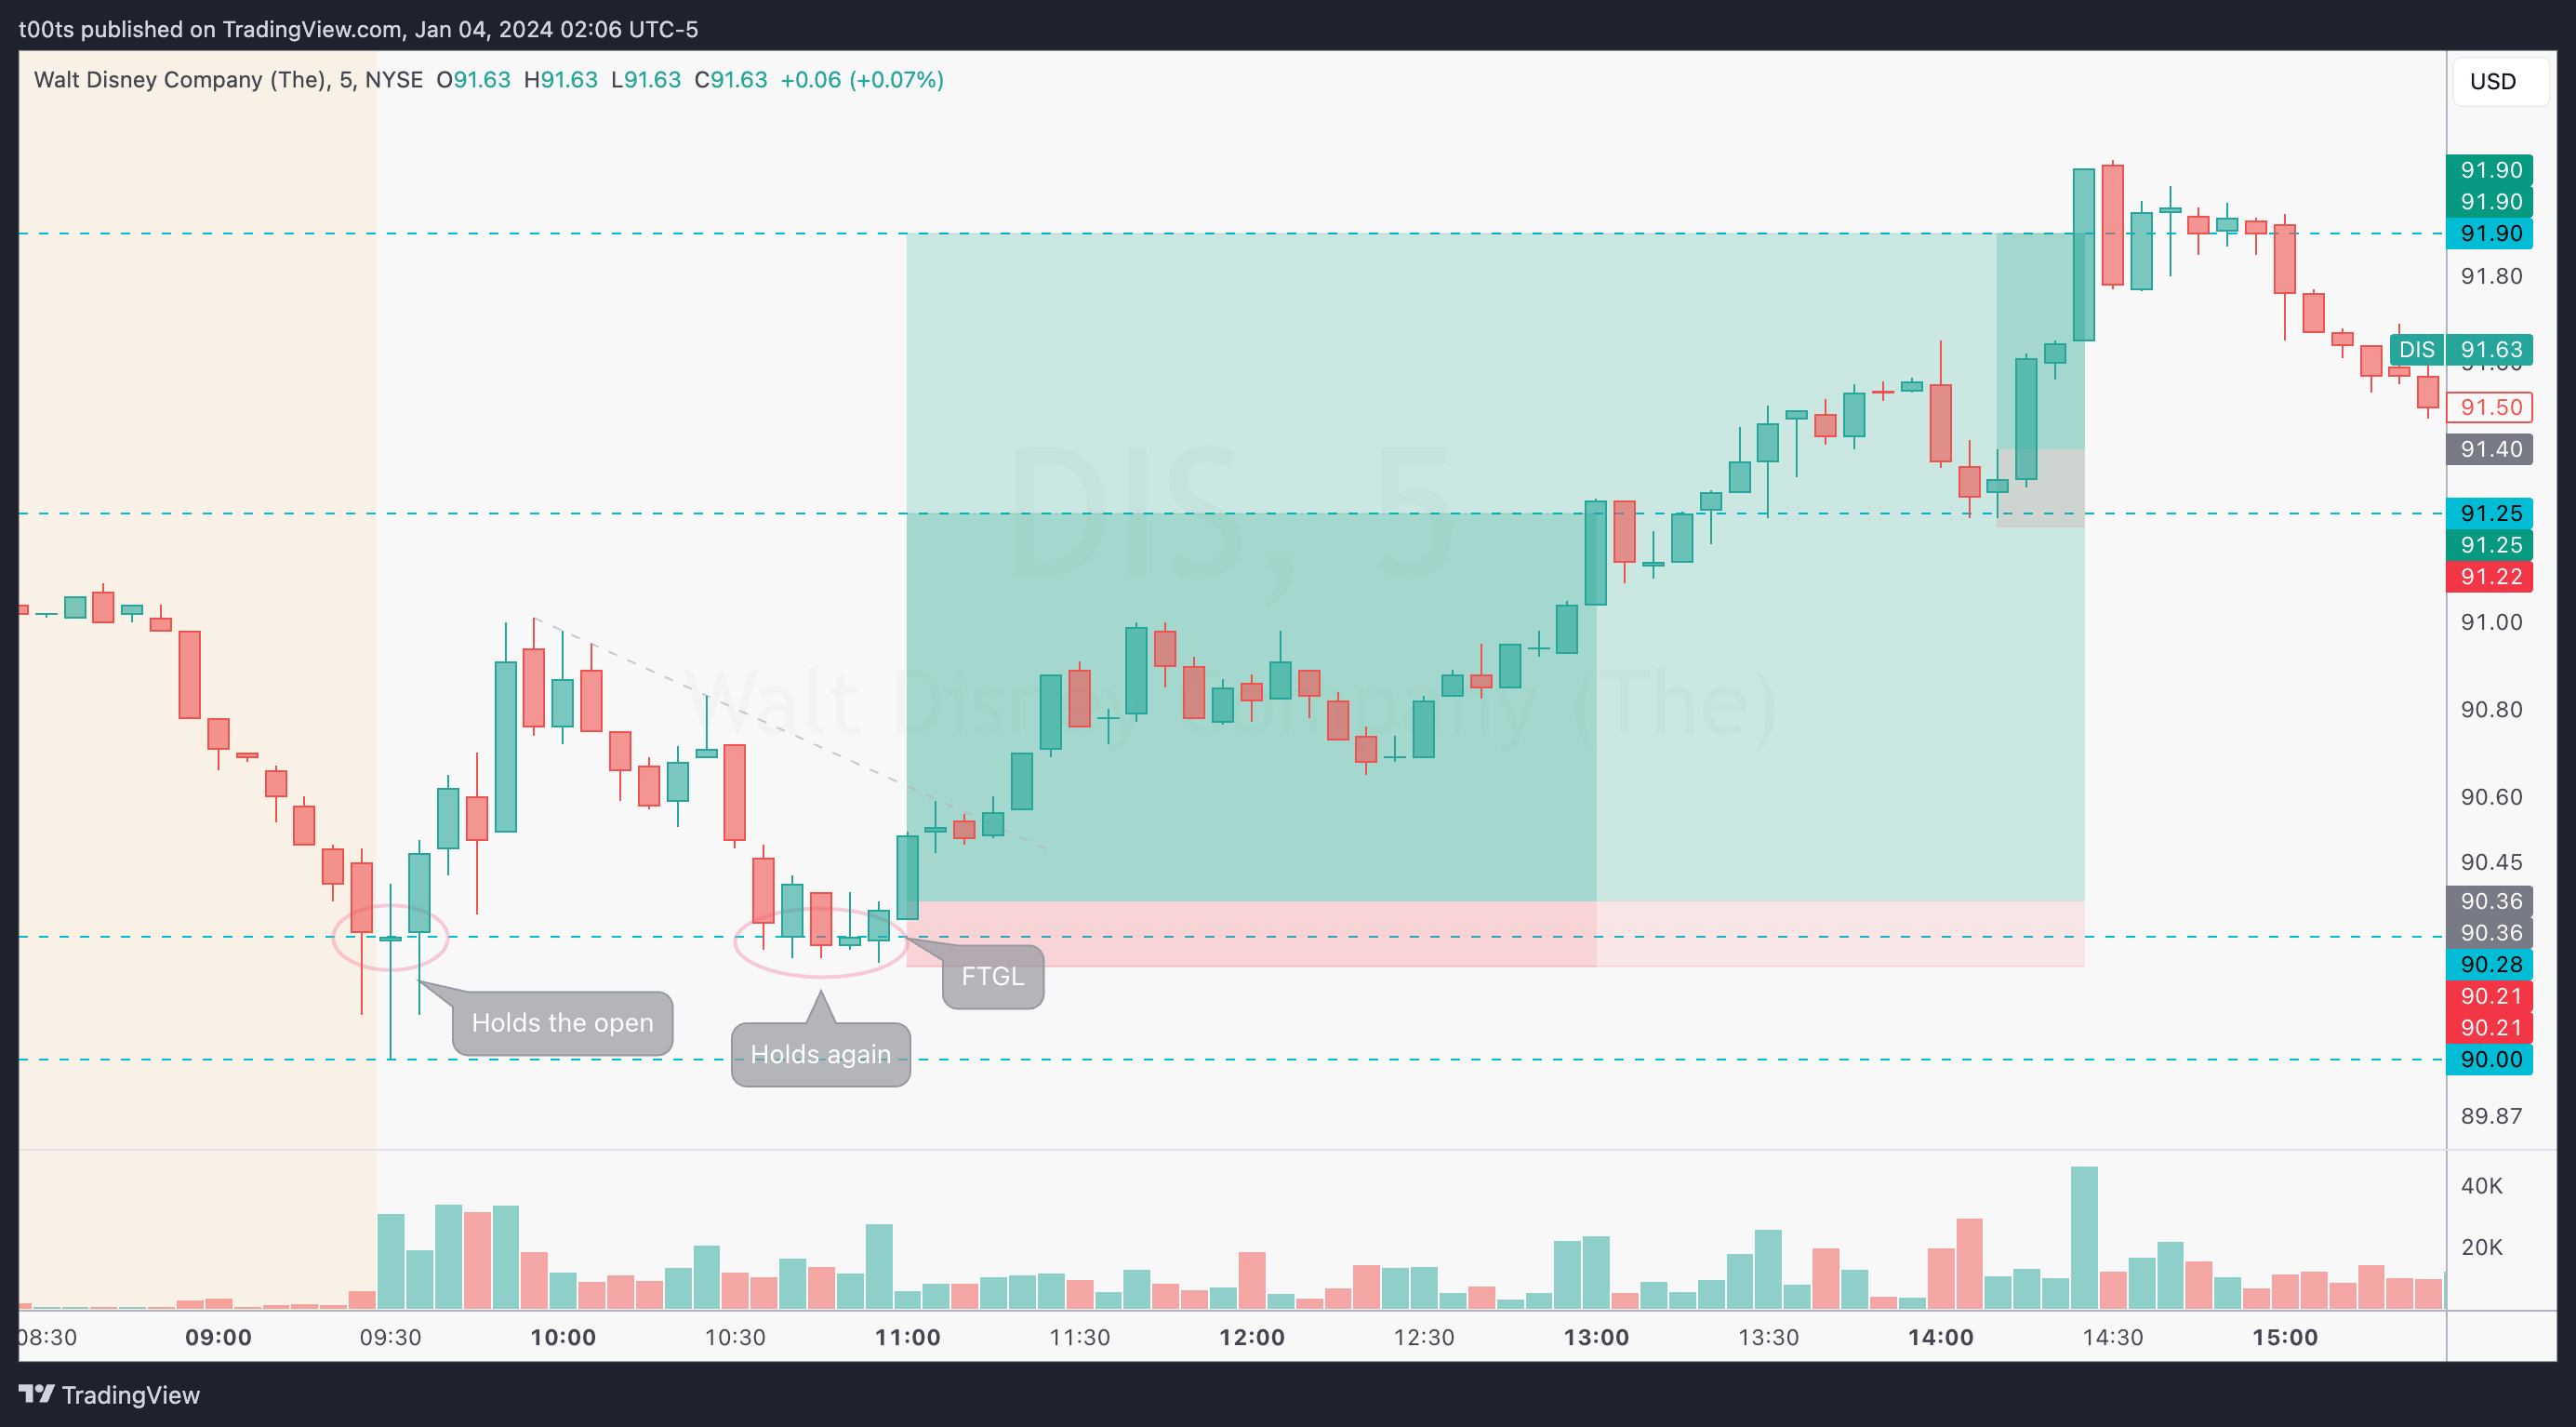
Notice how clean the entry was. A lot of shorts jumped in on the break of that inverse hammer right before our signal bar. When buyers take over, they're trapped, which explains why we broke out and finally trended to the next two levels. These trades offered 6R and 10R respectively. This is the kind of trade we like and consistently look for. Clear entries with high risk-to-reward.
For the sake of completeness, the first green bar on the second consolidation also fails to go lower, but the highs are never breached, so the buy setup is never triggered. That's why we don't anticipate entries. It's rarely worth the stress.
2m chart (FTGL in detail)
What happened with my swing?
I actually held through this action and took profits at 3pm EST, when the $91.90 level failed. At that time, SPY was again melting down after an apparent post-JOLTS recovery, so I decided to leave. I was already max'ed out in terms of position size, so couldn't afford to add to it, but that weren’t the case, the entries highlighted on the 5m chart above would've been great add points.
Closing notes
Two days in a row, Disney offered ~10R setups. So essentially, for every $1 you put to risk, you can make $10. That's exactly what we'll be looking for and going over on these daily write-ups. In this particular case, the key was to identify the higher timeframe setup and patiently wait for an entry. We had so many cues and such a great risk-to-reward ratio that this trade allowed for moderately large size. If the market was aligned and strong, it was definitely an A+ setup.
I am posting one trade writeup every day throughout 2024. I focus on large caps using levels and price action. The subscription is absolutely free and will always be. I will strive to provide value by offering clues and ideas for you to enhance your edge. Let’s grow together!