
Alibaba (BABA) - Feb 21st 2024
It's worth paying attention to low-beta names on choppy days

Higher timeframe context
We had an interesting day ahead, with FOMC minutes to be released in the afternoon and NVIDIA earnings after the close.
FOMC minutes are essentially a detailed log of the FOMC meeting that took place 3 weeks prior. Honestly, sometimes market reacts, but most of the times it doesn't. Investors get access to detailed insights about each individual member's stance on the matters discussed, but the bottom line doesn't change.
With respect to NVIDA earnings, there was so just too much hype... There's a feeling of NVDA carrying the market on its shoulders, and given the recent (much needed) pullback, there was some fear NVIDIA might fail to keep up with expectations.
These two events resulted in a choppy session for most high-beta names, as investors awaited the minutes release and further announcement from NVIDIA.
BABA (Alibaba.com), a Chinese company, was gapping up nicely in the pre-market. I saw the gap up and honestly decided to pass on it in favour of other setups that didn't get much follow-through. Big mistake. So here's my review so I hopefully I won't ignore it next time.
Weekly chart
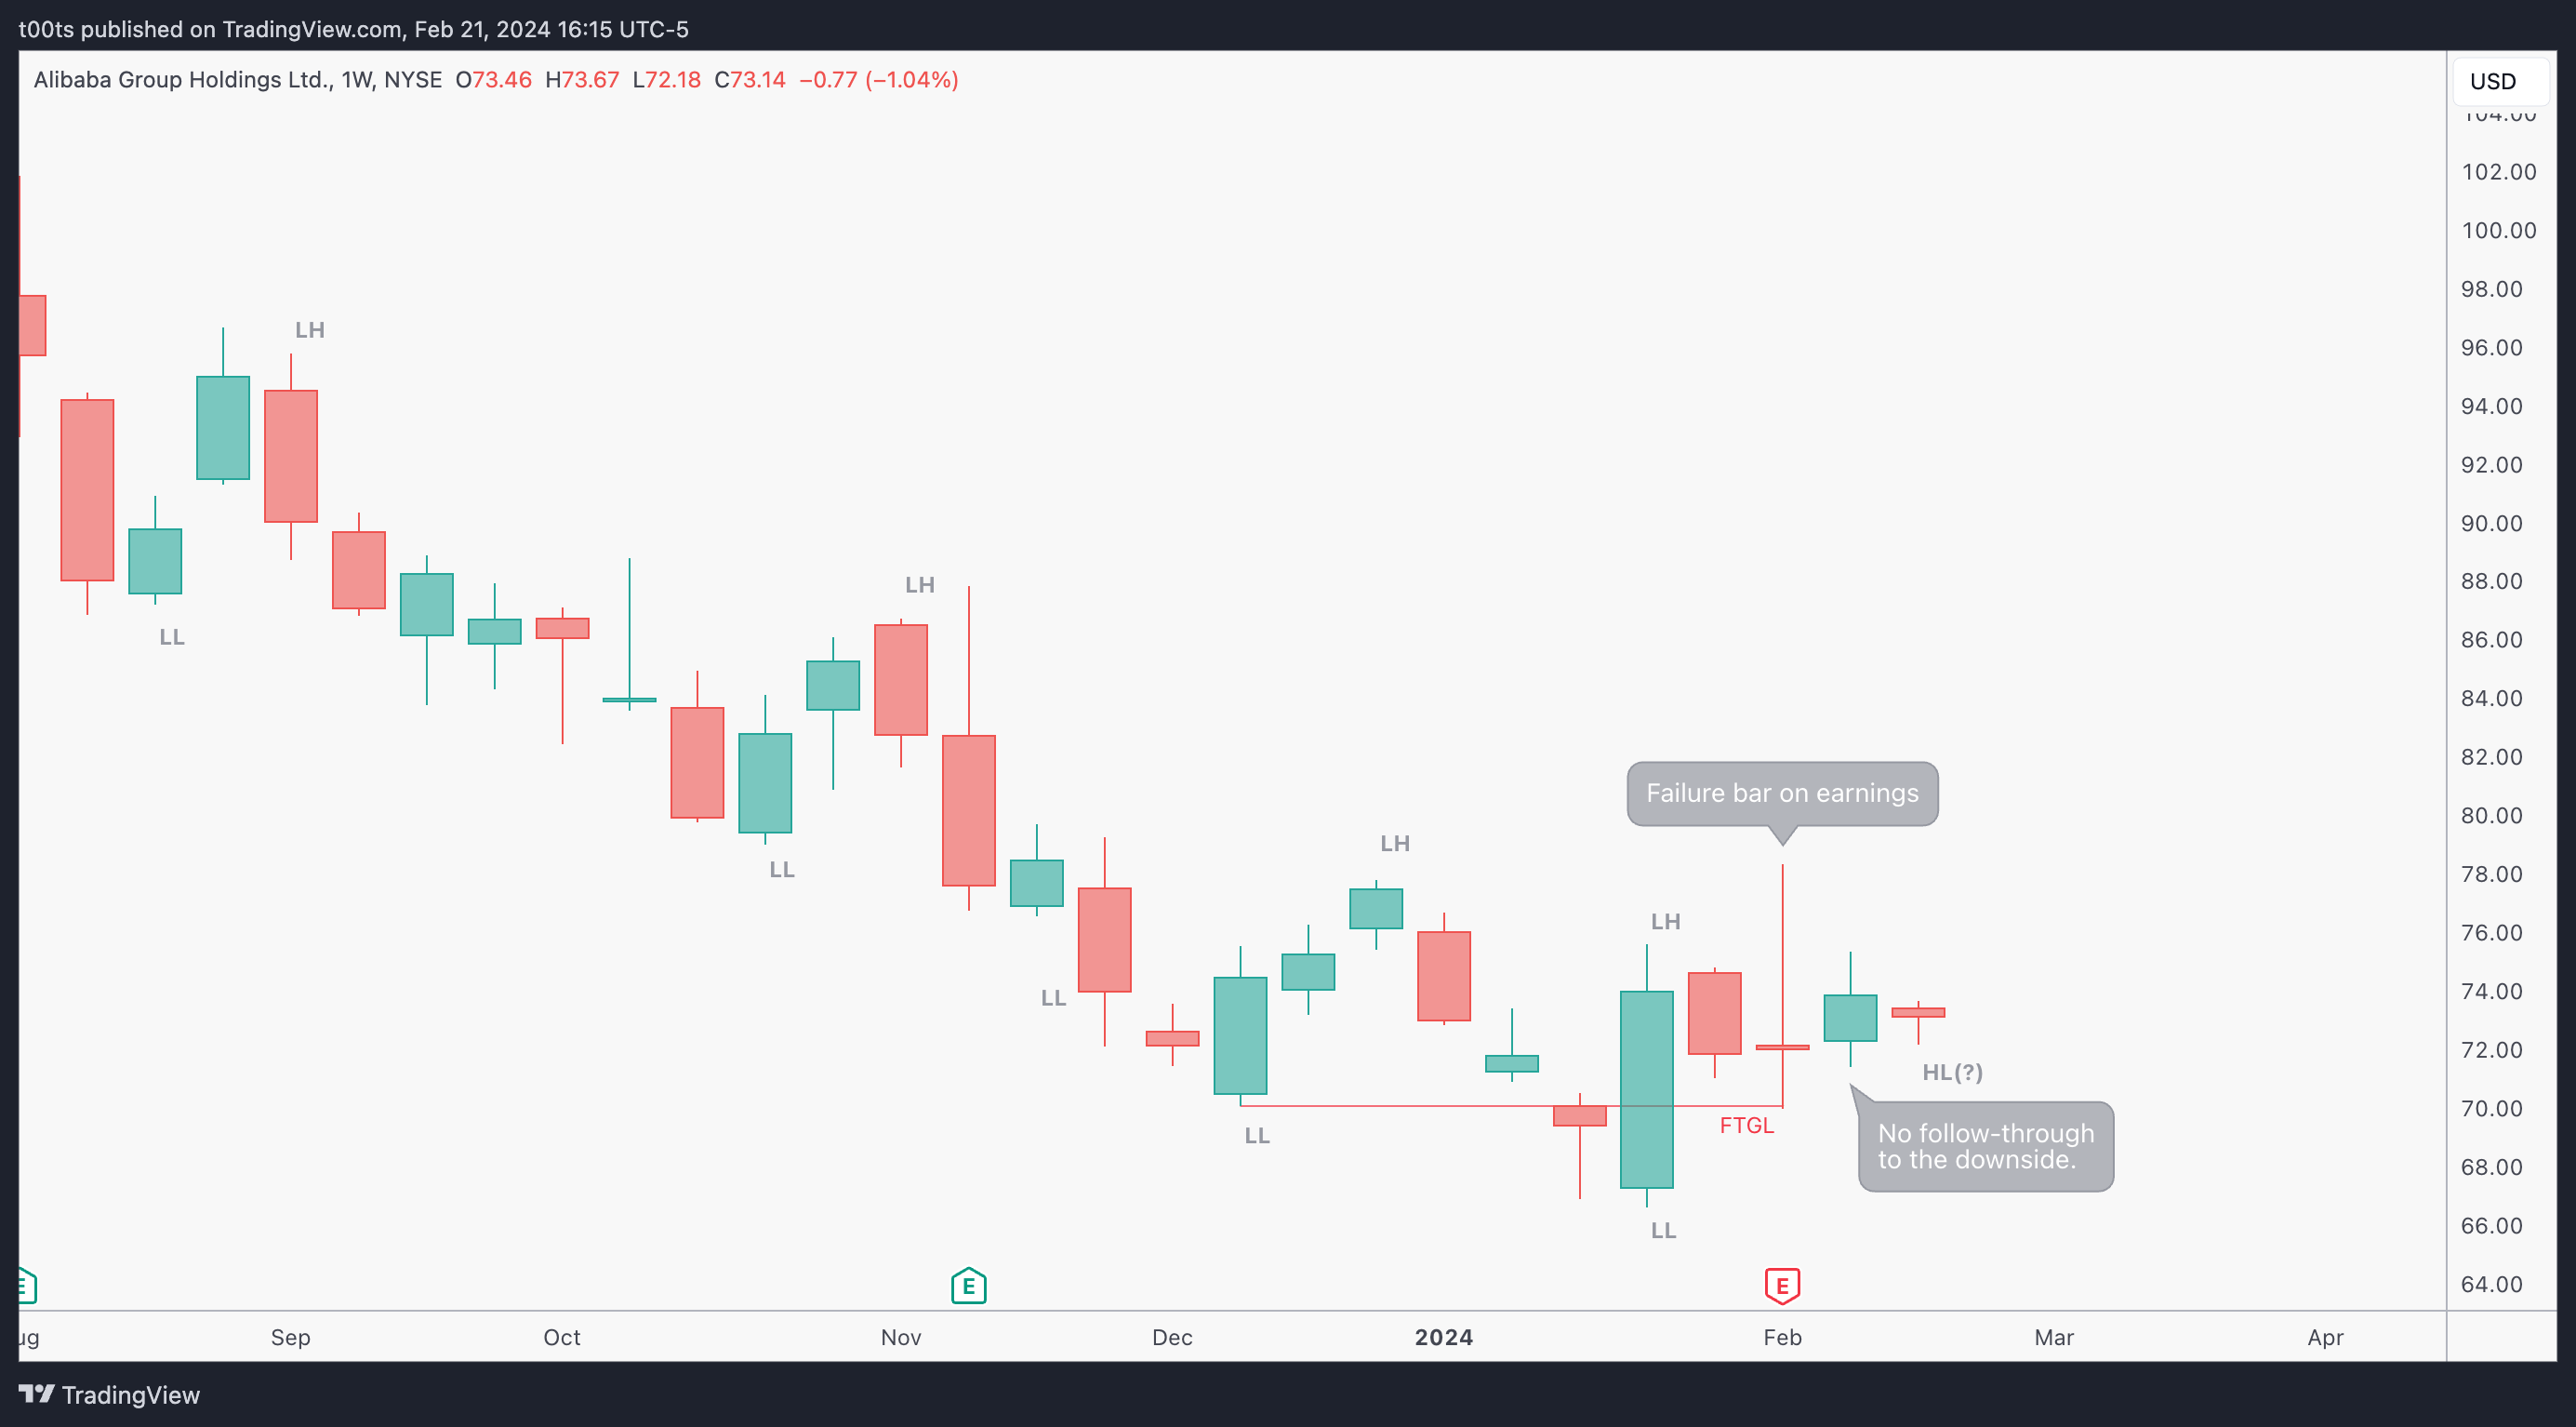
Not going too deep into this weekly action because I already did in a recent post. What's important here is that the stock seems to be basing. The company recently had its earnings report, and while there was a somewhat strong reaction to the downside, it lacked follow-through, as bulls held the line.
In the previous post we saw how much BABA had been slammed since its highs. Looks like the selling pressure is getting weaker and weaker.
Daily chart
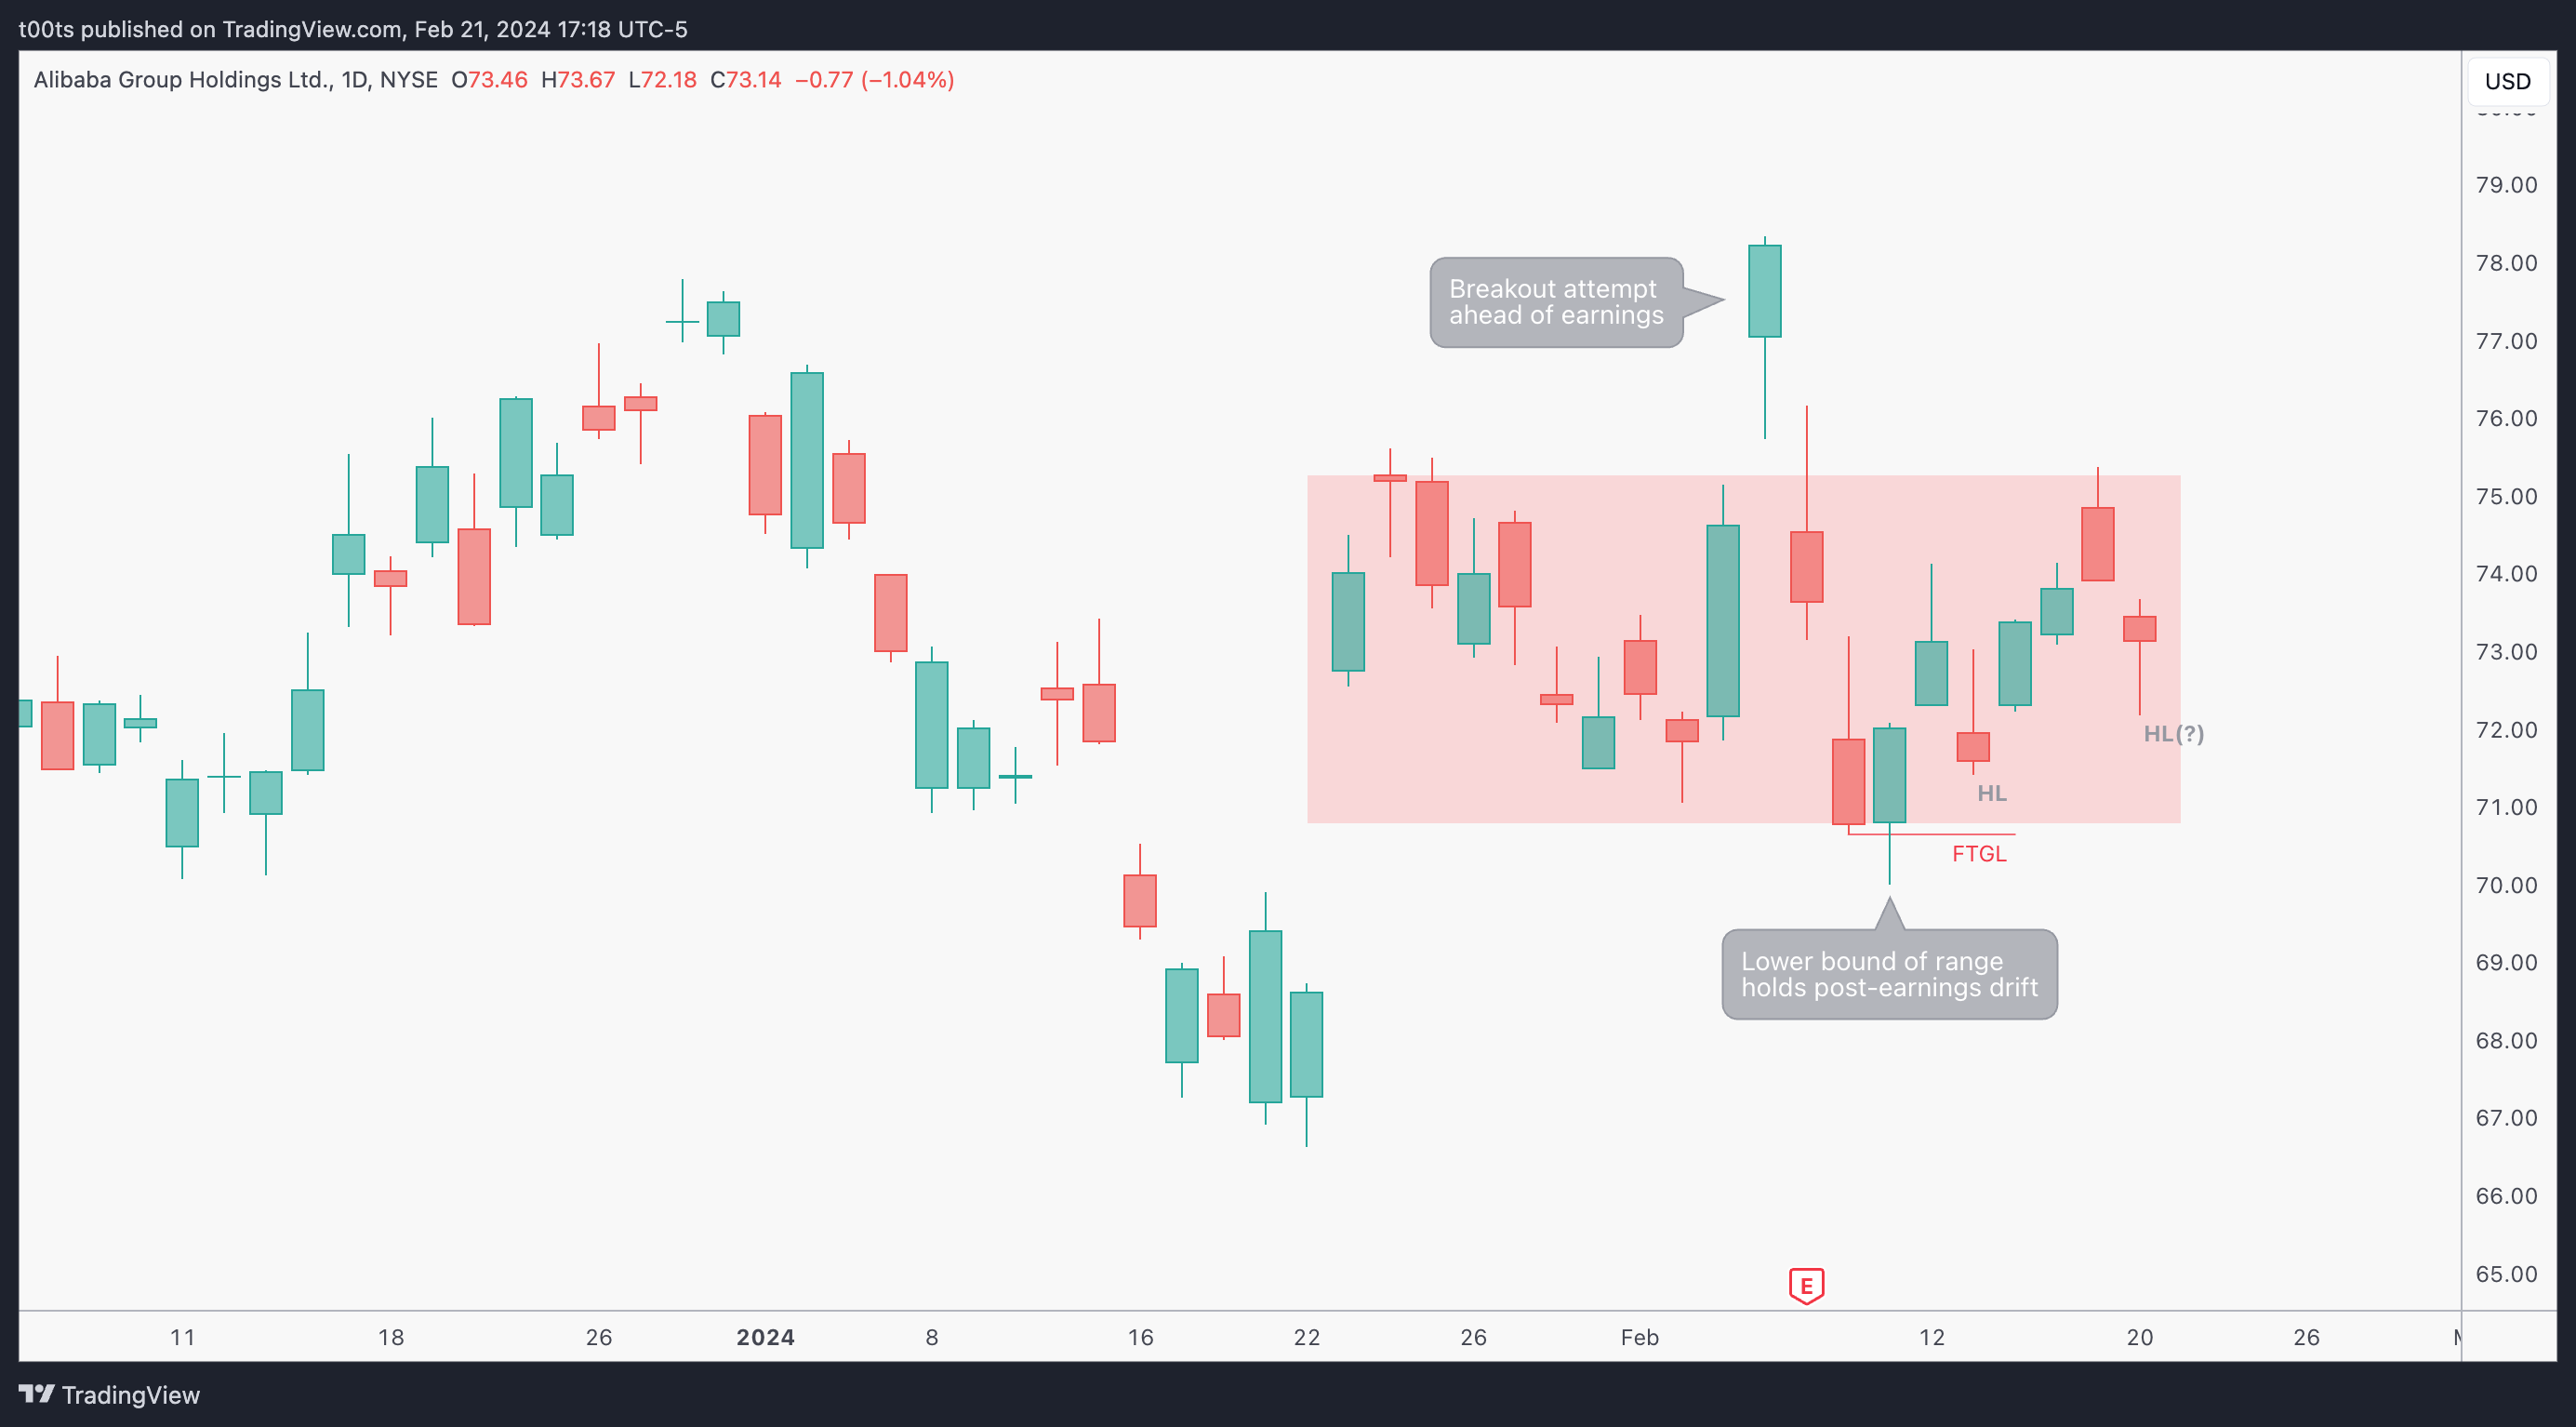
Daily chart seems range-bound at first and full of noise, but it does give us some clues, in-line with what we just saw on the weekly chart. Look at how buyers held at the lower bound of the range, putting in a failure bar and reversing the post-earnings drift to the downside. Price appears to be putting in a potential higher low after climbing back up to the top of the range and getting rejected.
Hourly chart
Skipping the hourly chart on this one as it's quite irrelevant for the trade we're about to discuss.
Pre-market action
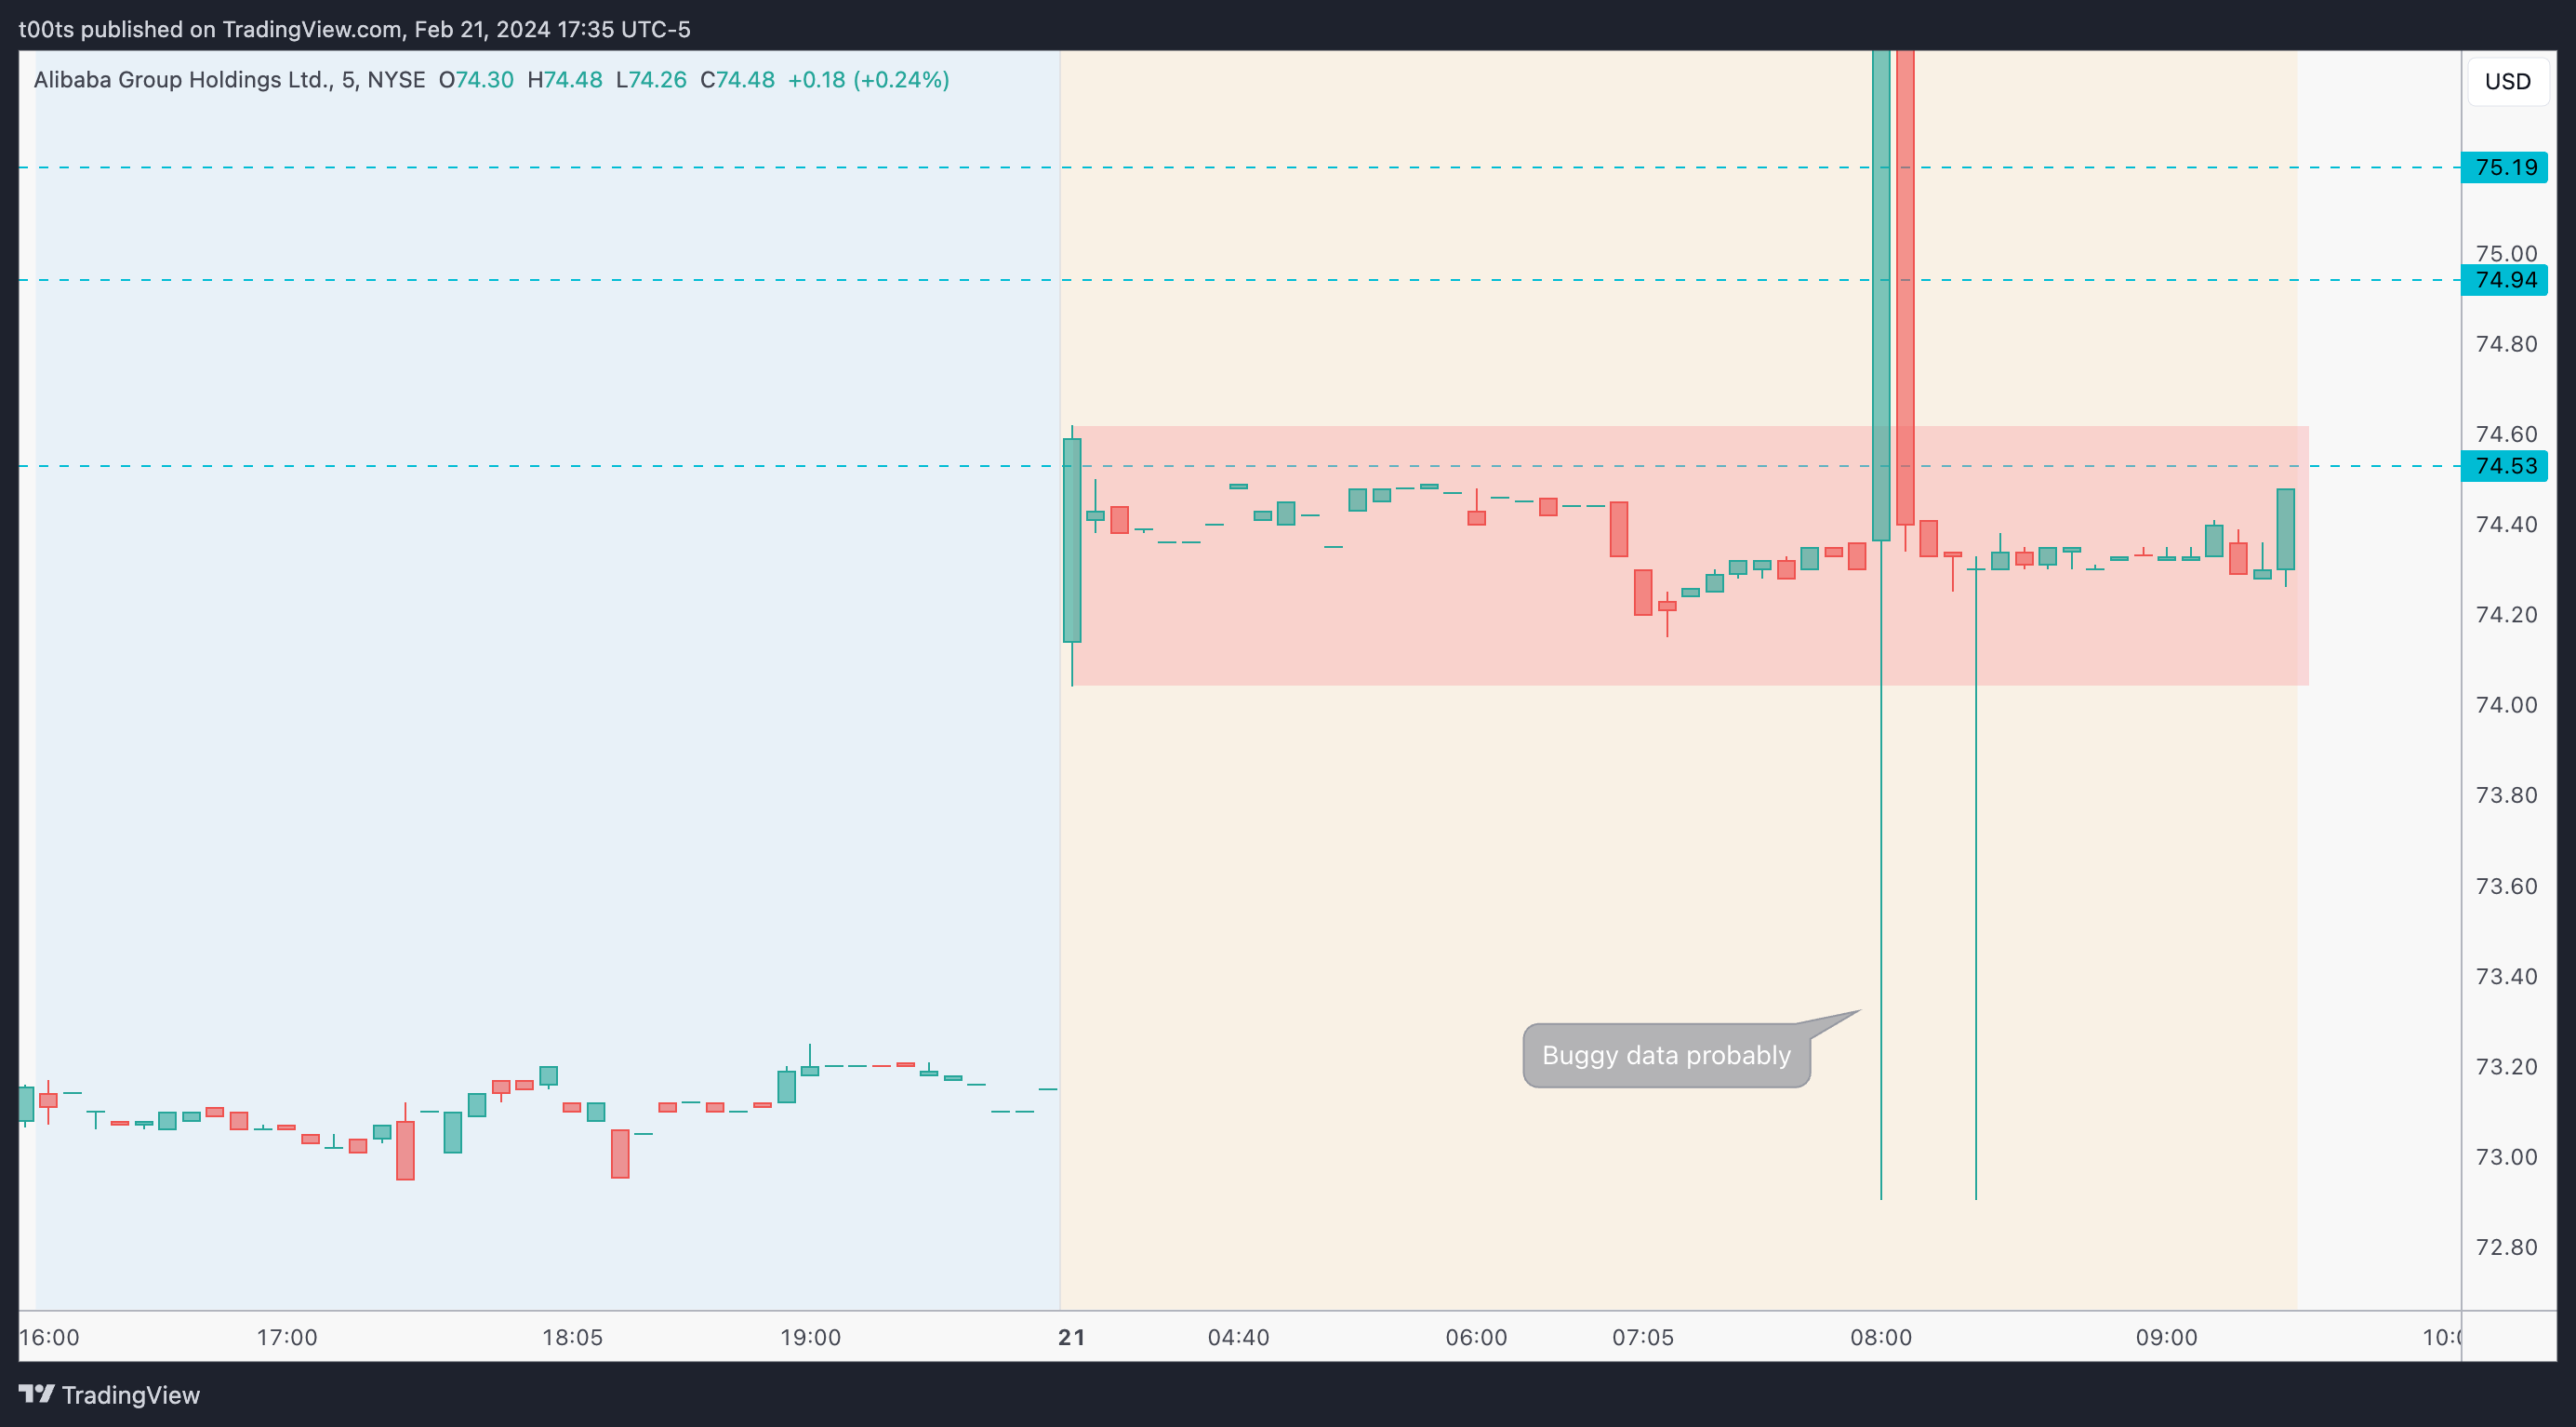
This pre-market action might not seem that interesting but there's actually a very simple takeaway: Price has gapped up and held that gap for the entirety of the pre-market session, trading in a tight range right below a level the whole time.
The trade
Using our CPT Framework:
Cue(s)
Weekly and daily chart seem to be setting up for upside reversal
Low-beta name gapping up on a day where we expect chop
Pre-market gap held on a tight range with a level nearby
Plan
Price has been ranging all pre-market, so in an ideal world we'd love a quick dip (very common when stocks gap up) that would allow us to get involved around the lower bound of that pre-market range.
Any time price is trading in a range and I'm looking to get involved, I always stick to one rule: Never buy the breakout, and never short the breakdown. Instead, you'll want to buy around the lows or sell near the highs. This allows you to place your stop in a place where it actually makes sense and keep your risk in check.
If that doesn't happen or happens too quickly, we'll want to look for bullish price action on the lower timeframes near the $74.53 level, which is the key level to break and hold if we want to see further upside.
Trigger(s)
Price bouncing off the lower bound of the pre-market range
Bullish entry near the $74.53 level triggering
2m chart
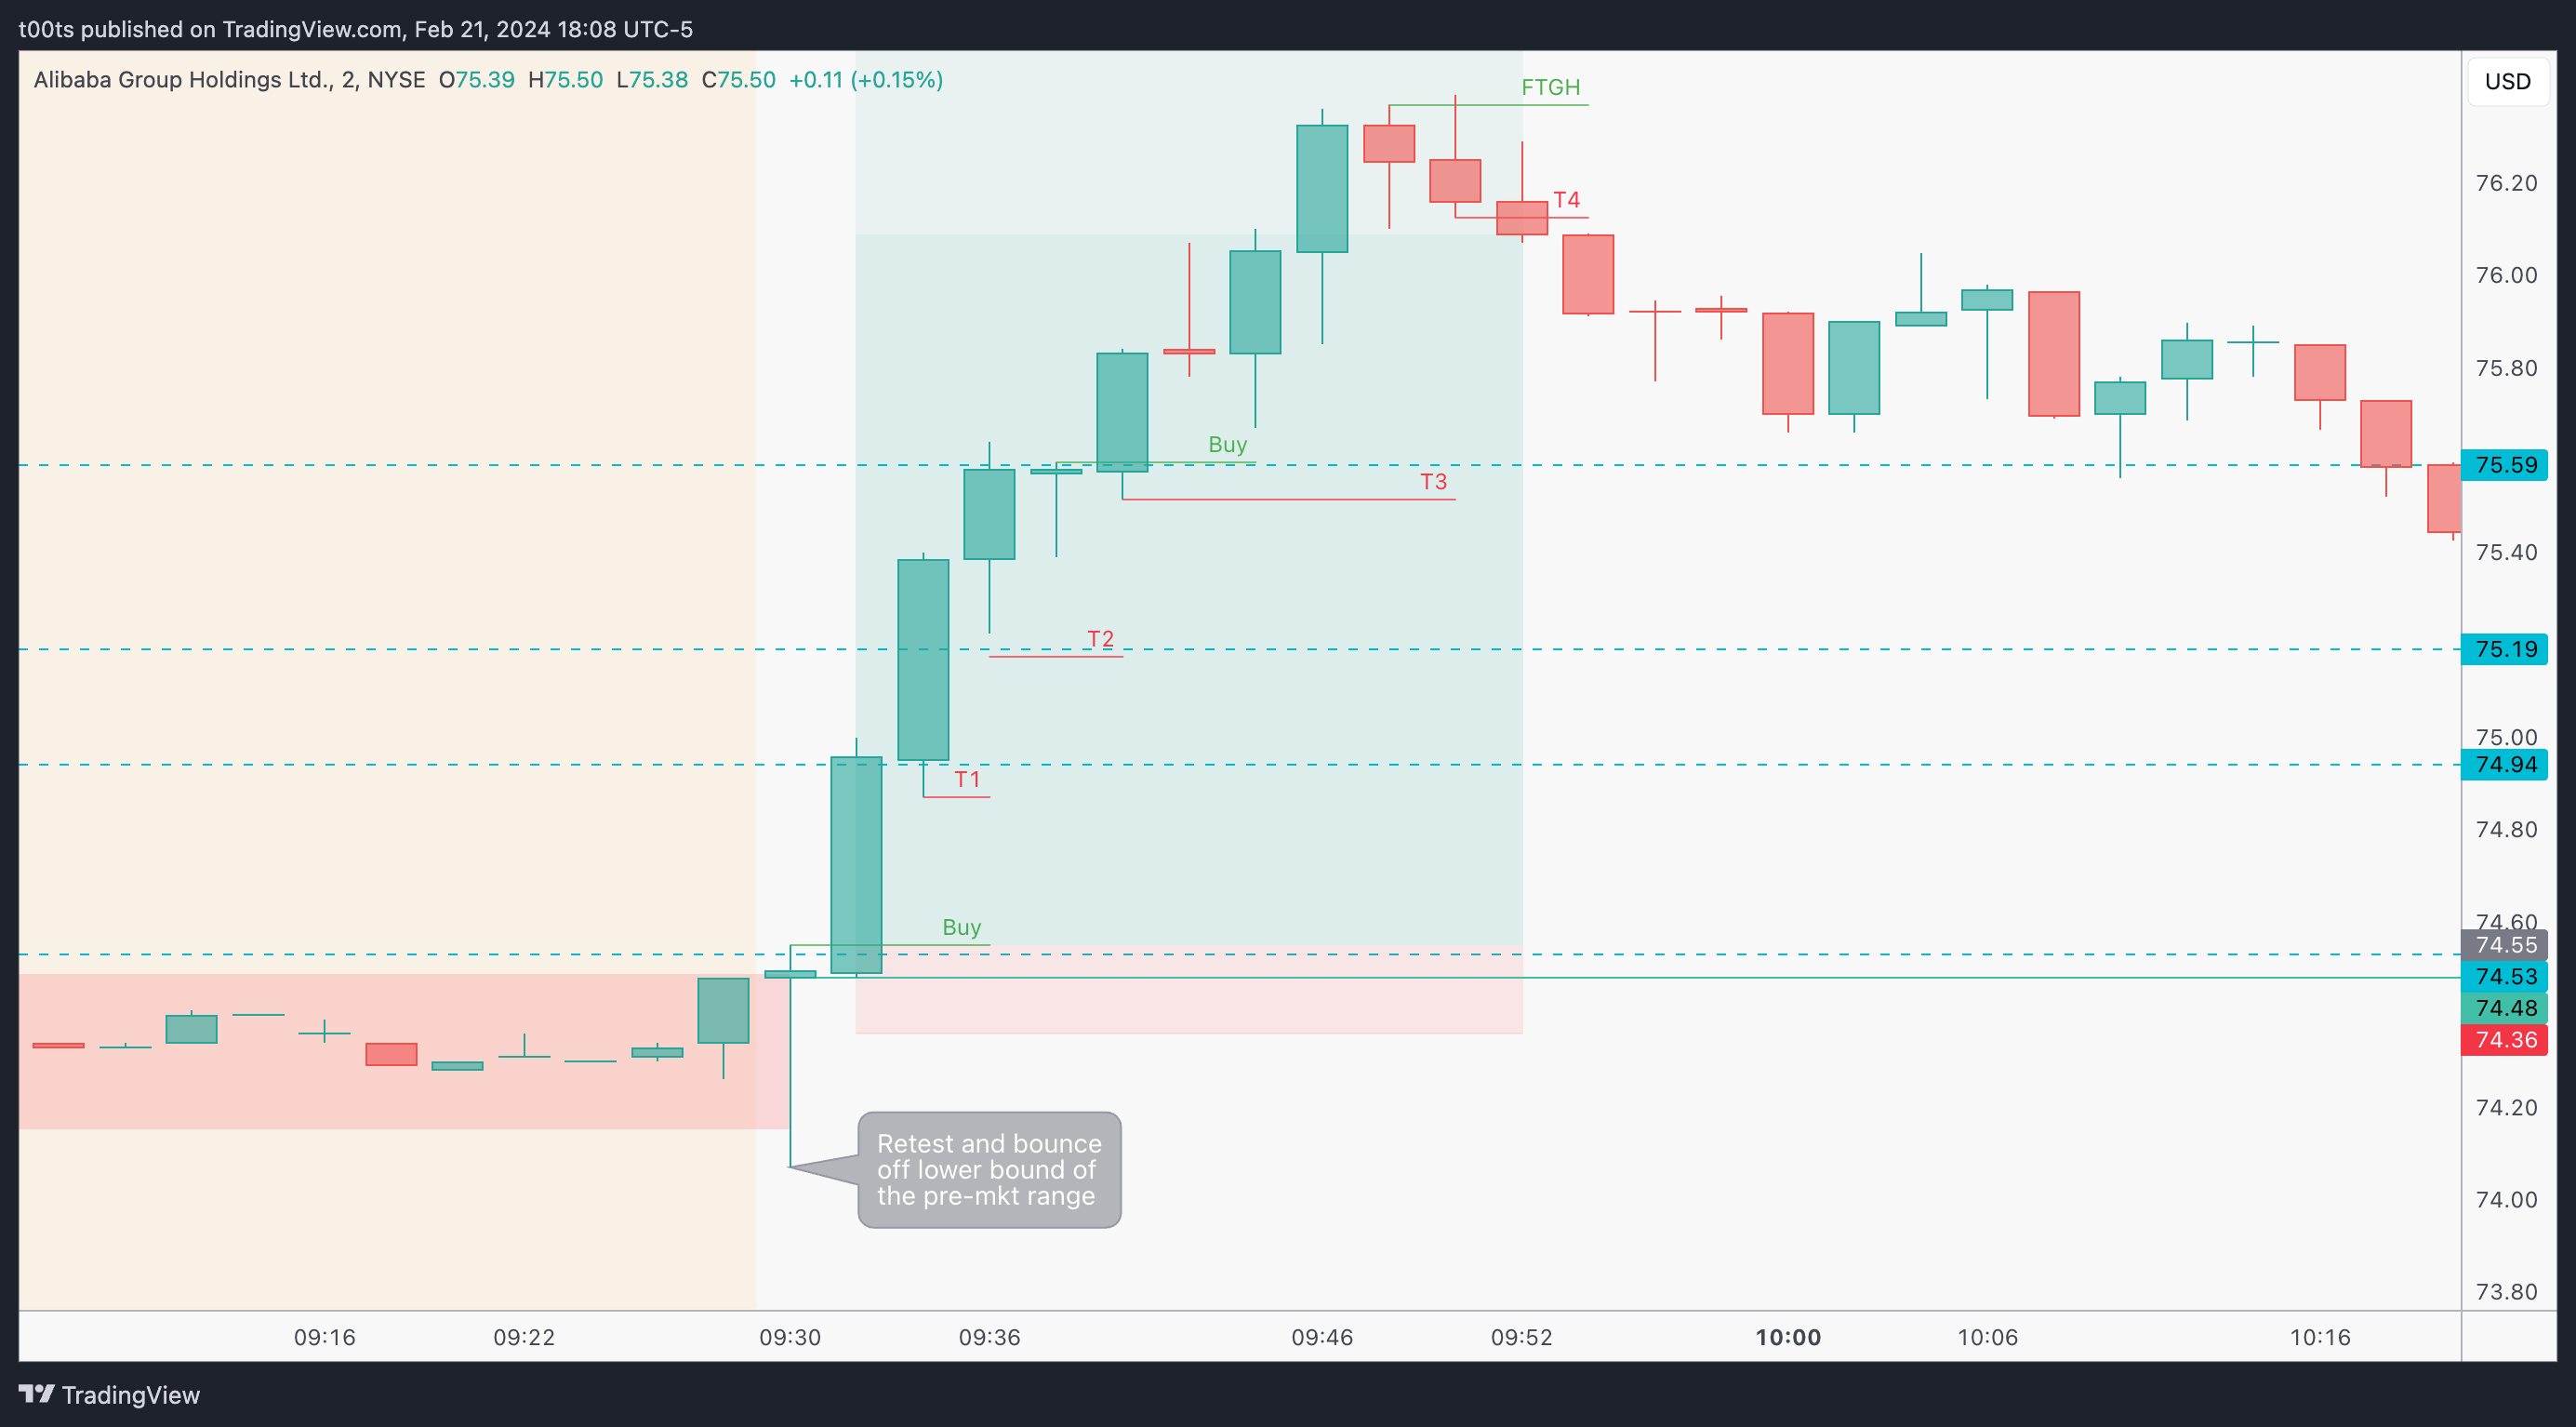
Price does in fact retest that lower bound of the pre-market range and bounce straight off the open, leaving us with a very convenient bullish hammer signal bar with a buy trigger right above our $74.53 level of interest. We now know that buyers are indeed interested in bidding price higher and have a solid entry point 2 minutes after the bell. You can choose to risk lows of the day or somewhere below the opening print for a tighter stop. I went with the latter but that's up to you.
The trade works immediately and is pretty much stress free until it tops at that failed 3-bar play at the mid-$76's.
T1 is our first trail the moment price breaks $74.94 and guarantees some profits. Same thing with T2 and the $75.19 level. We just trail our mental stop expecting these levels to hold as price climbs up.
T3 is again, the same thing, although this one allows us to add more to our position on that convenient 3-bar play at the $75.59 level.
T4 is our final trail and the one that gets triggered after that failed 3-bar play at the highs.
5m chart
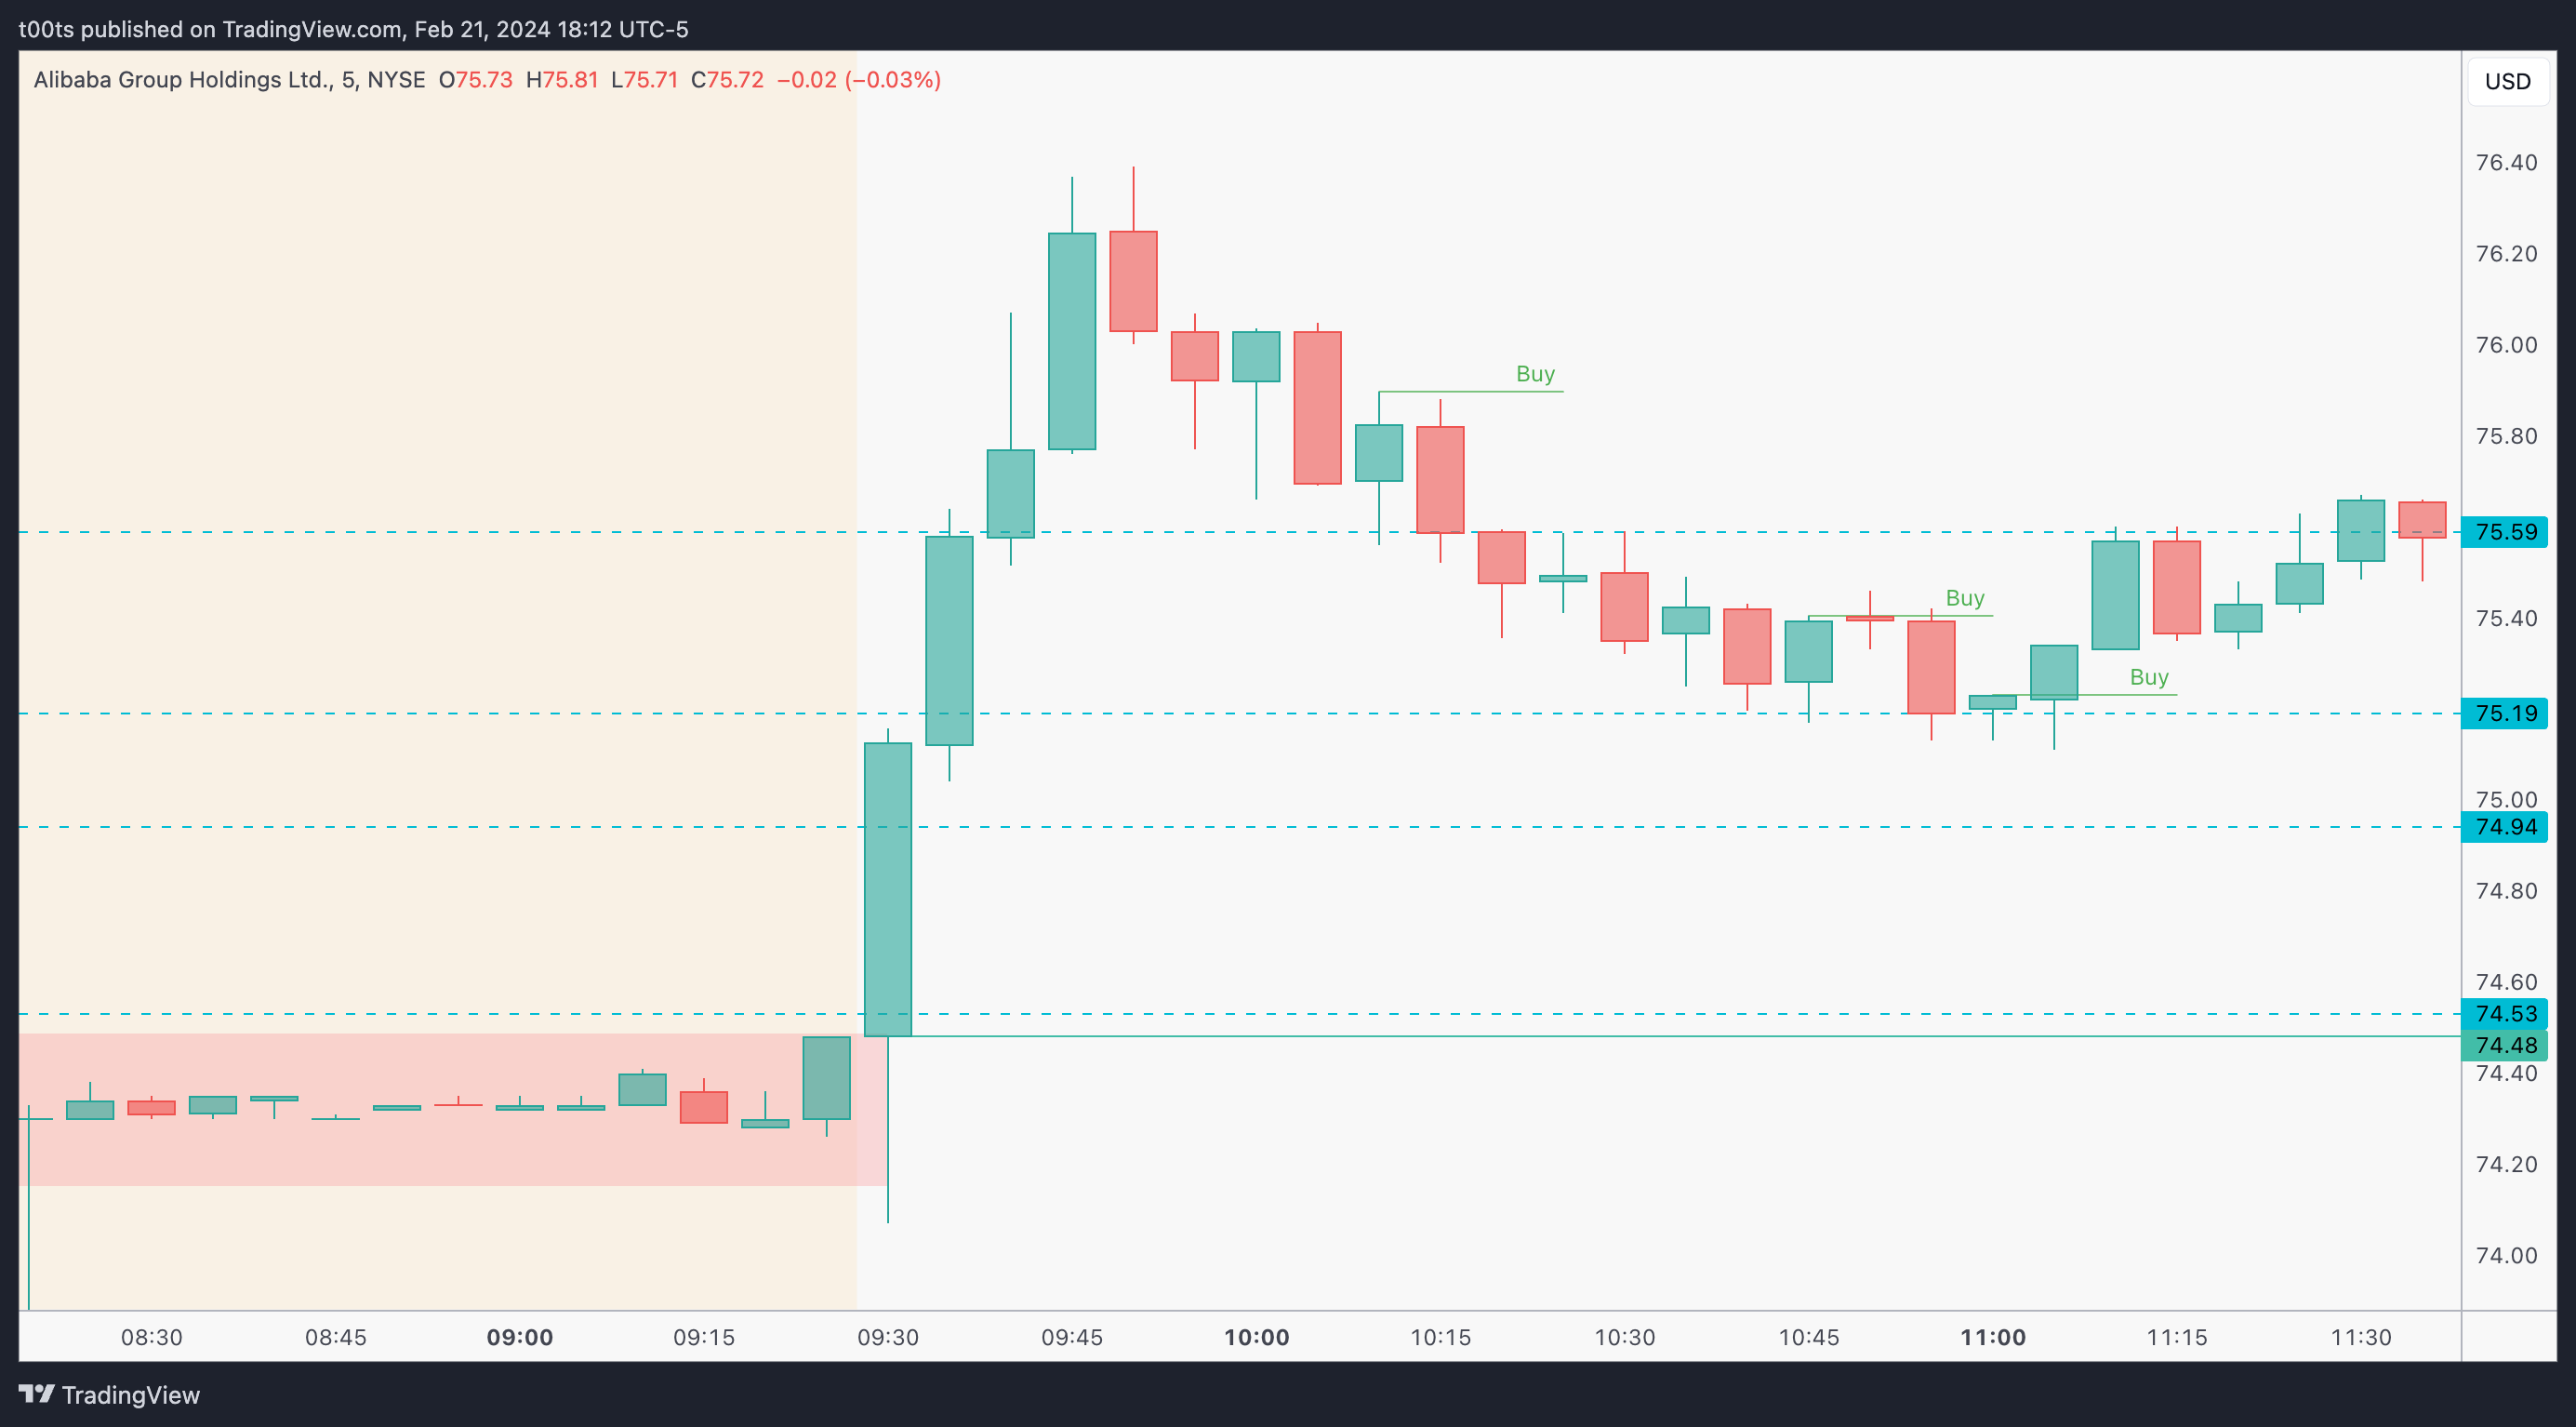
Here's a 5m chart for reference. Again, zero-stress opening drive trade.
Closing notes
Going over these missed trades, especially when I've personally discarded them in favour of others that didn't work well, humbles me and keeps me in check with myself.
Everything seems obvious in hindsight, but if you don't make an effort to actually learn from these now obvious cues, you certainly can't expect to make better decisions next time they pop up.
I am posting one trade writeup every day throughout 2024. I focus on large caps using levels and price action. The subscription is absolutely free and will always be. I will strive to provide value by offering clues and ideas for you to enhance your edge. Let’s grow together!