

Higher timeframe context
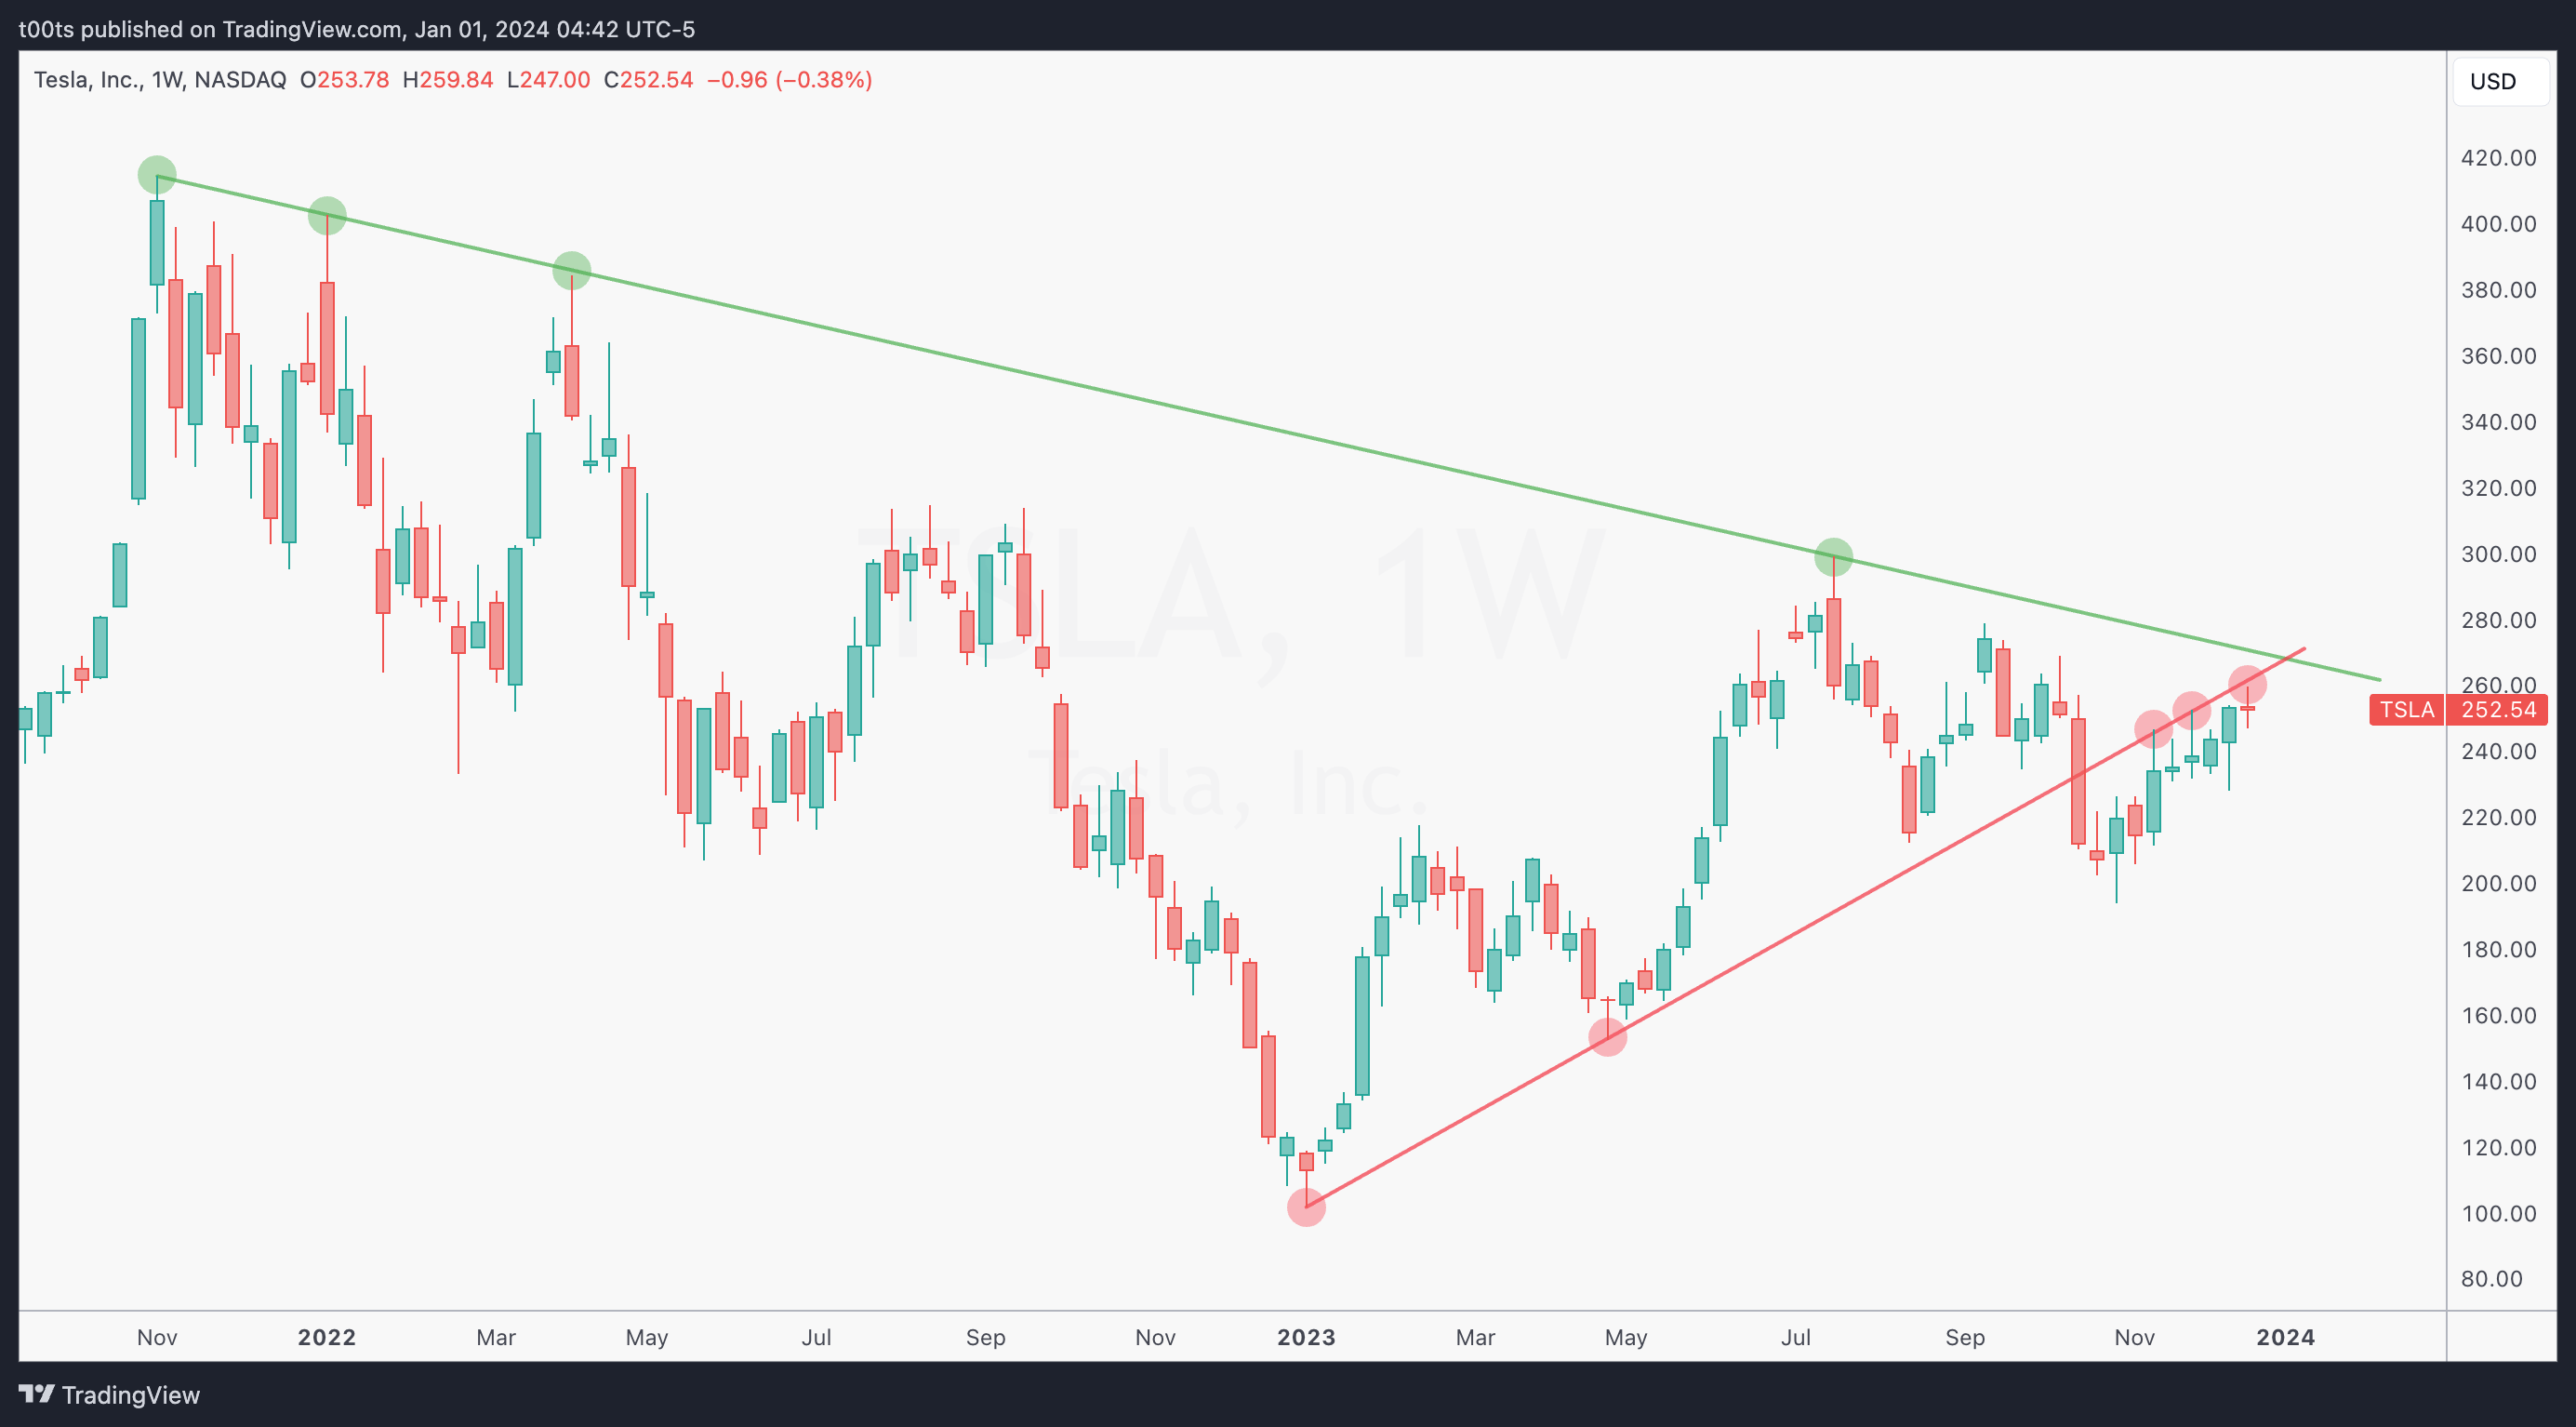
TSLA is still below the weekly trendline it broke on the week of Oct 16th, yet we keep seeing posts all over social media painting a bullish picture. Meanwhile, despite the choppy higher lows, price hasn't been able to breach that trendline. In fact, we've rejected up to 3 times during this last choppy month. A crack is coming, to either side potentially, but the chart screams bearish.
Weekly chart
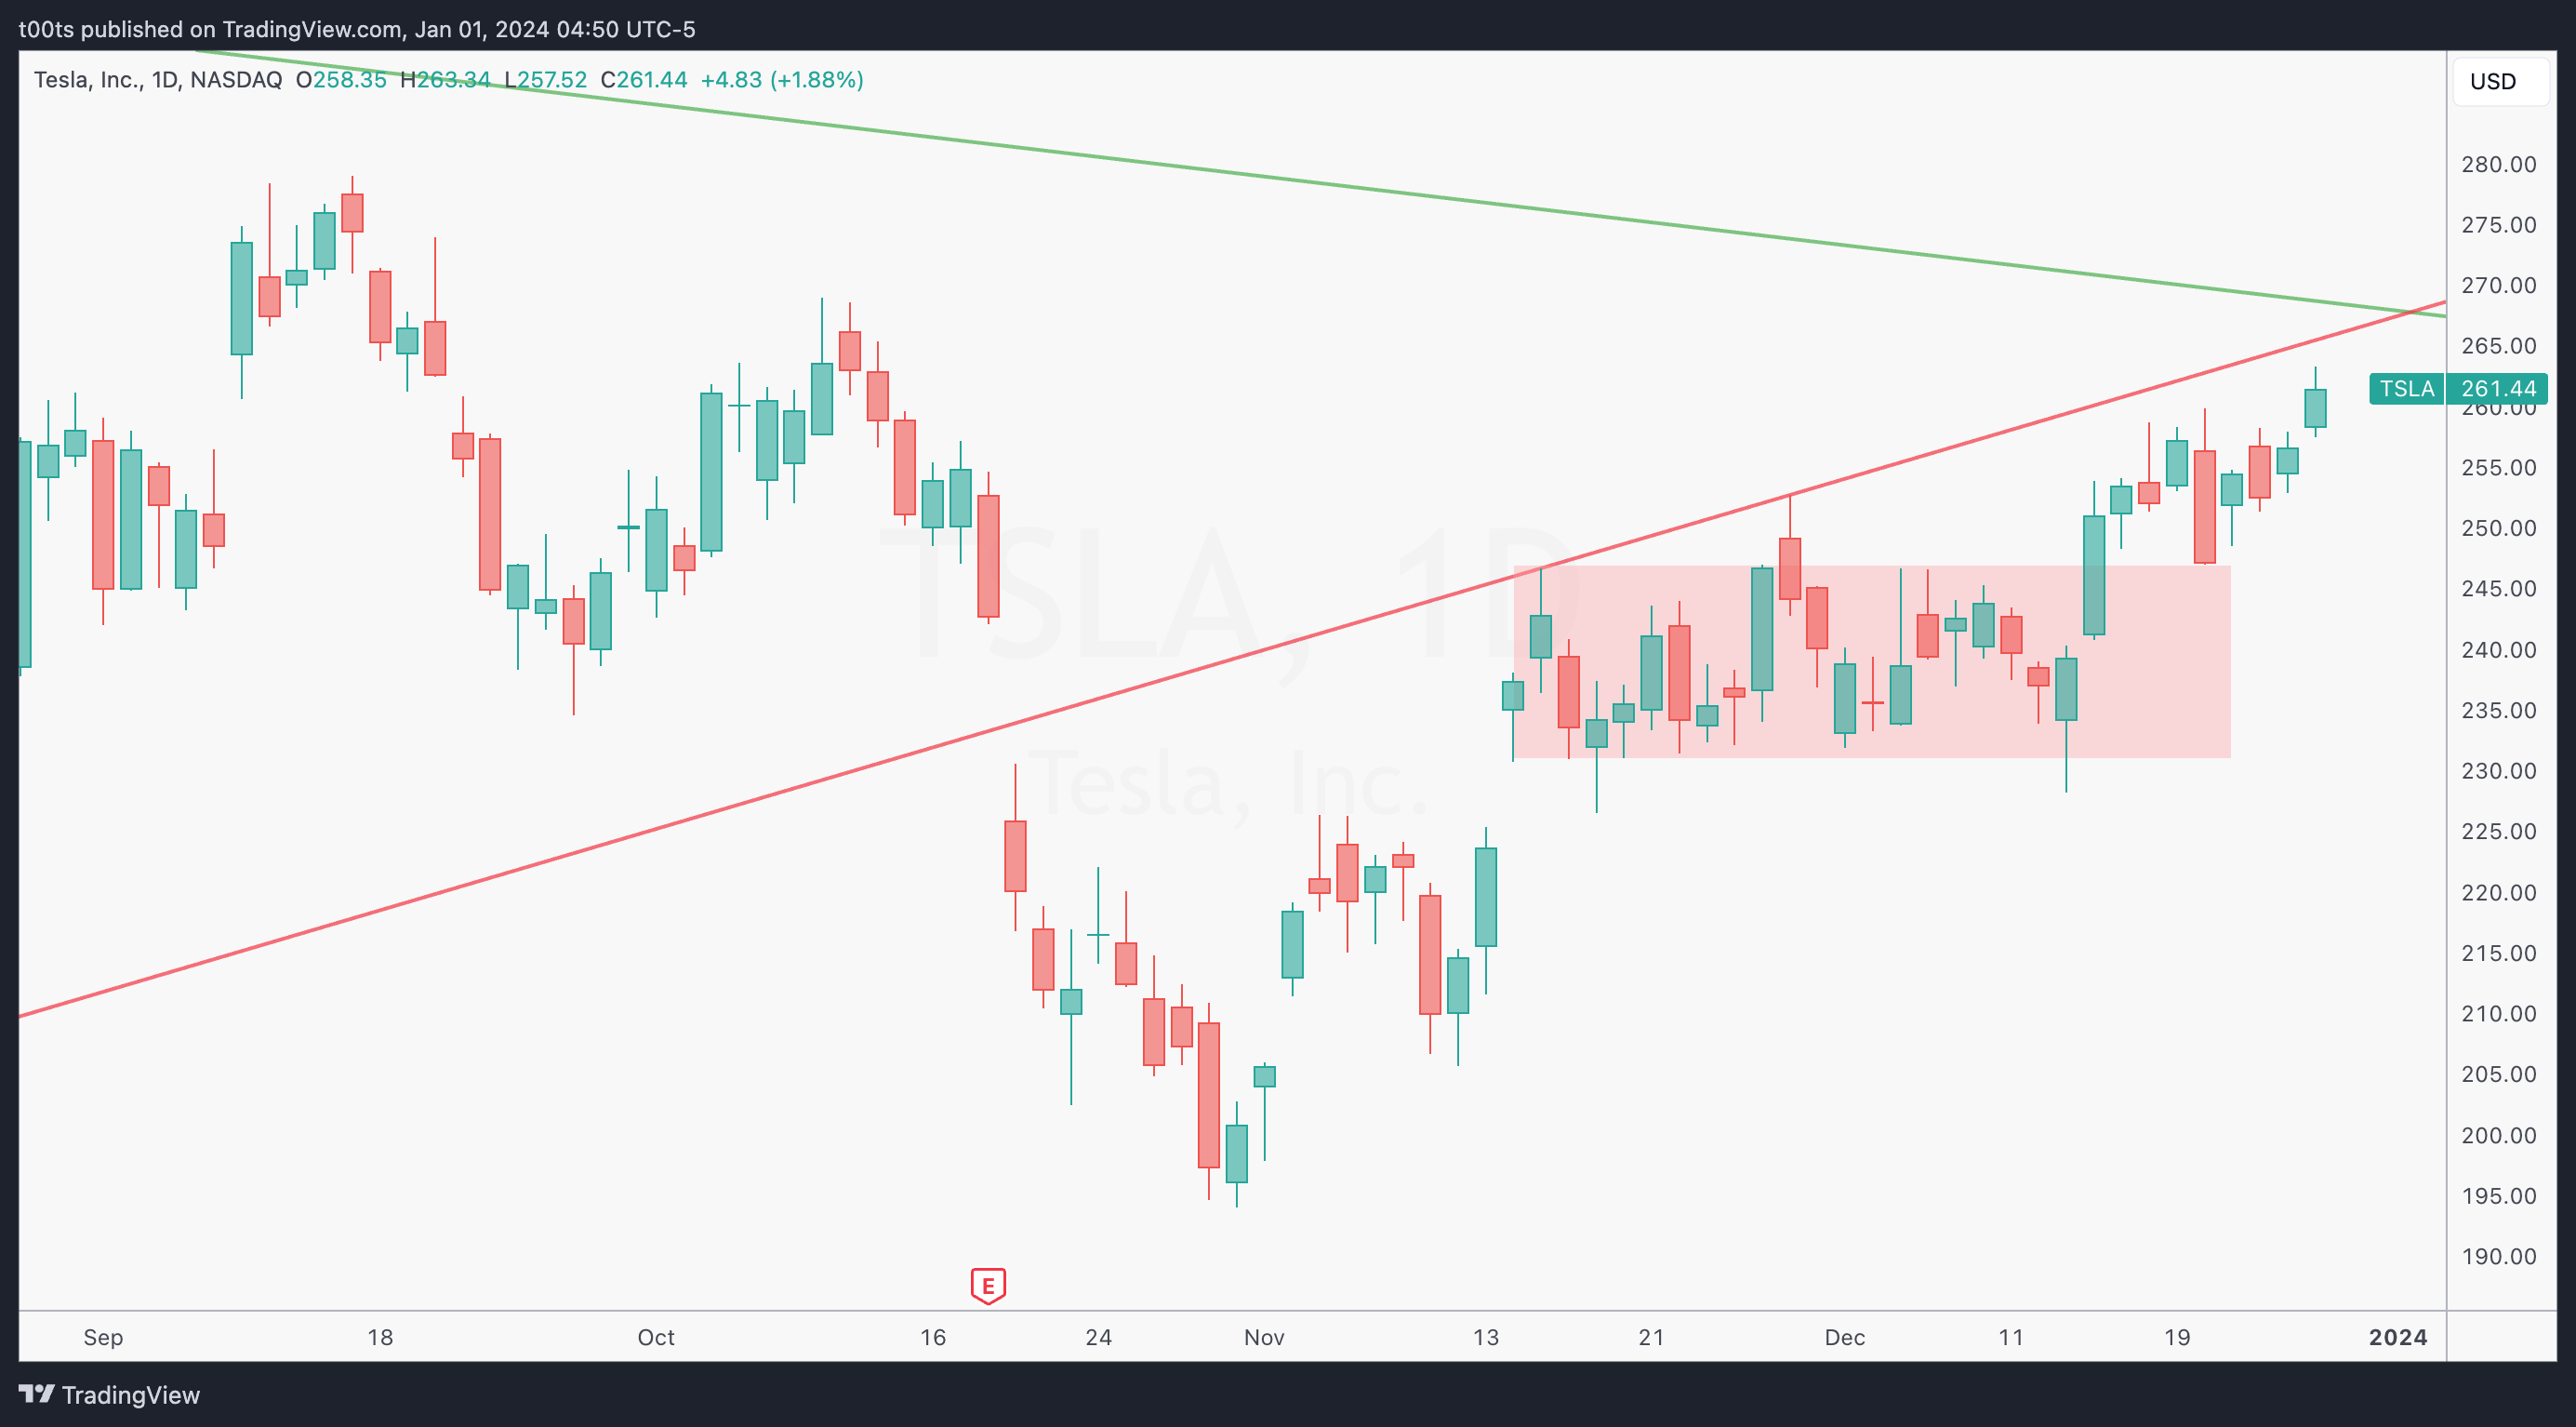
Daily chart
Hourly chart
The hourly chart displays a nice clean uptrend, but we are approaching the $246.46 level, which marked the start of a -25% pullback on Oct. 12th, making it a pretty strong level to watch out for.
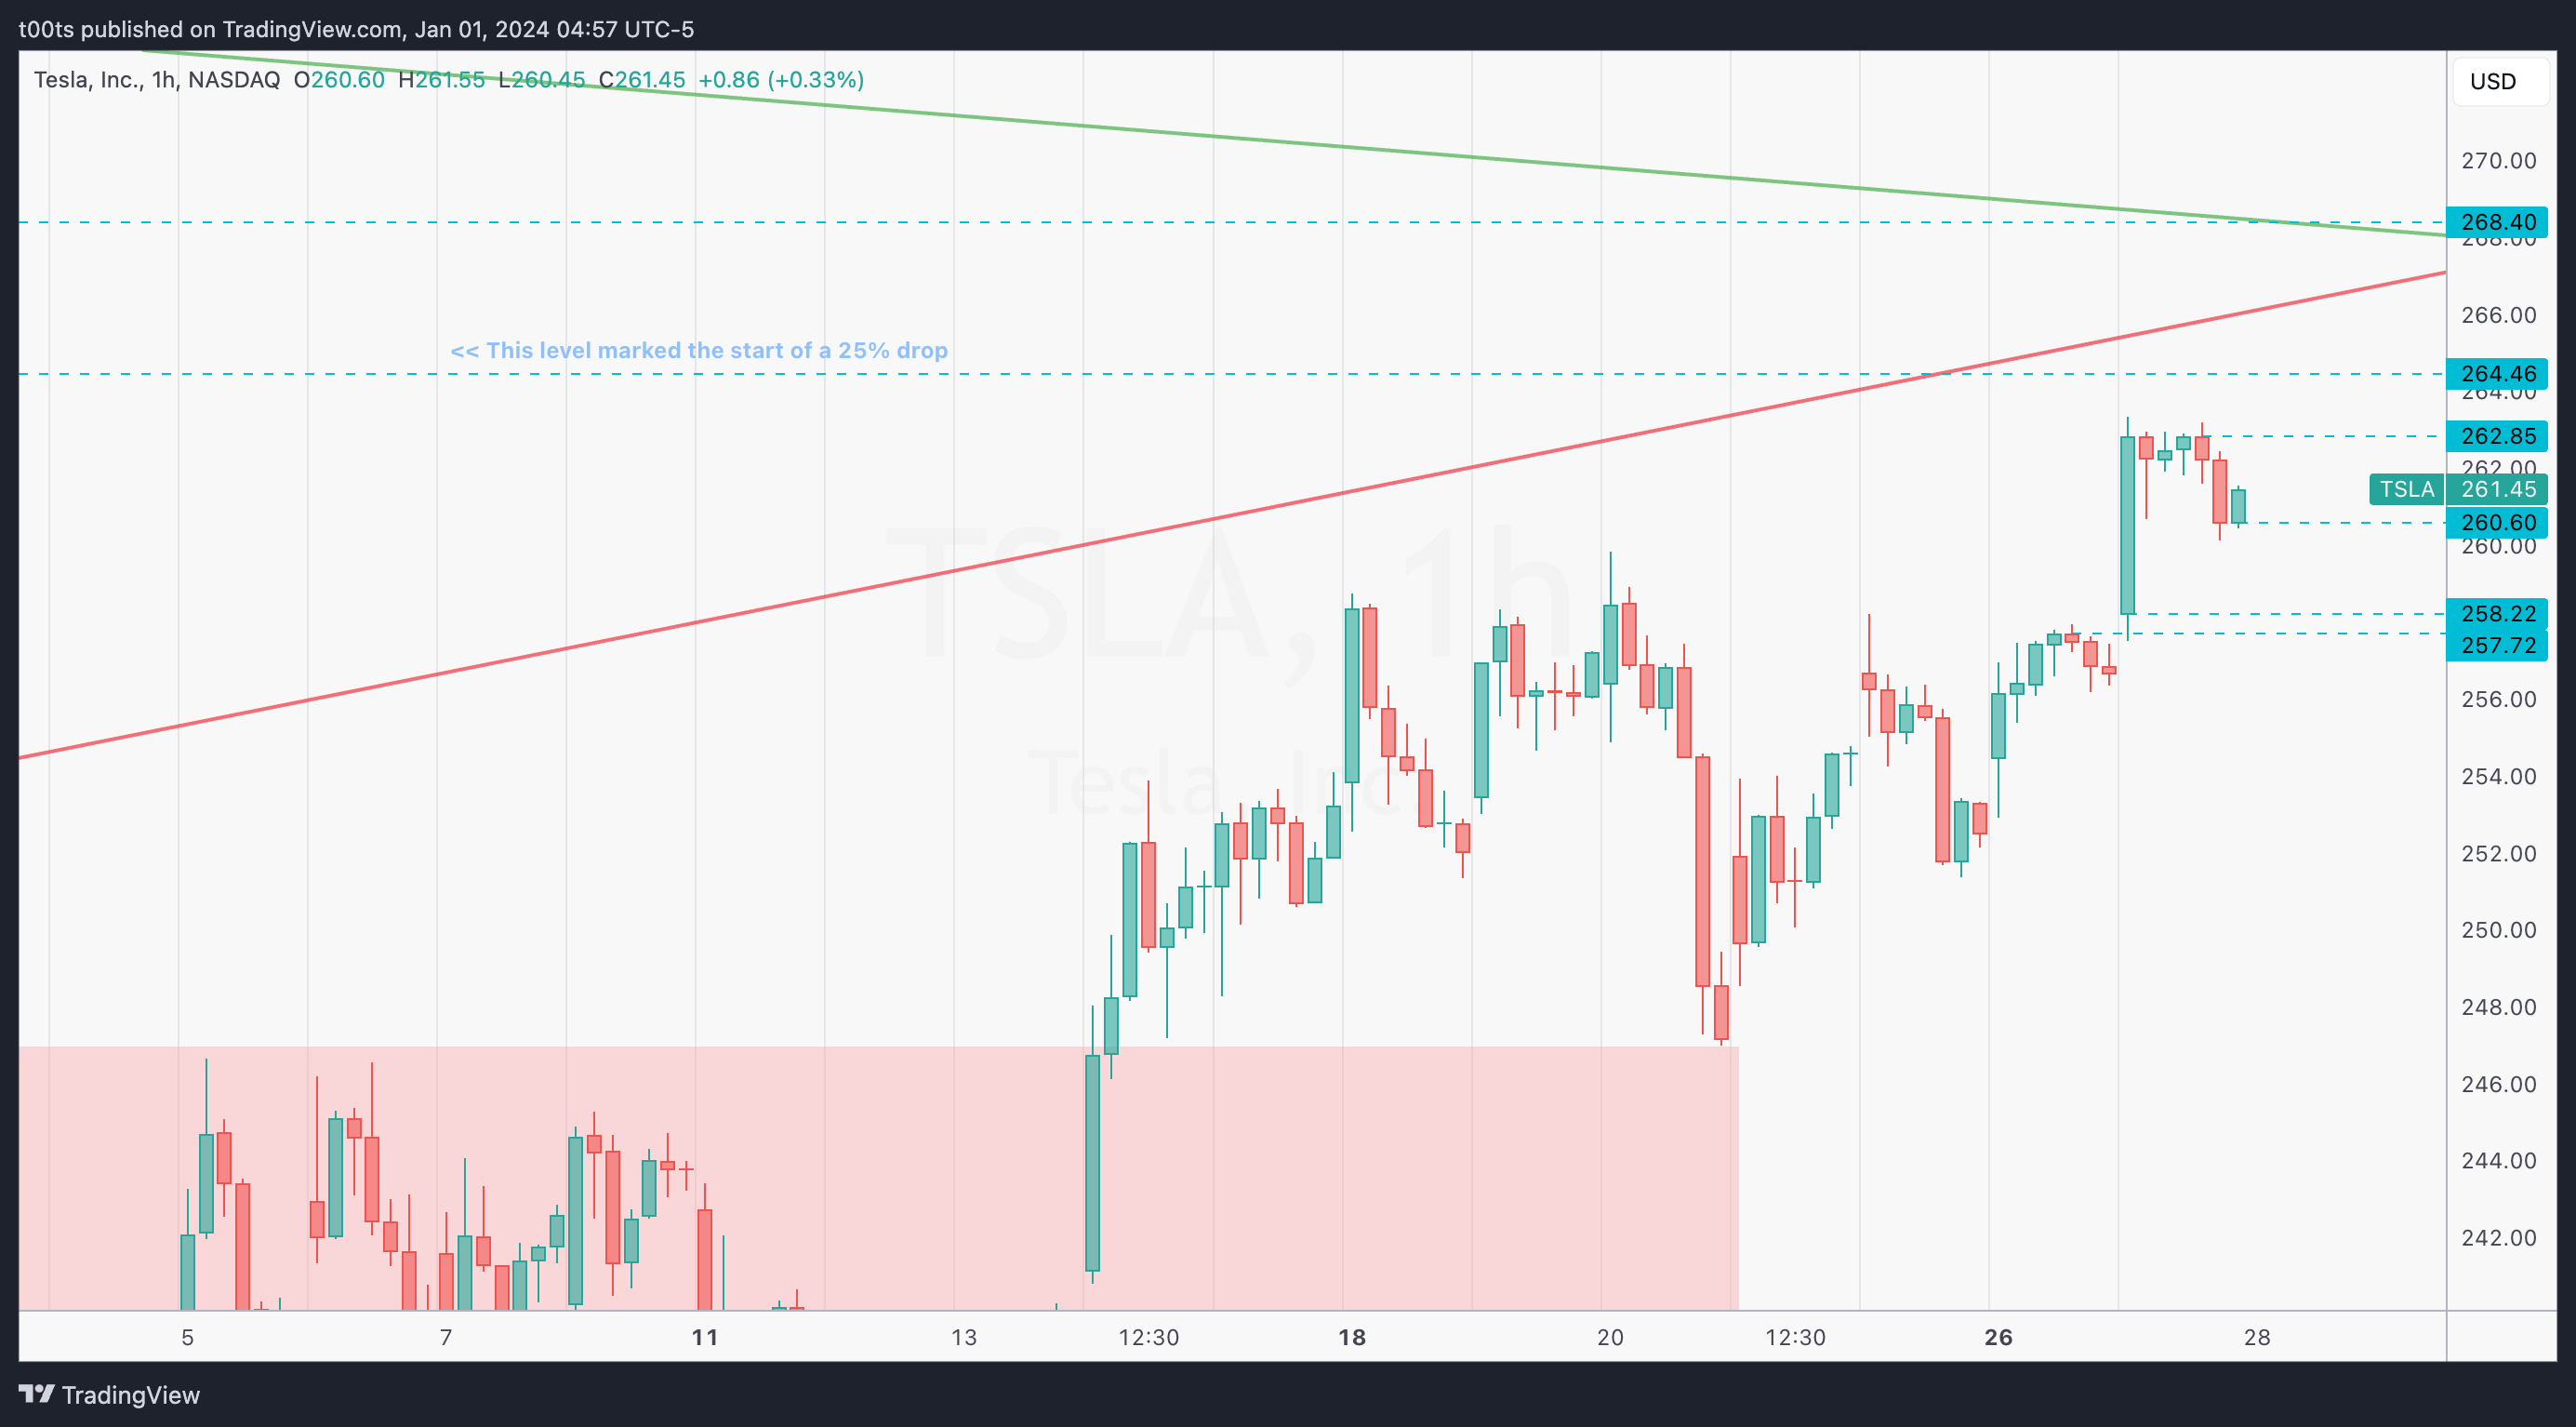
Pre-market action
This stock is on watch because of its strong gap up during the early hours of the pre-market. The moment it fails the $246.46 key level is where I become very interested.
The trade
I was very short biased this day given the reasons outlined above, yet still failed to capitalize on the full move. Regardless, this is what I was looking at:
Cue
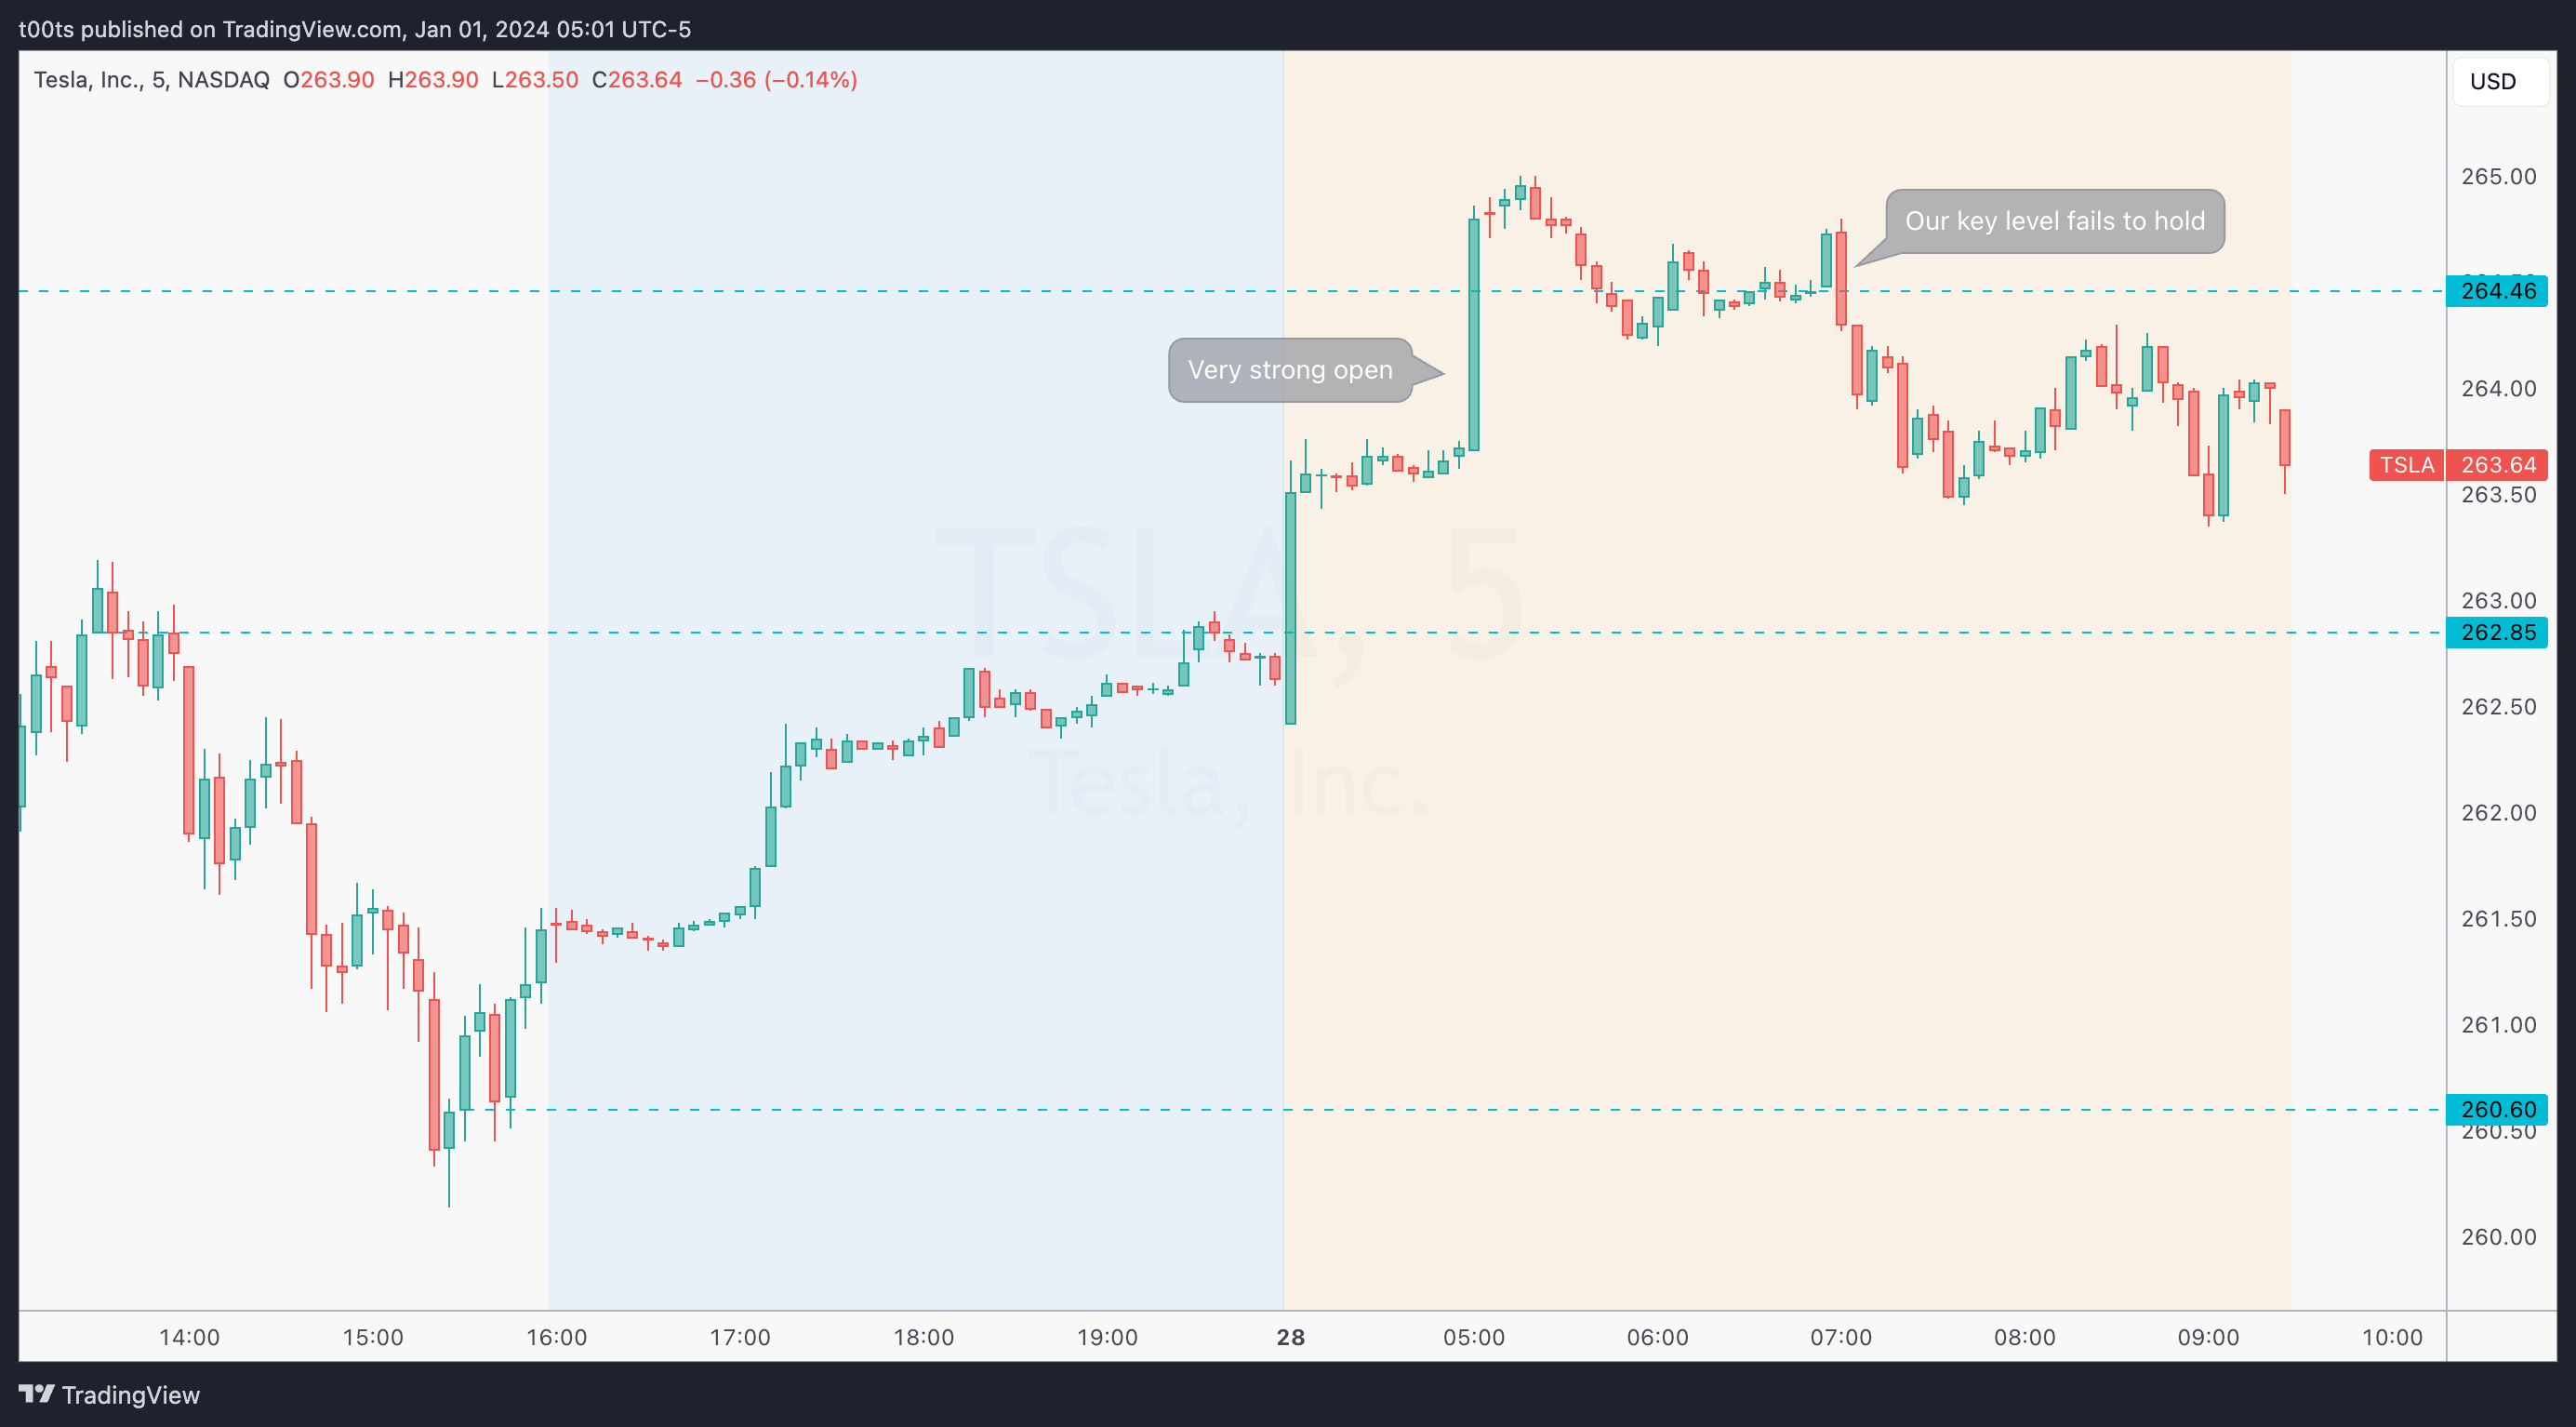
Key level fails during the pre-market after a strong gap up
Plan
Look for a rejection of the $246.46 level at the open and short aggressively with a stop at HOD.
Trigger
Price breaching the level to the upside and failing to hold
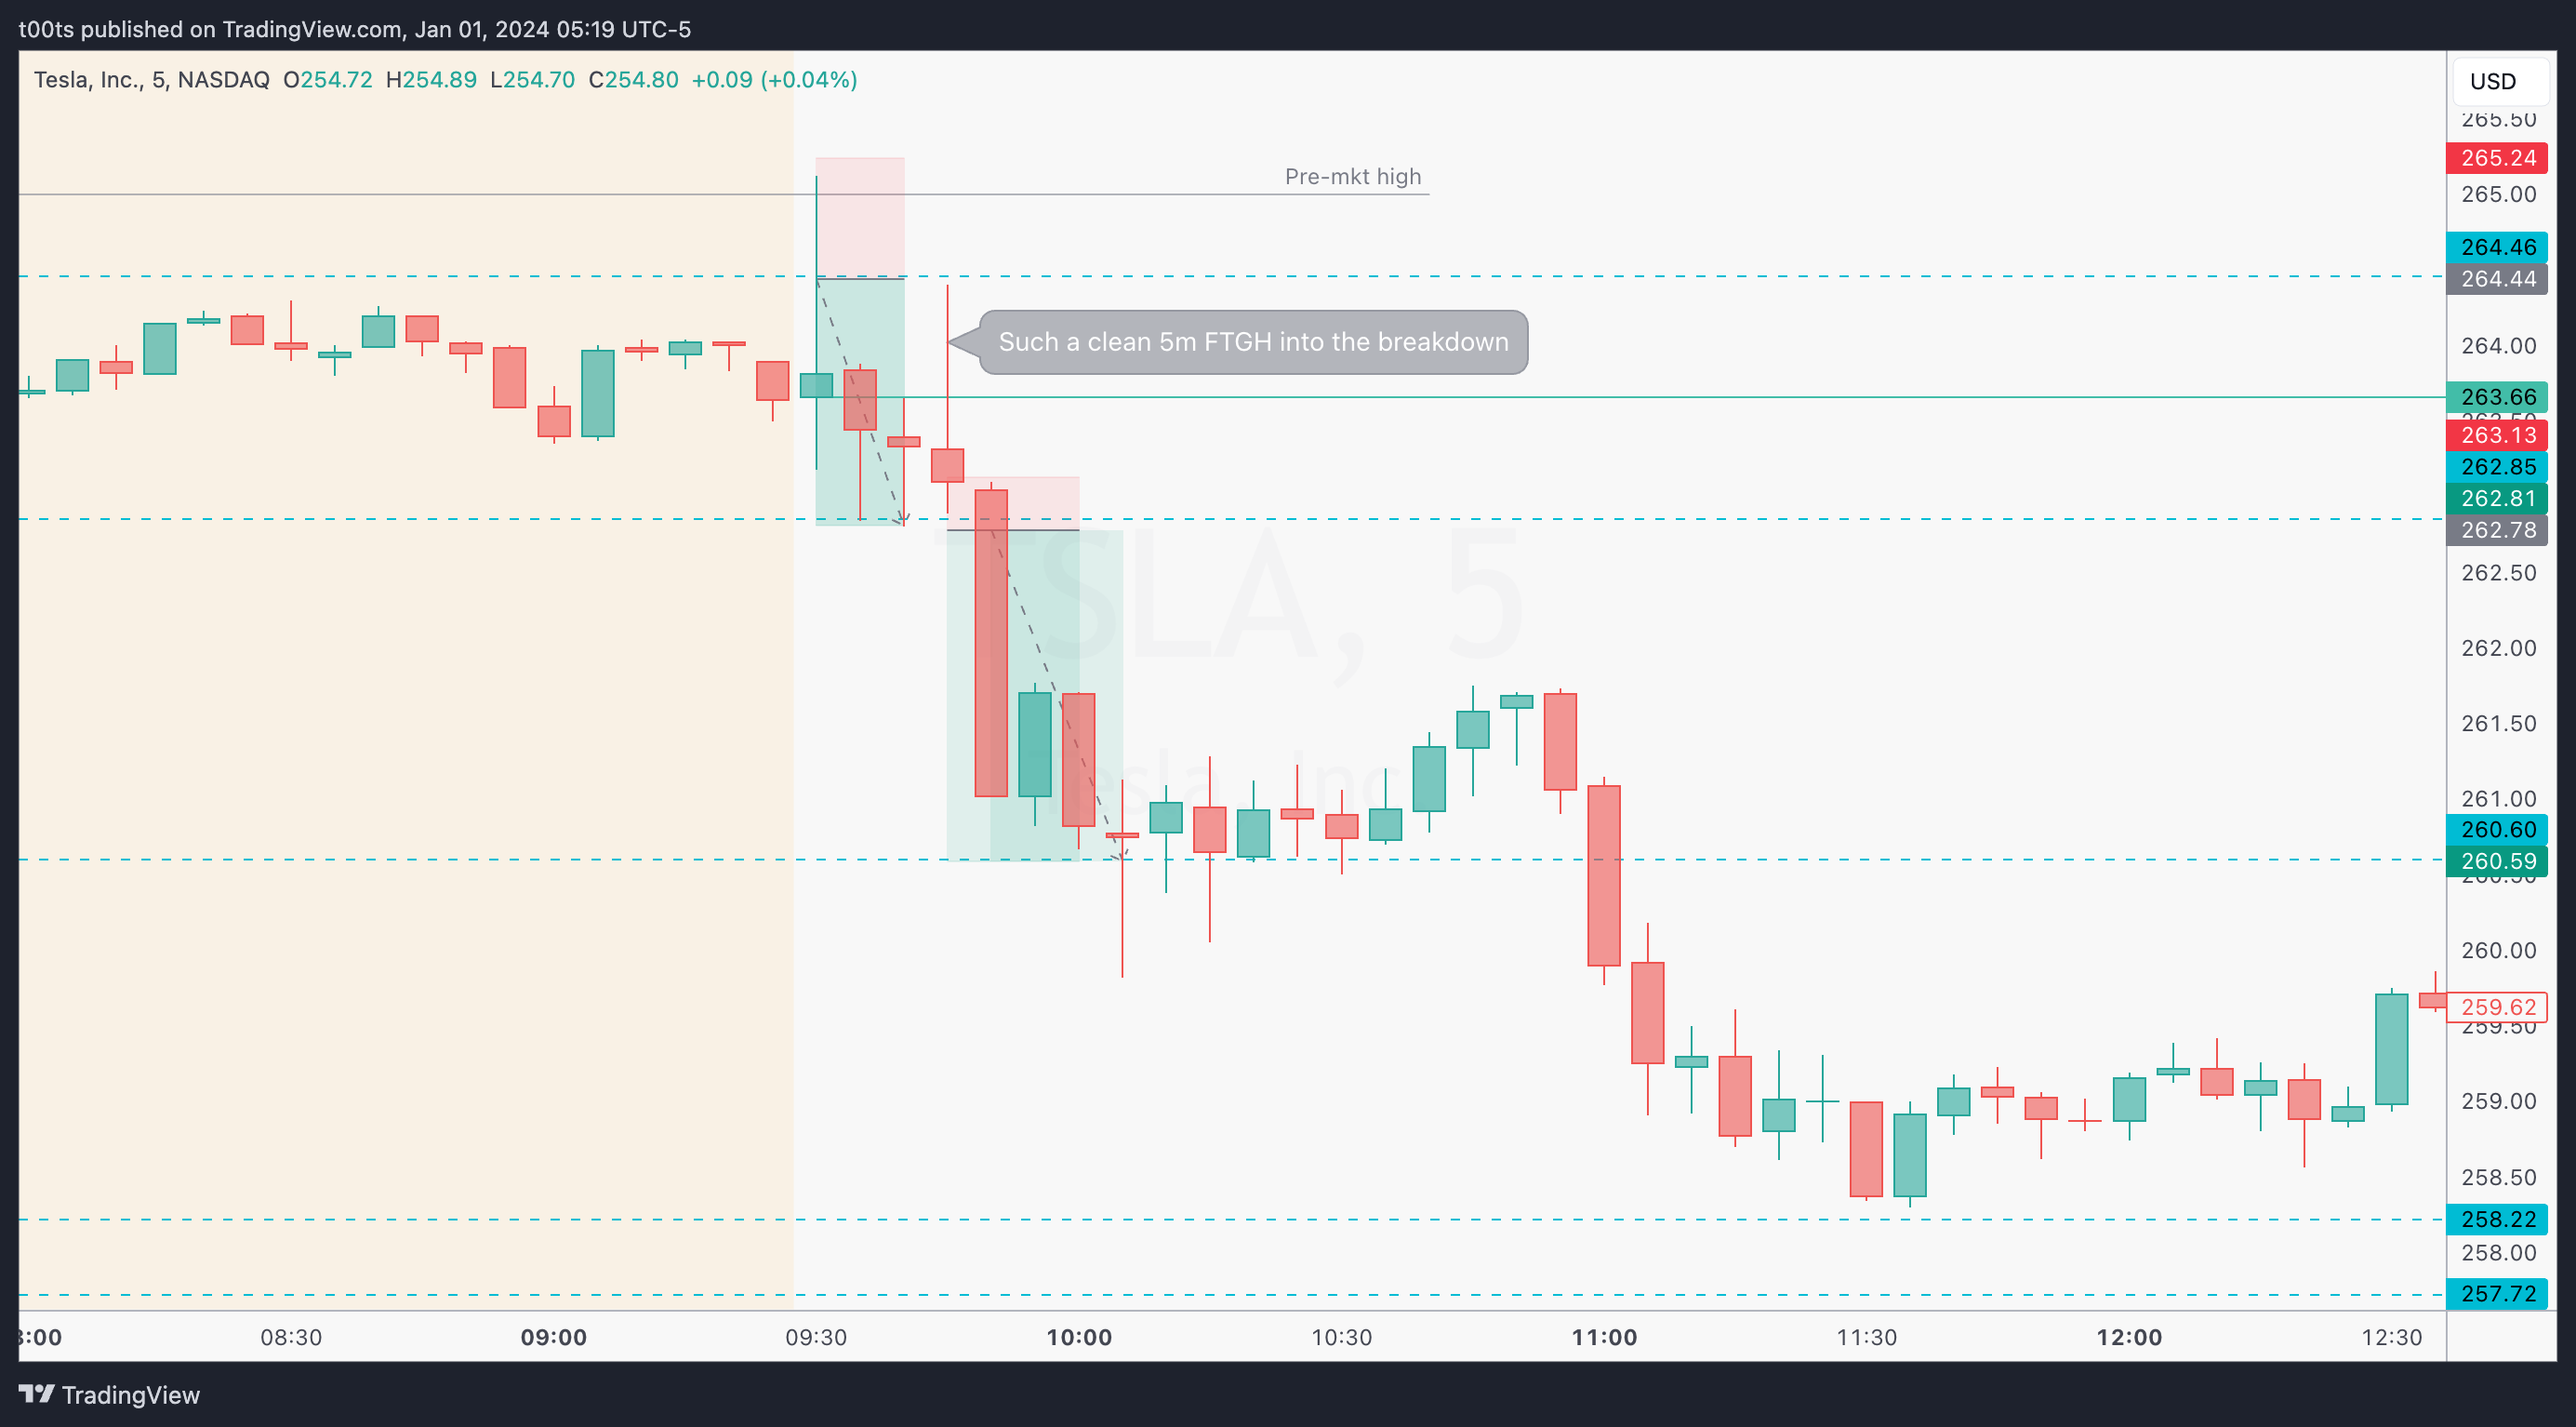
5m chart
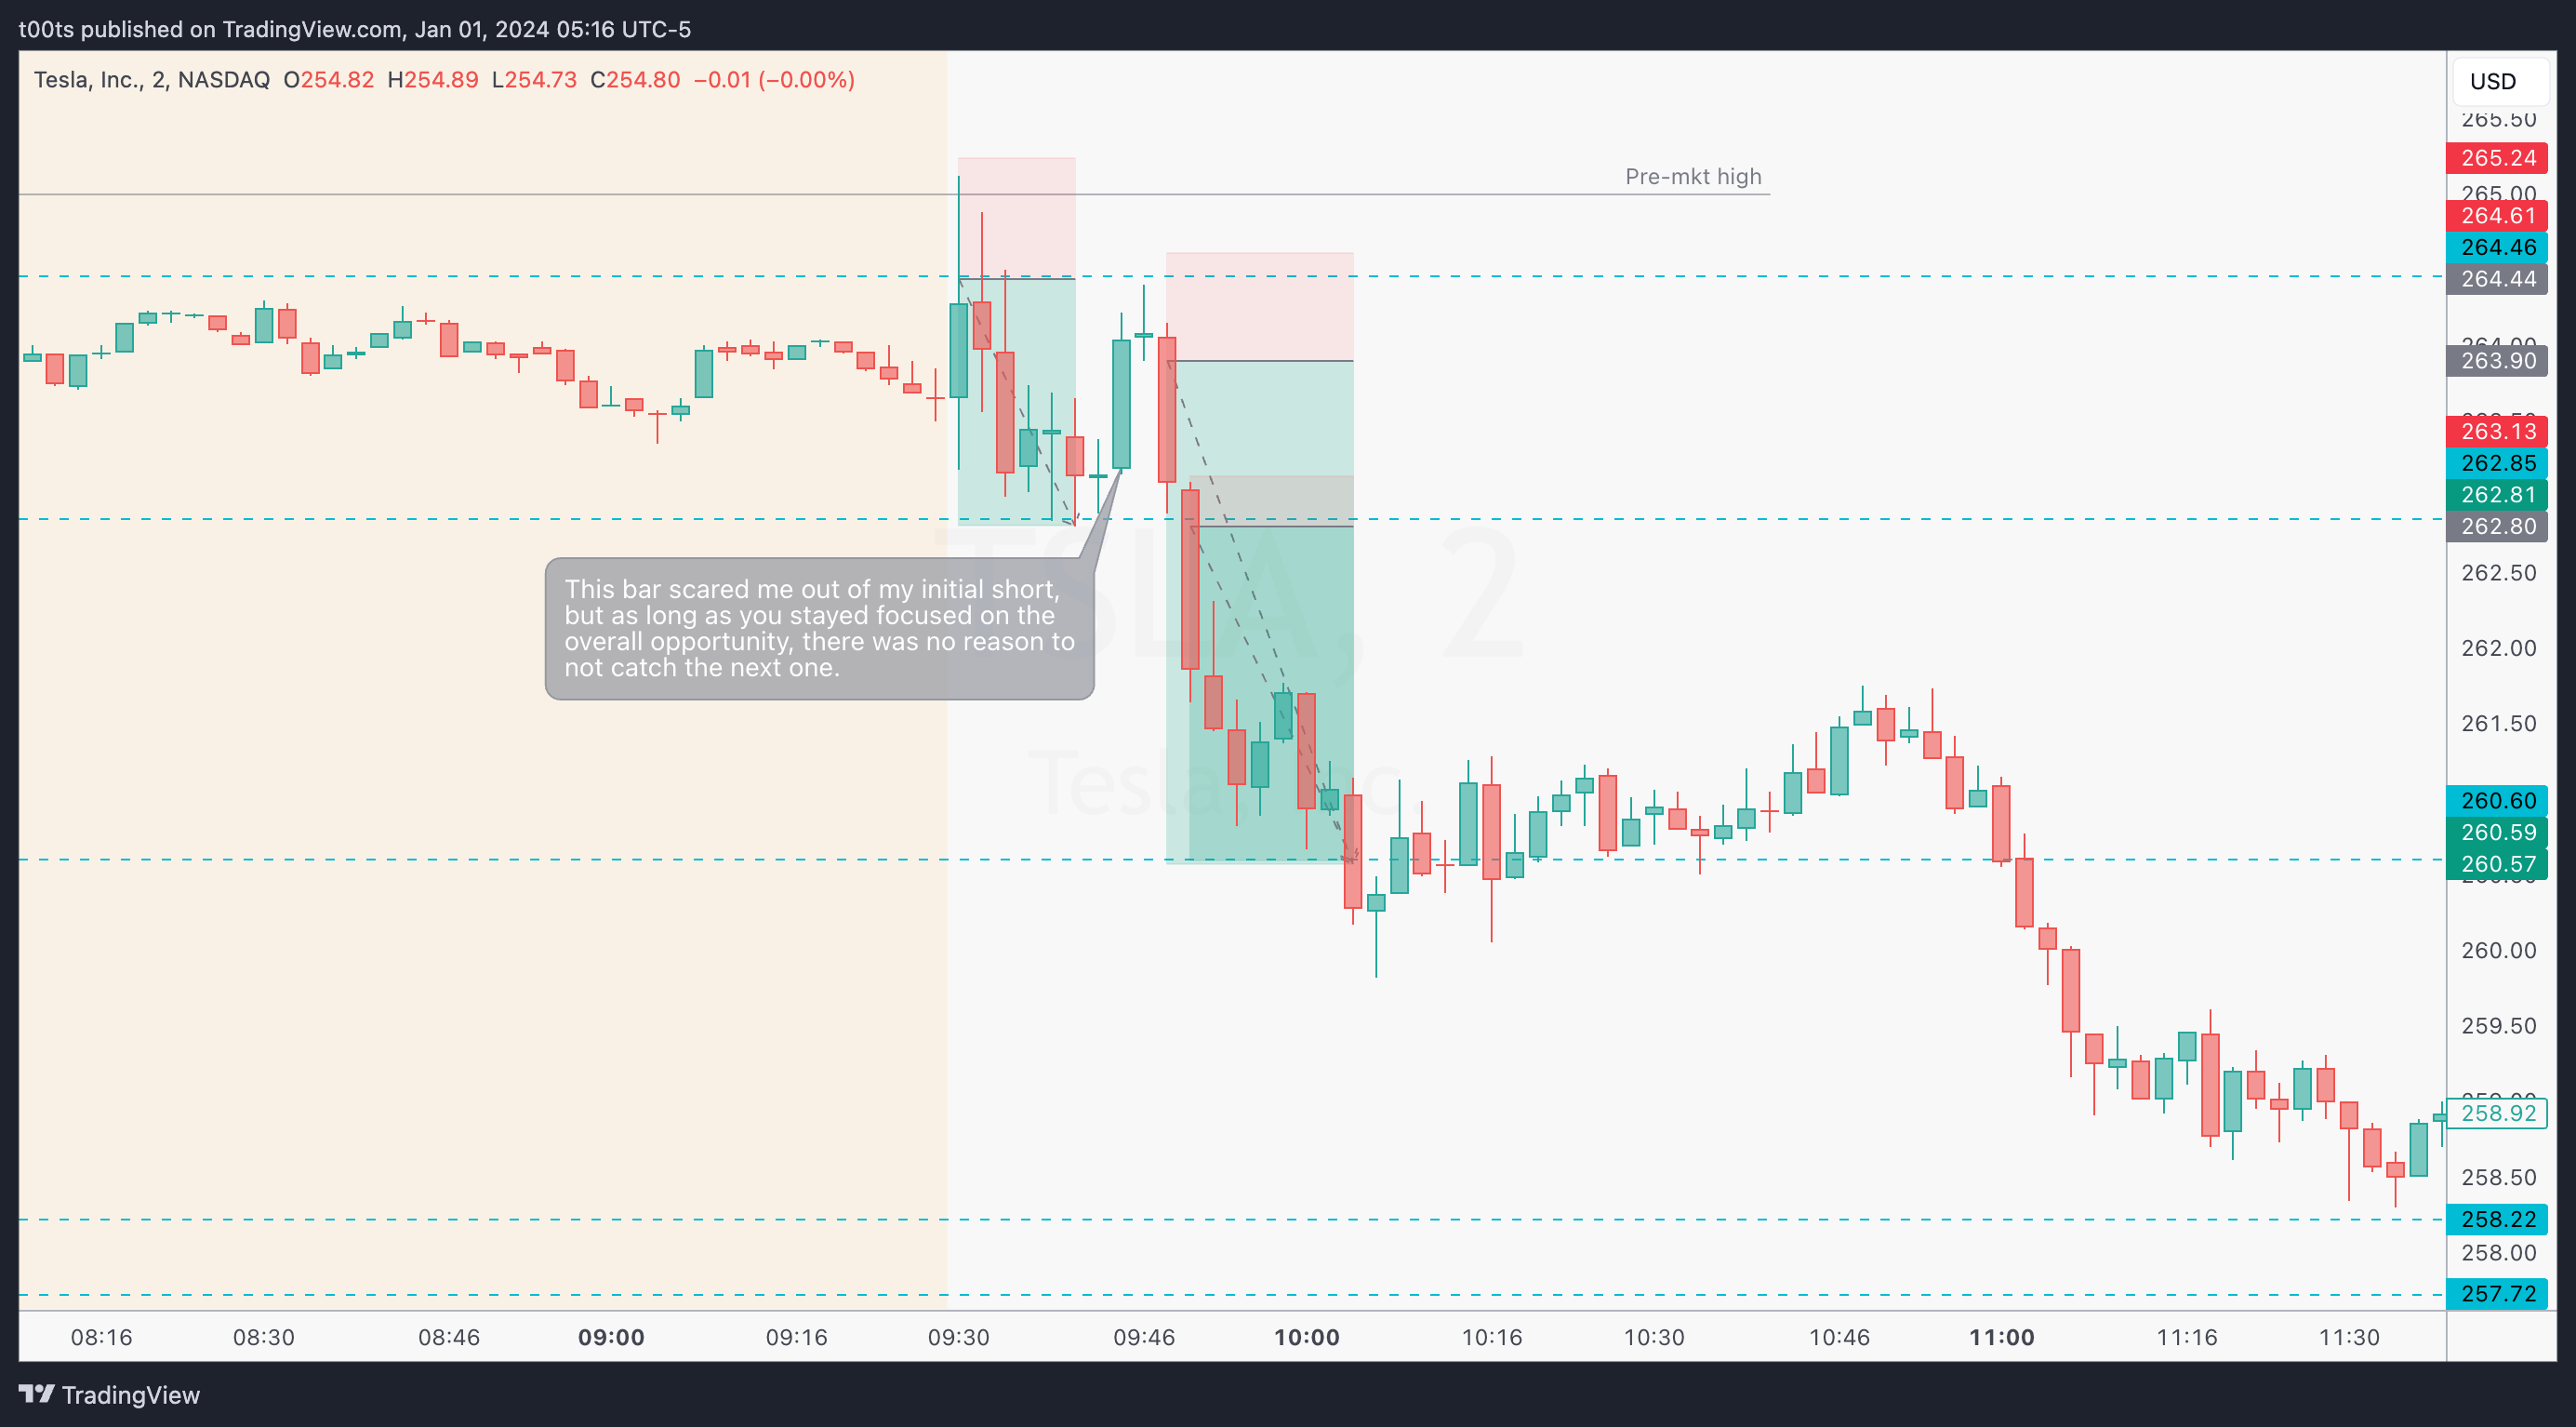
2m chart (entry detail)
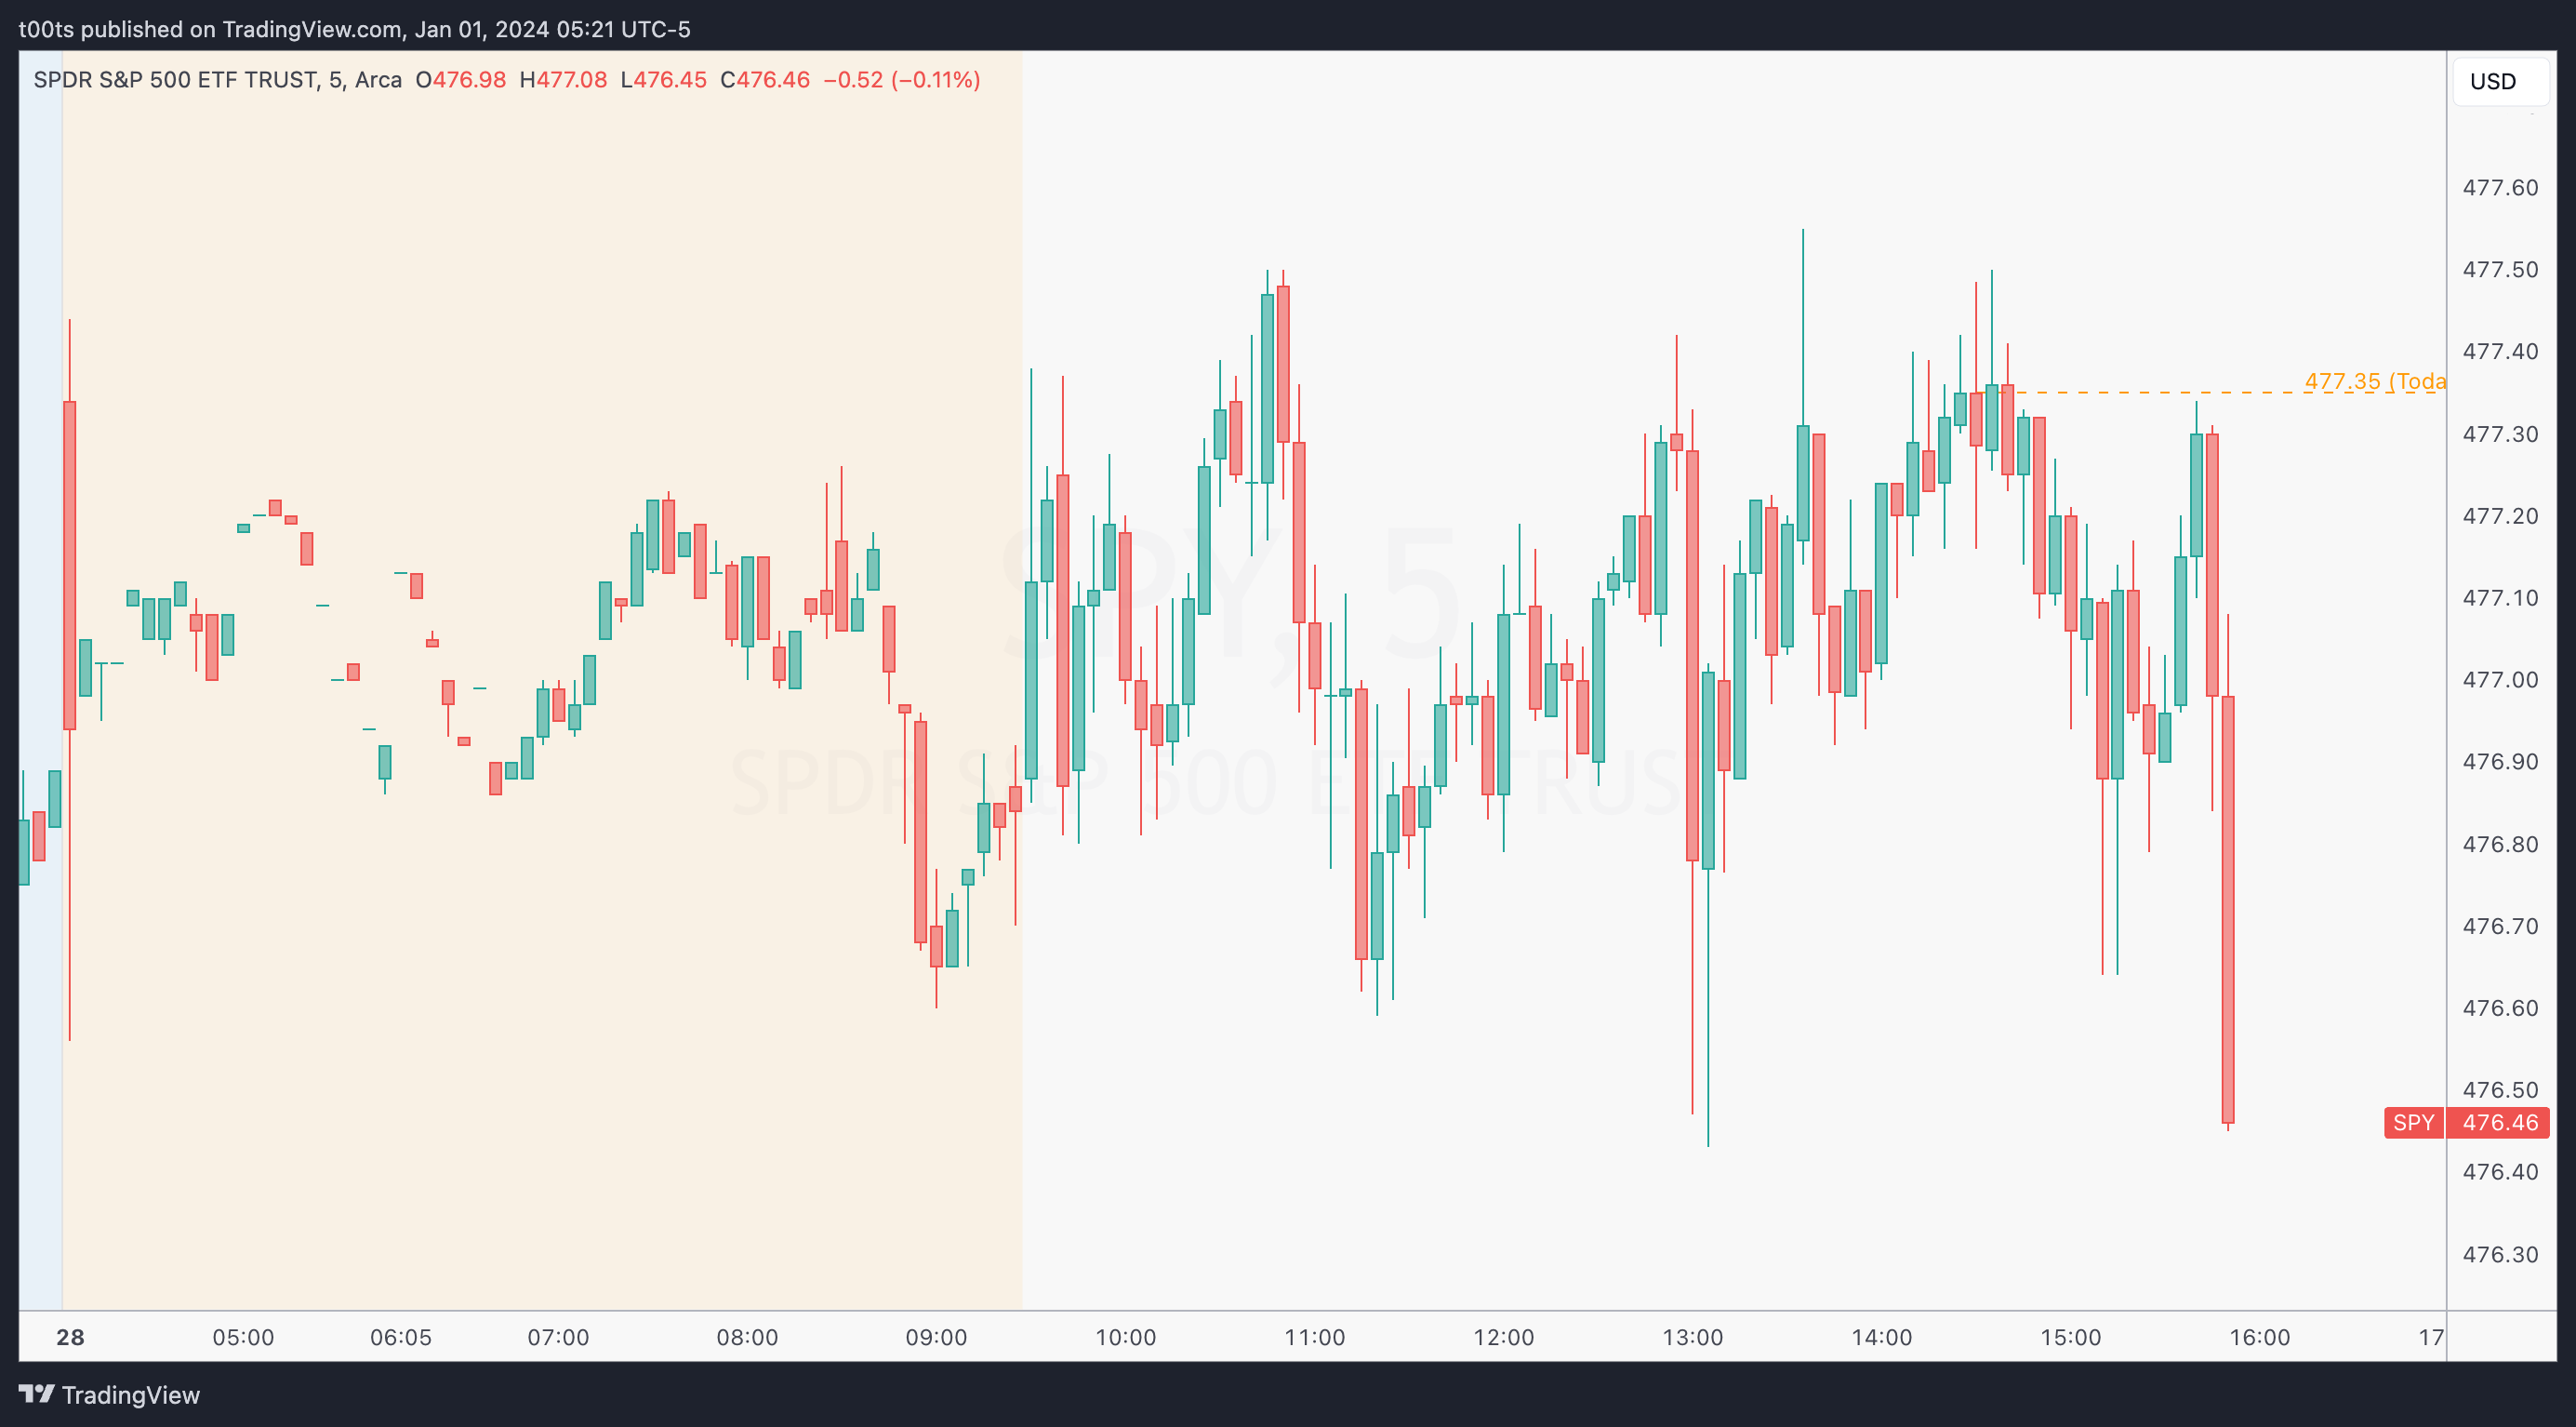
SPY 5m chart
Closing notes
Thanks to all the blind longs who trade off social media posts showing arbitrary bullish wedges and charts, TSLA was an all-day fader that day. I personally try to avoid taking trades past 11am, and I’m not the greatest holder, but those who are caught a nice bag.
I am posting one trade writeup every day throughout 2024. I focus on large caps using levels and price action. The subscription is absolutely free and will always be. I will strive to provide value by offering clues and ideas for you to enhance your edge. Let’s grow together!
Thanks for sharing!