

Higher timeframe context
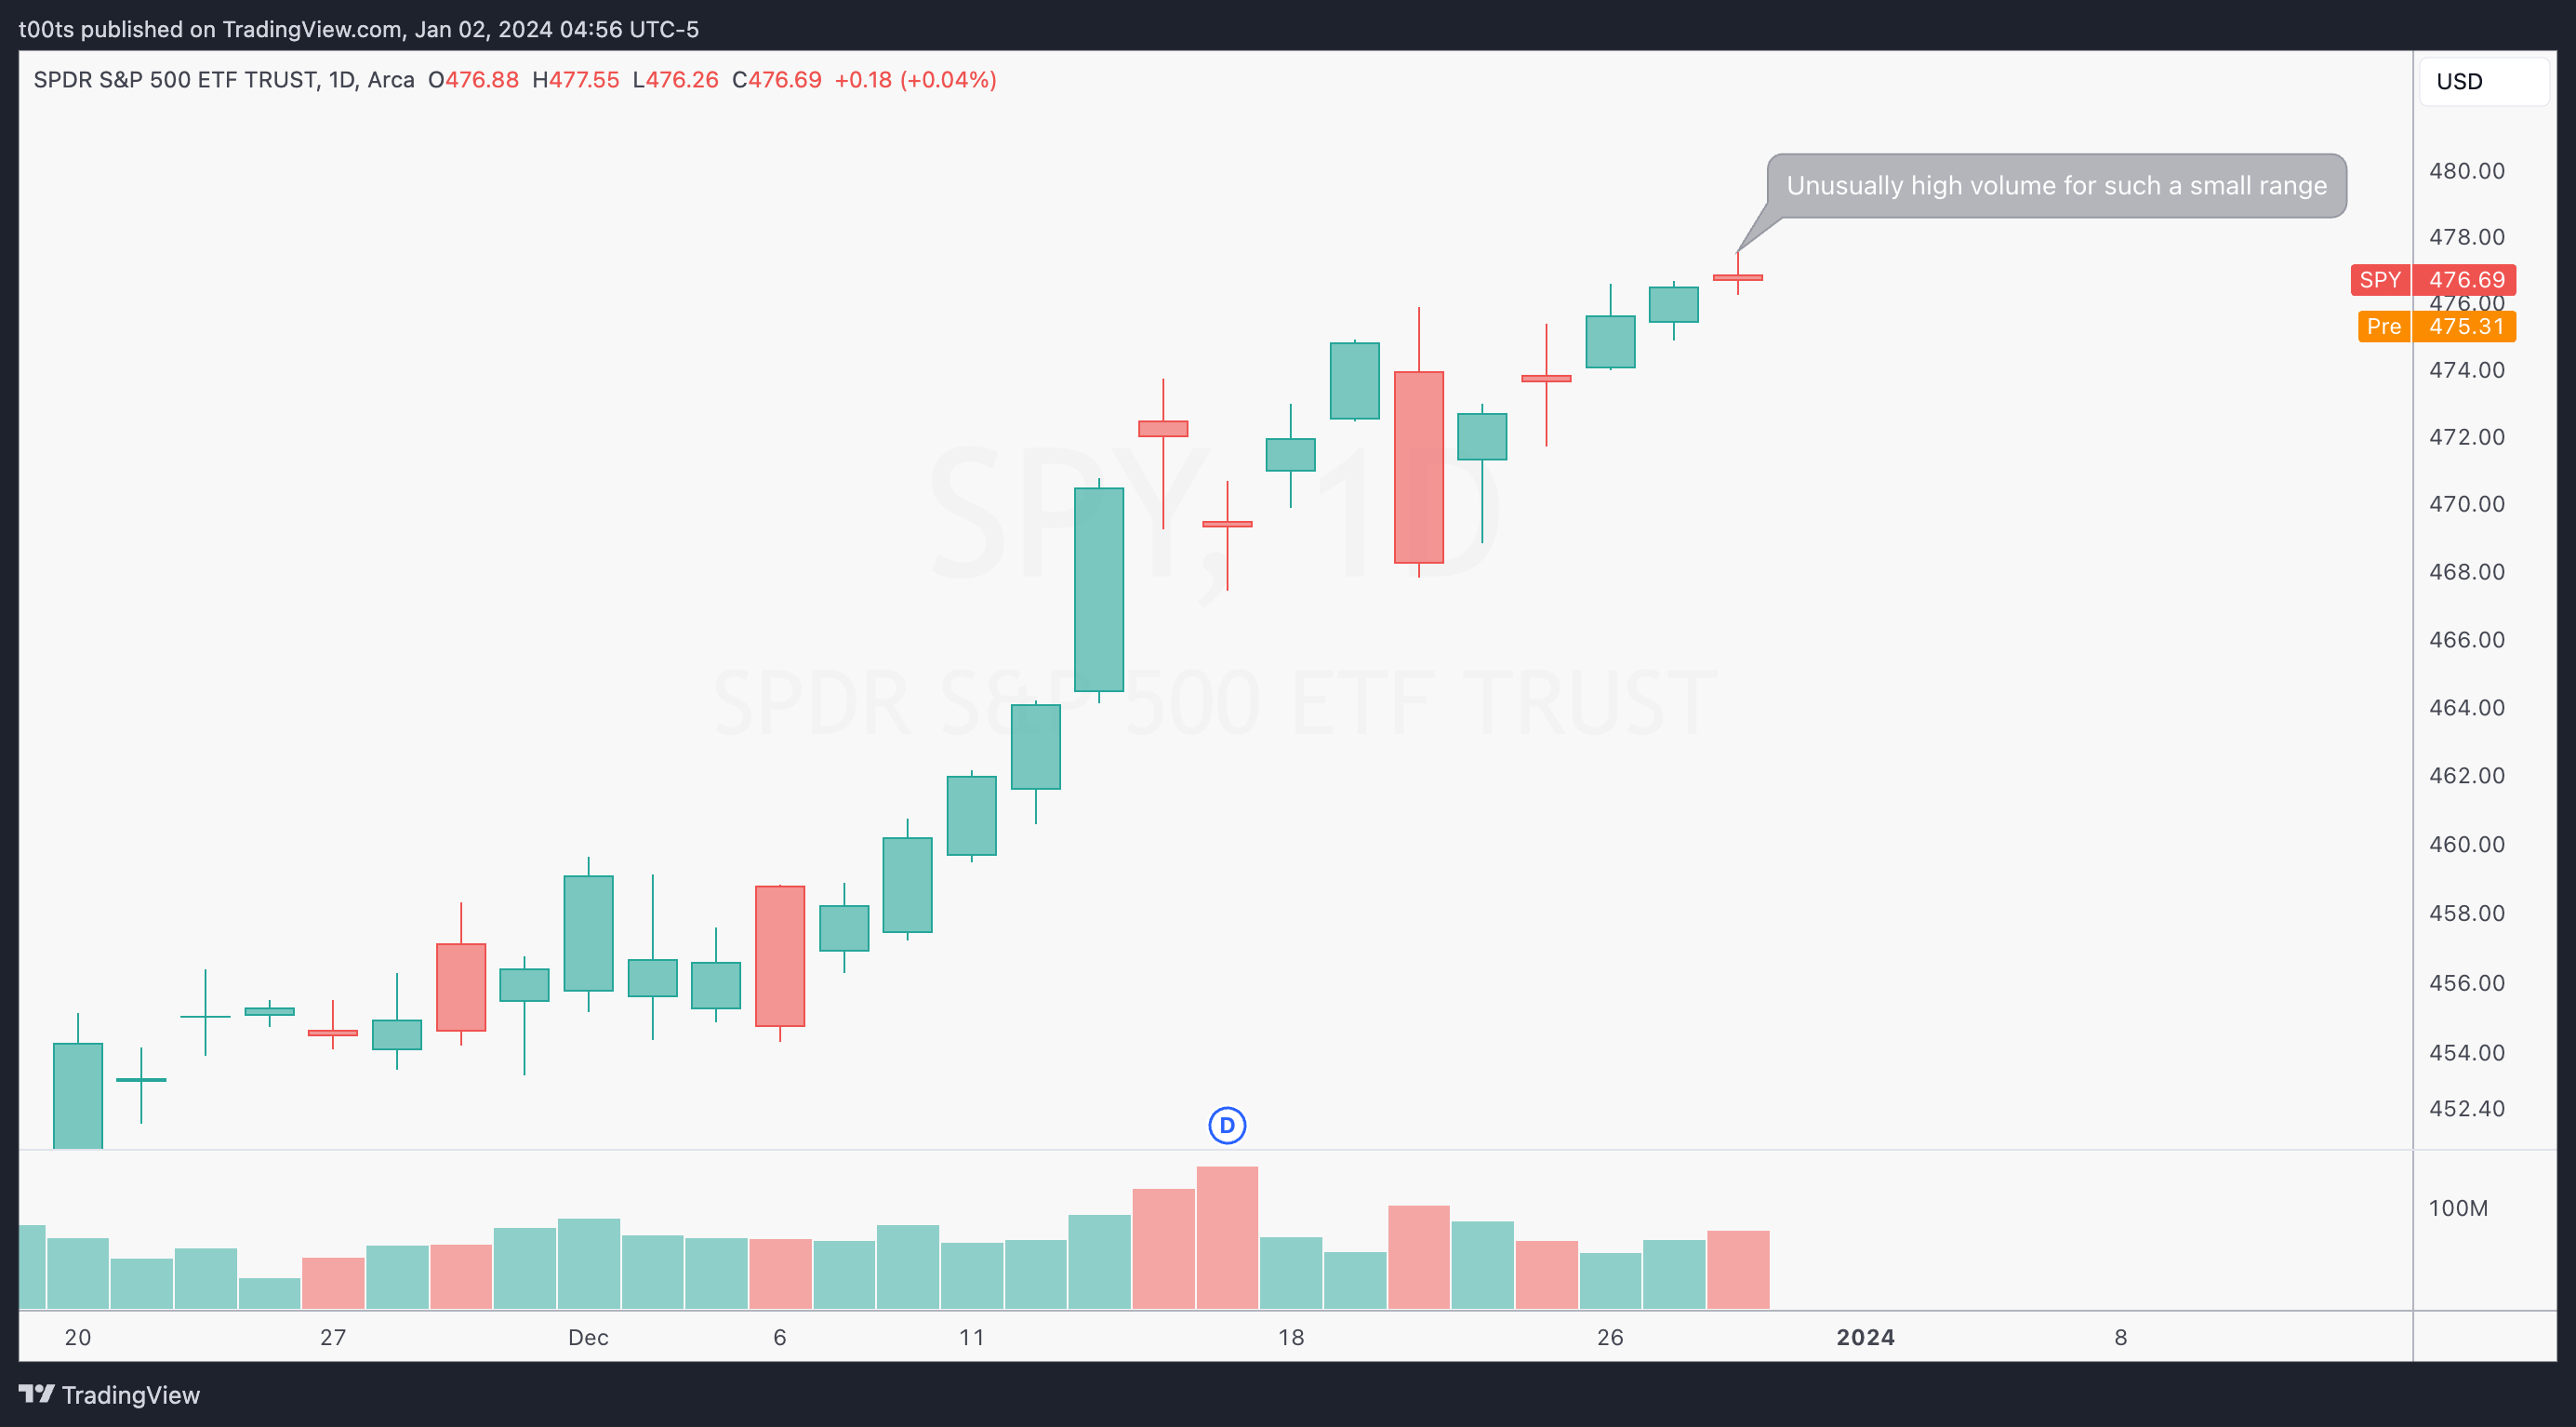
SPY has been on an absolute melt-up for the past 8 weeks. So far we haven't seen any decent pullbacks. It's also the last day of the year so not expecting too much volume. Regardless, yesterday’s daily bar is a small doji with unusually high volume, which makes us consider the possibility of an end-of-year “tax harvesting” dump.
Daily chart
Hourly chart
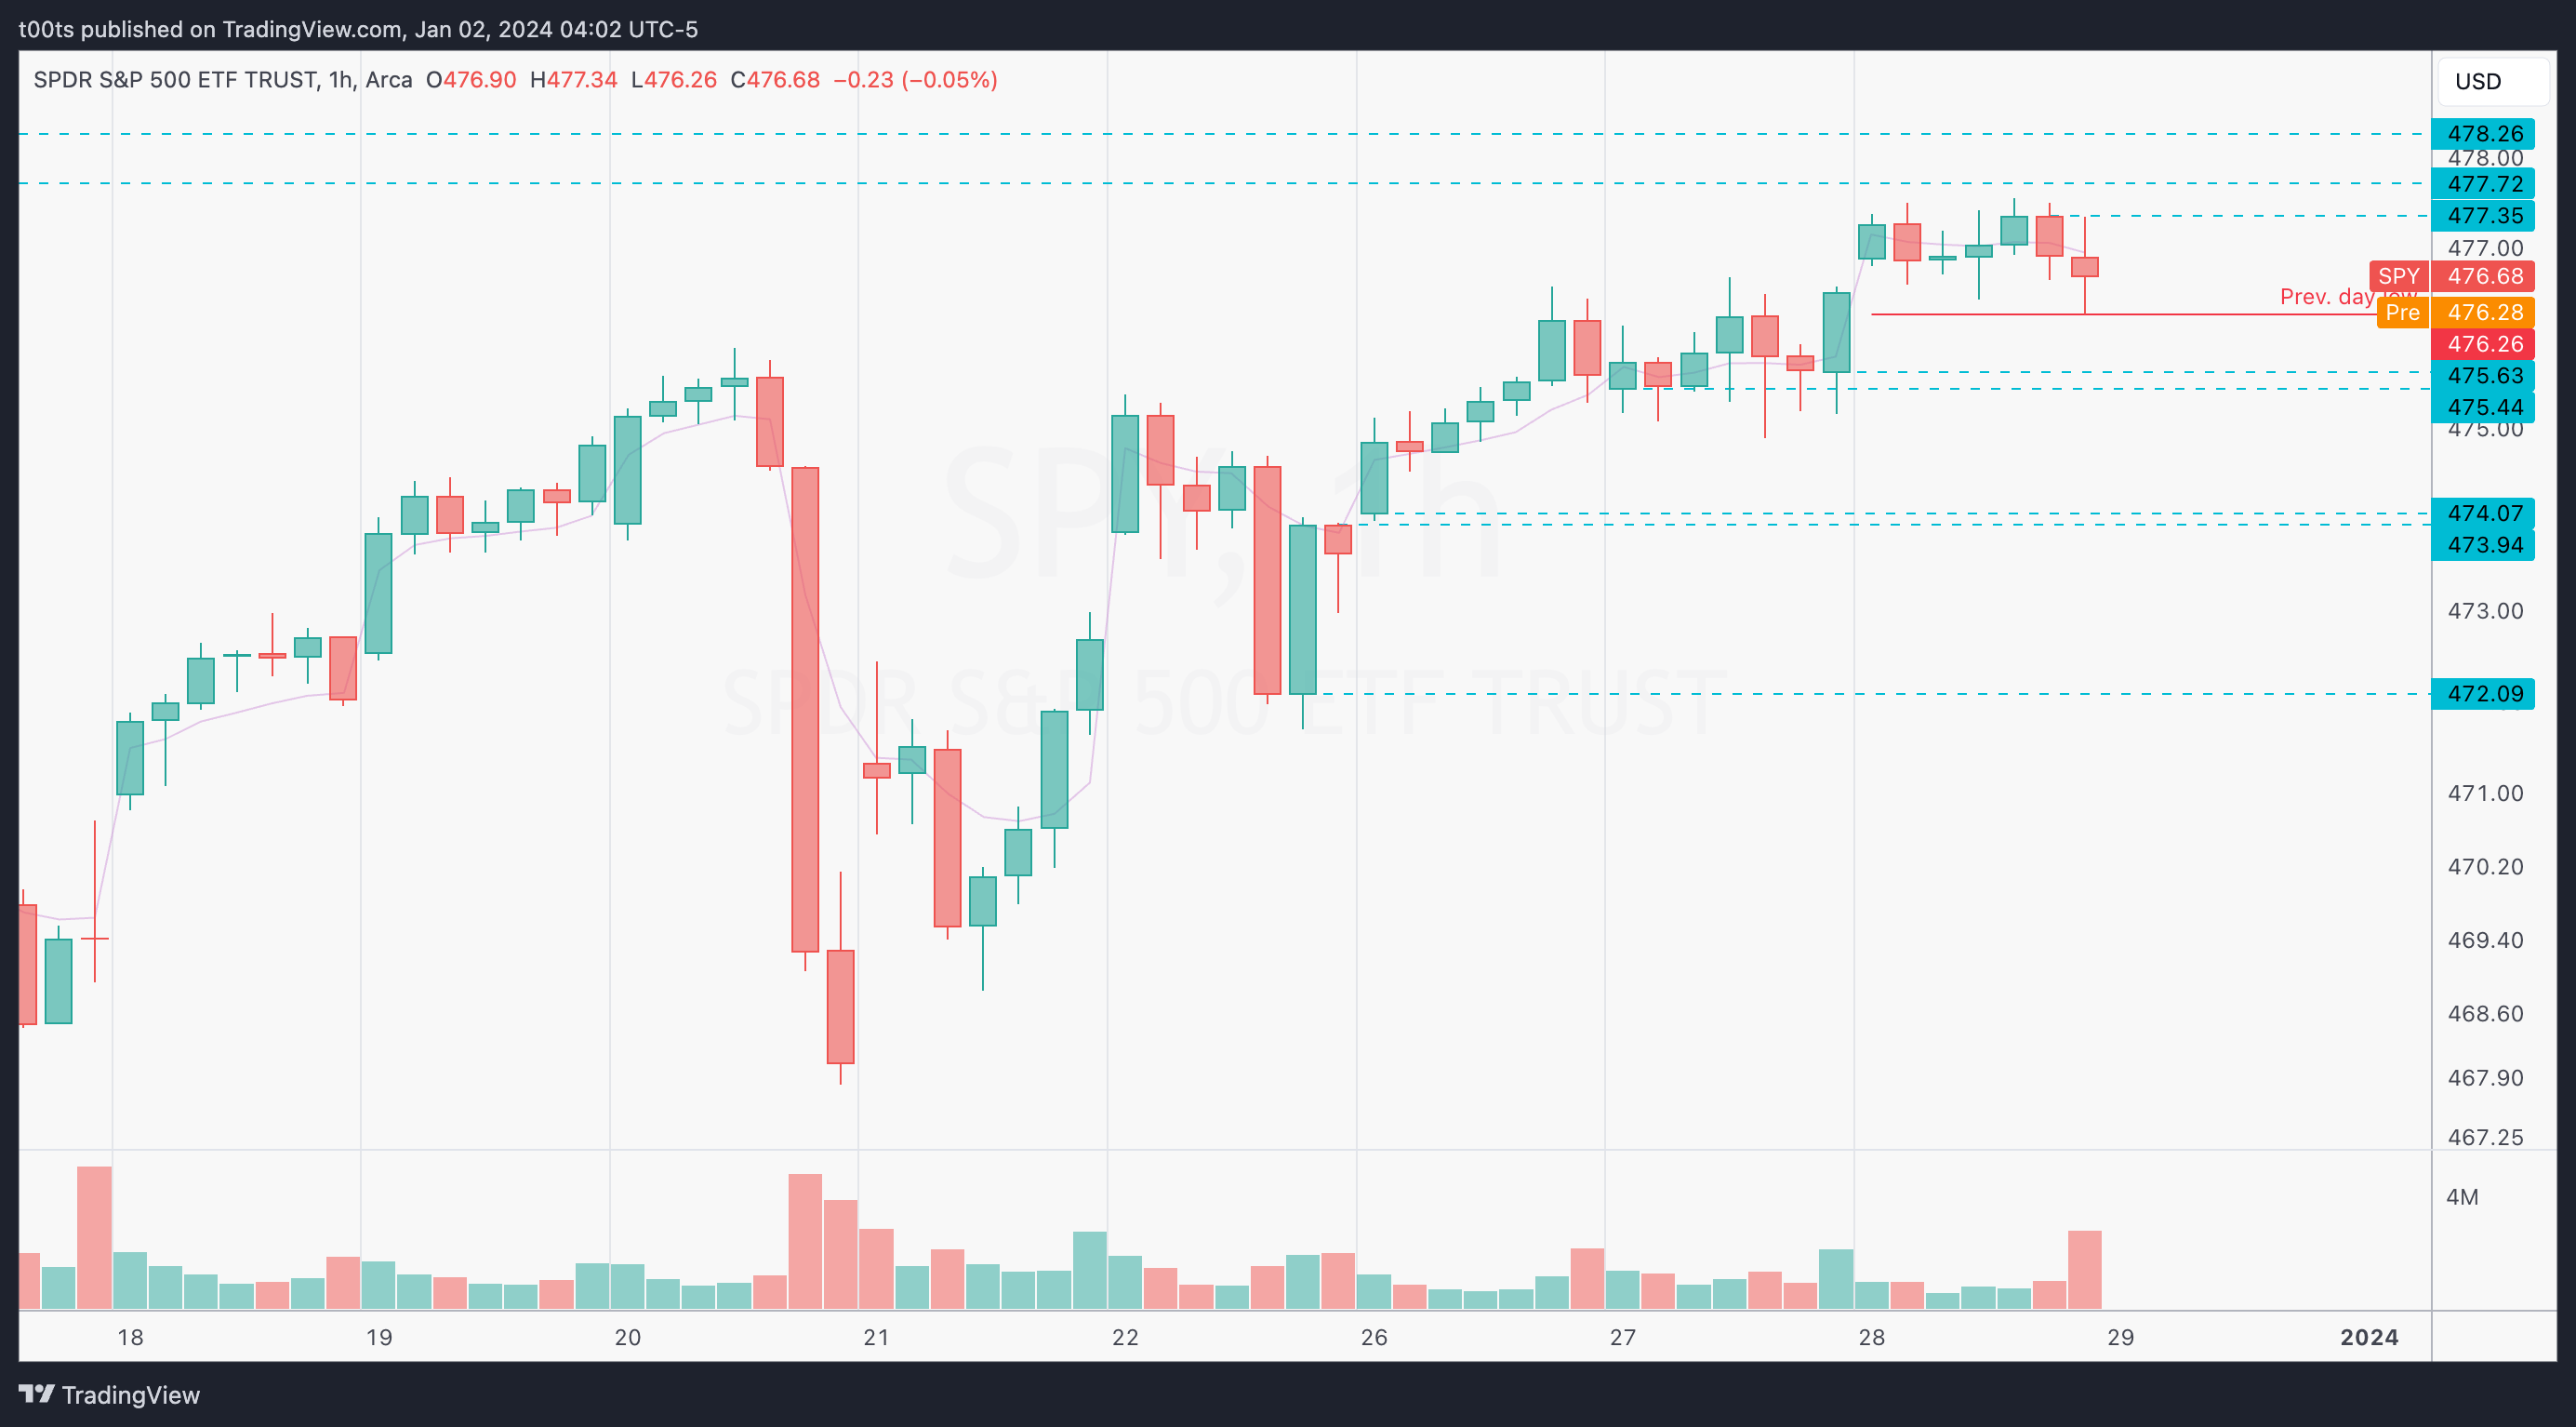
The hourly chart shows a healthy uptrend. Here we can appreciate more details on yesterday's recent action. We observe that we barely managed to hold above previous day's highs, and essentially chopped around all day ending in a weak close.
Pre-market action
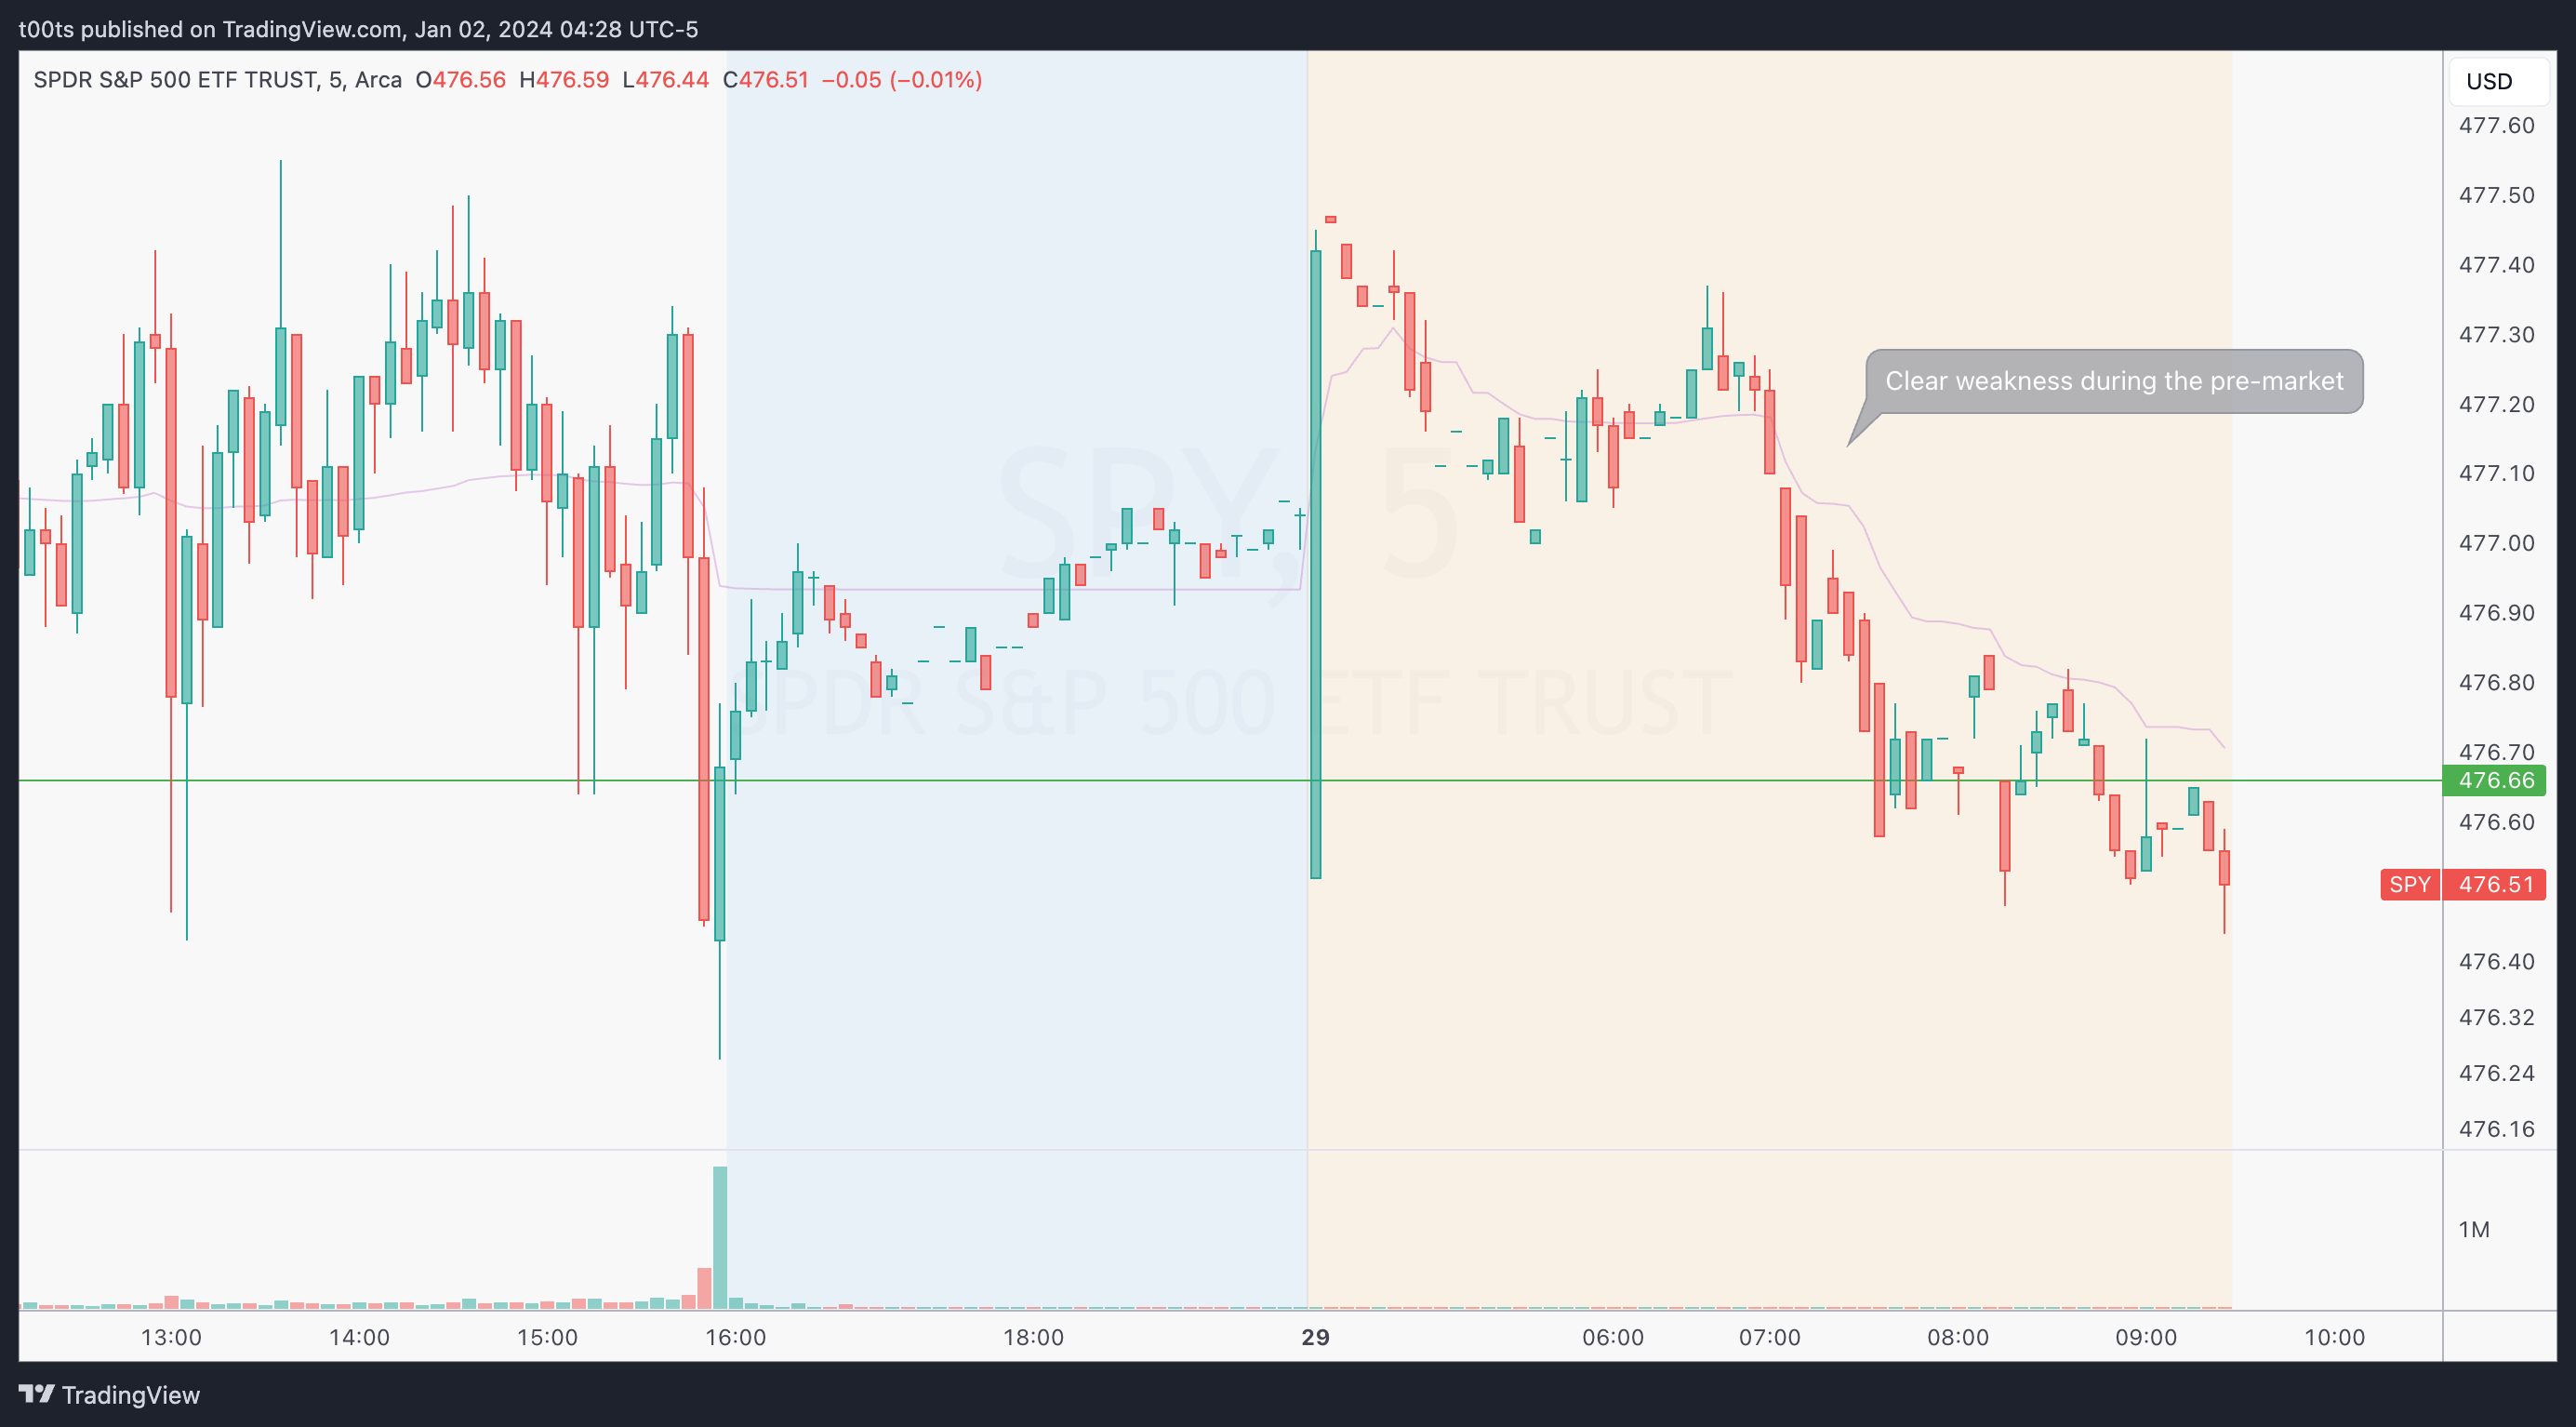
I don't usually trade SPY that much, especially on an expected low-volume day, but this pre-market action would catch my attention. The overnight gap fails to hold, leading to a pre-market downtrend that takes us right into market open.
The trade
The theme of this trade was patience. Just being able to sit there waiting for the right clues. Let’s go over it.
Cue
Weak action pre-market
Failure to go higher at the top of the intraday range, with a nice 5m reversal bar
Plan
Look for the range to break down and find entries below the open, risking against the opening print.
Trigger
Price breaking the lows of a bearish signal bar*
5m chart
2m chart (entry detail)
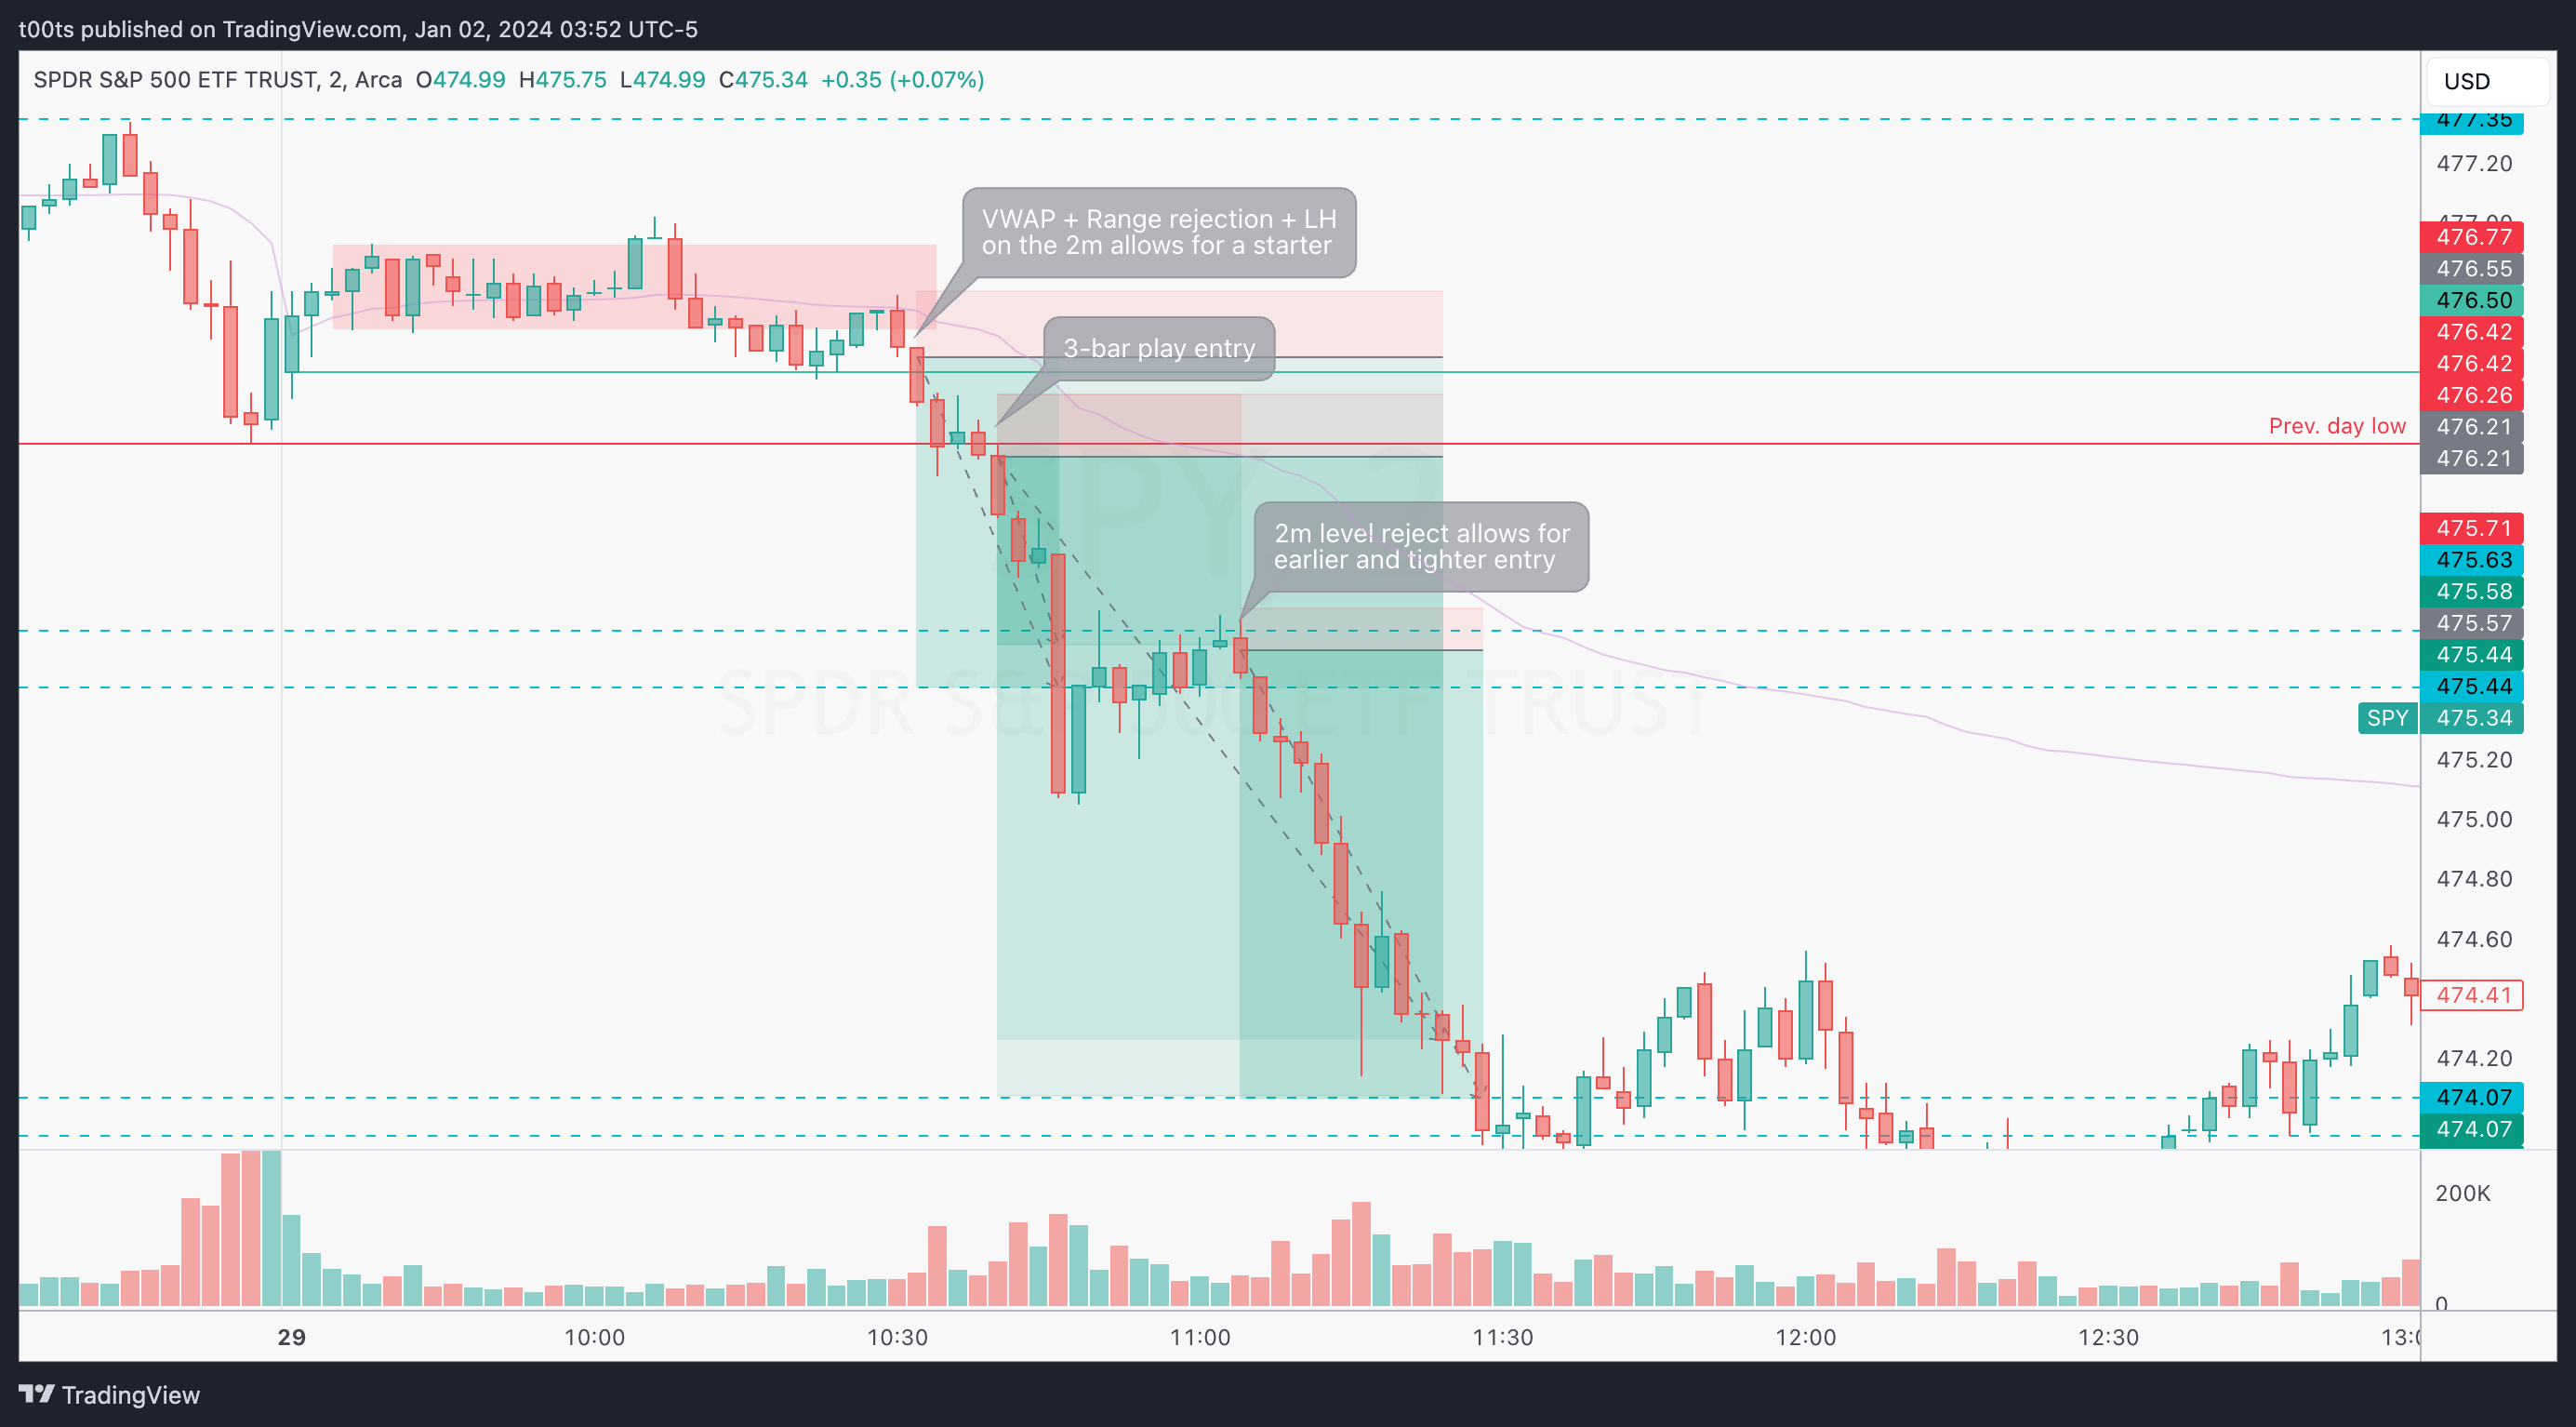
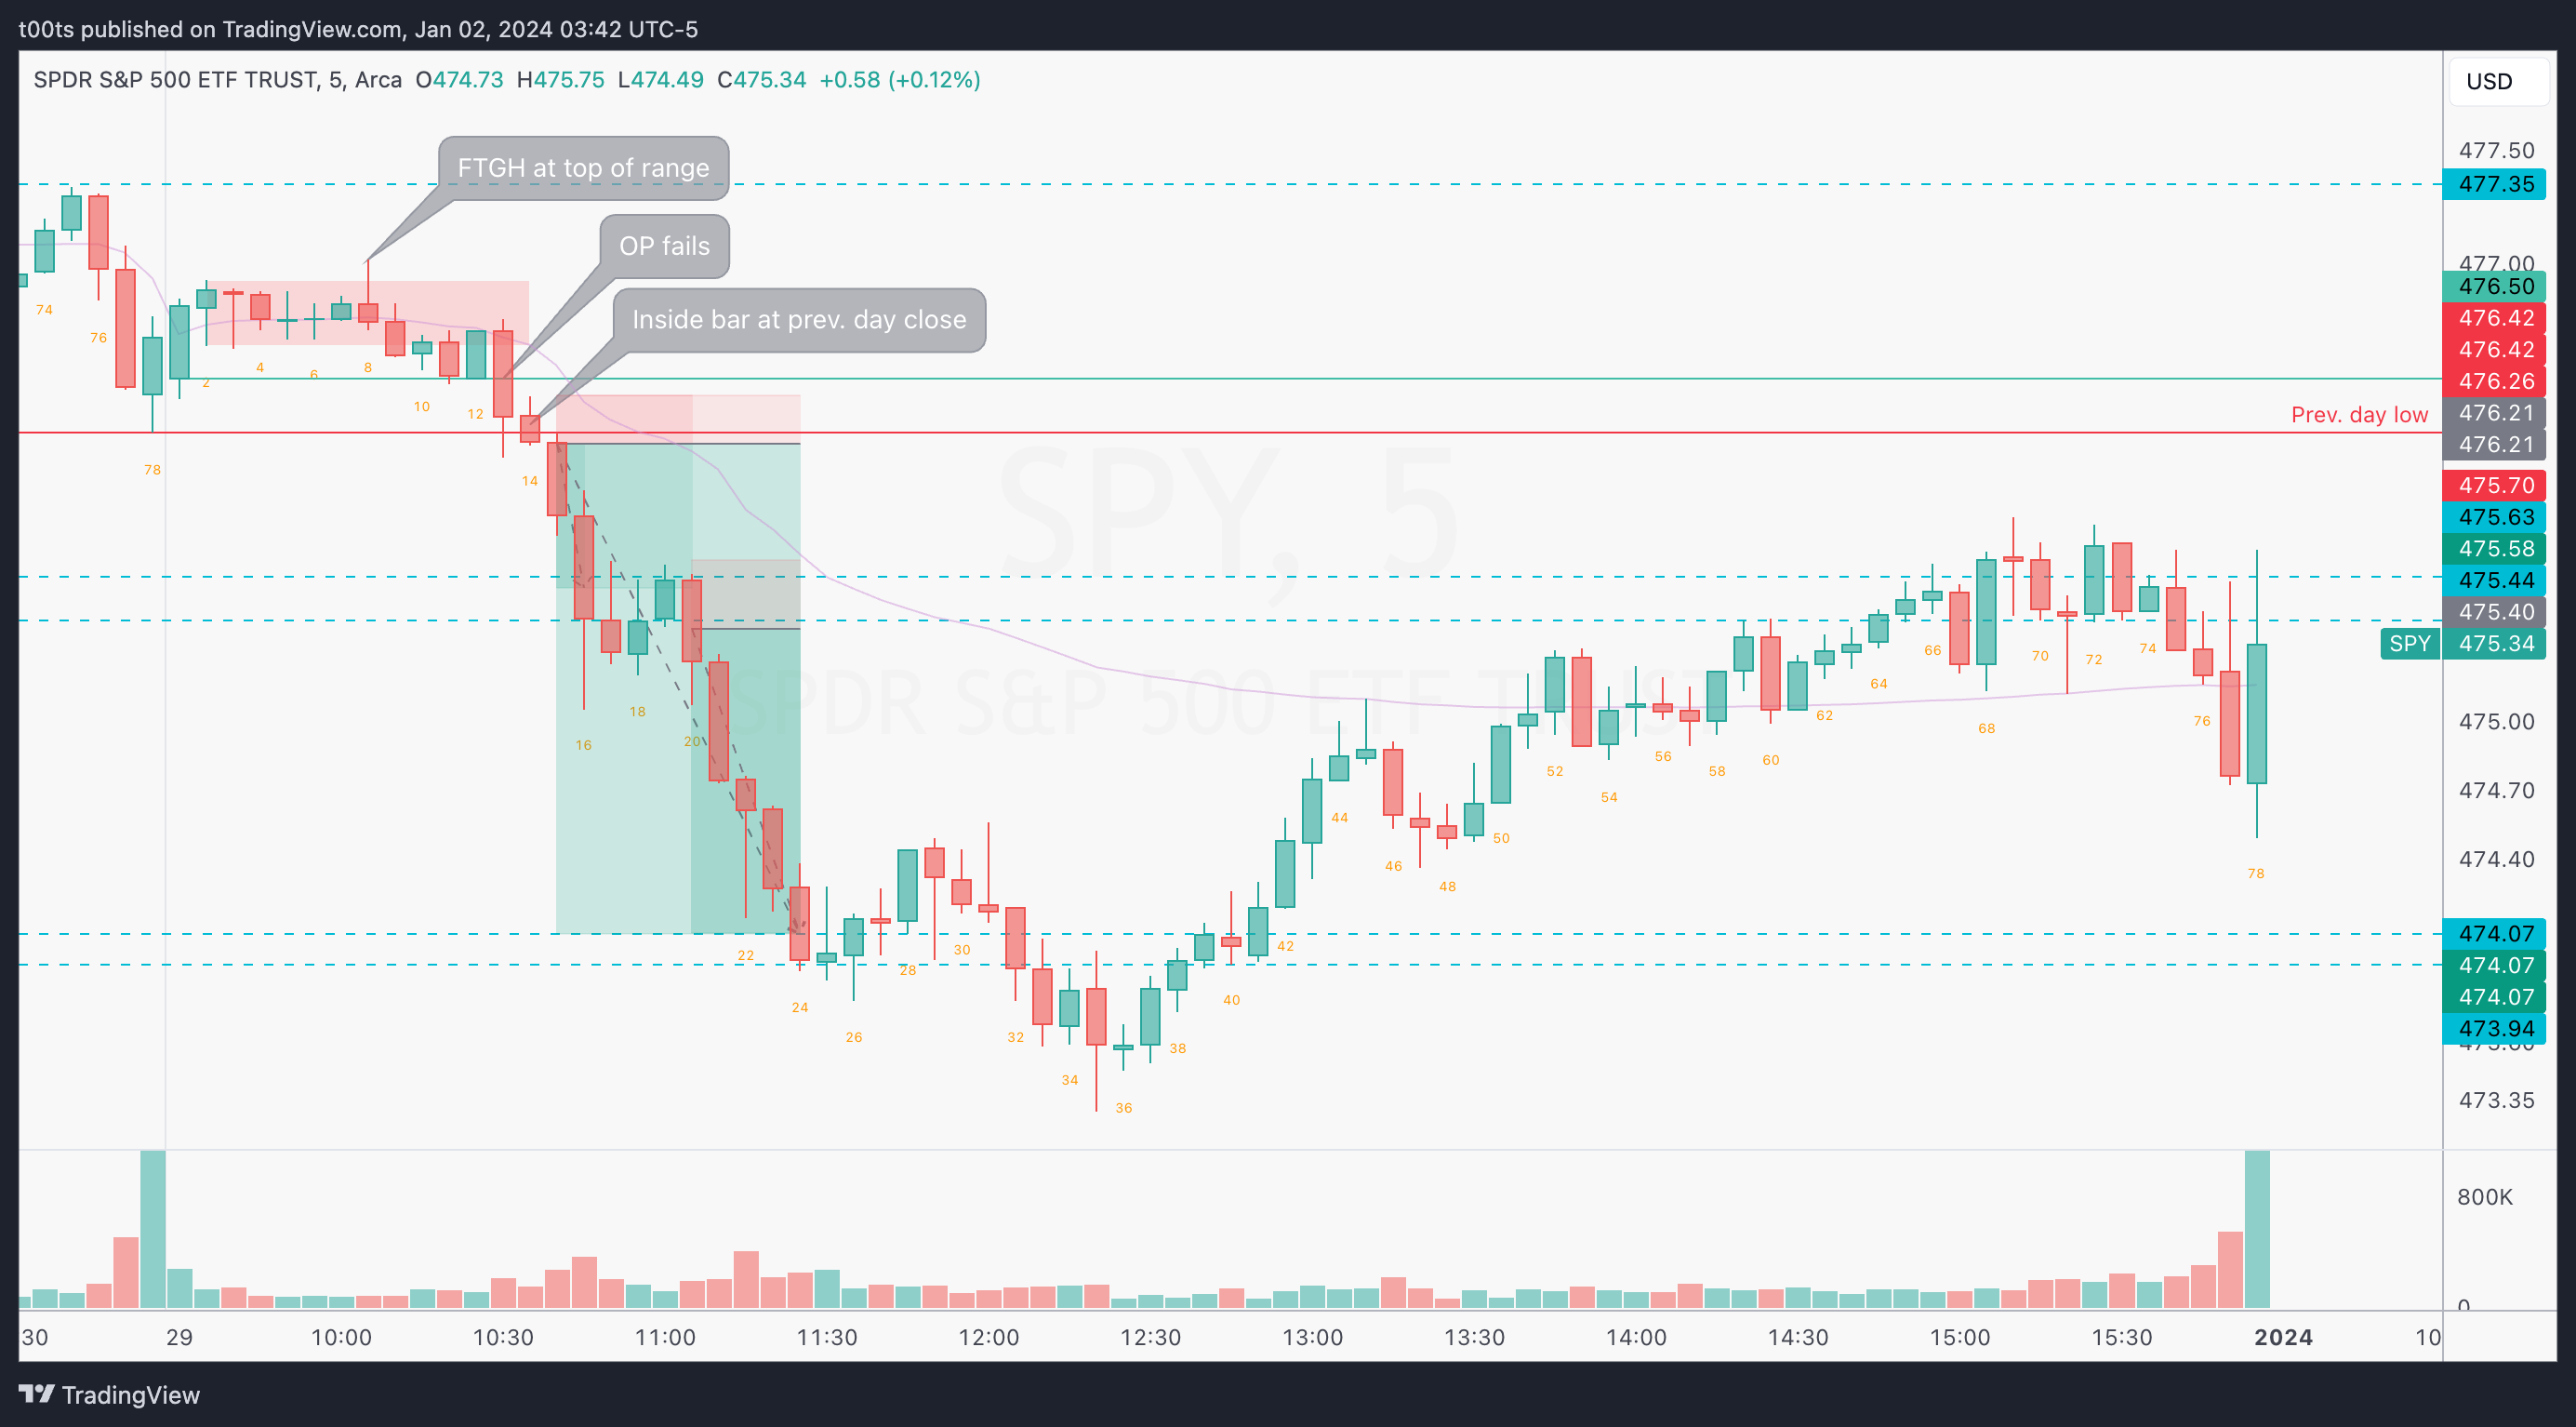
*Given that today our trigger is less specific than usual, let's go over a few favorable opportunities this chart offered:
Bar 8 is our intraday cue. Price tries to break out from the range and fails with a beautiful 5m reversal bar.
In Bar 13 price rejects both the bottom of the range and the VWAP, closing below the opening print for the first time that day. So now we're looking for entries.
Bar 14 is a very convenient inside bar closing slightly below previous day's lows, offering a great R:R entry to get involved in the short targeting the level below with a stop above it's highs. If we peek at the 2m chart, there's a bearish 3-bar play at that time, giving us further confirmation for our entry.
Bar 17-19 show a classic bear flag. What stands out here is that price fails to reclaim the $475.63 level. Further downside is expected.
Bar 20 offers a new trade (or a chance to add if we're holding runners), with an entry one tick below Bar 19's low and risking the $475.63 level. If again, we peek at the 2m chart, there is an earlier and tighter entry available that would allow us to put more size.
Closing notes
On a day where nothing was expected, the market itself offered this great opportunity. Even if you missed that first entry, the second leg offered a 10R trade. This was a trade for the patient, the observer, the meticulous. The patient hand got paid.
I am posting one trade writeup every day throughout 2024. I focus on large caps using levels and price action. The subscription is absolutely free and will always be. I will strive to provide value by offering clues and ideas for you to enhance your edge. Let’s grow together!