

Higher timeframe context
While indices like the S&P or the Nasdaq have been rallying non-stop for the past few months, the Russell is still trapped in a multi-year range. However, due to current price action, I find this long trade way more attractive than any of its overextended peers.
Weekly chart
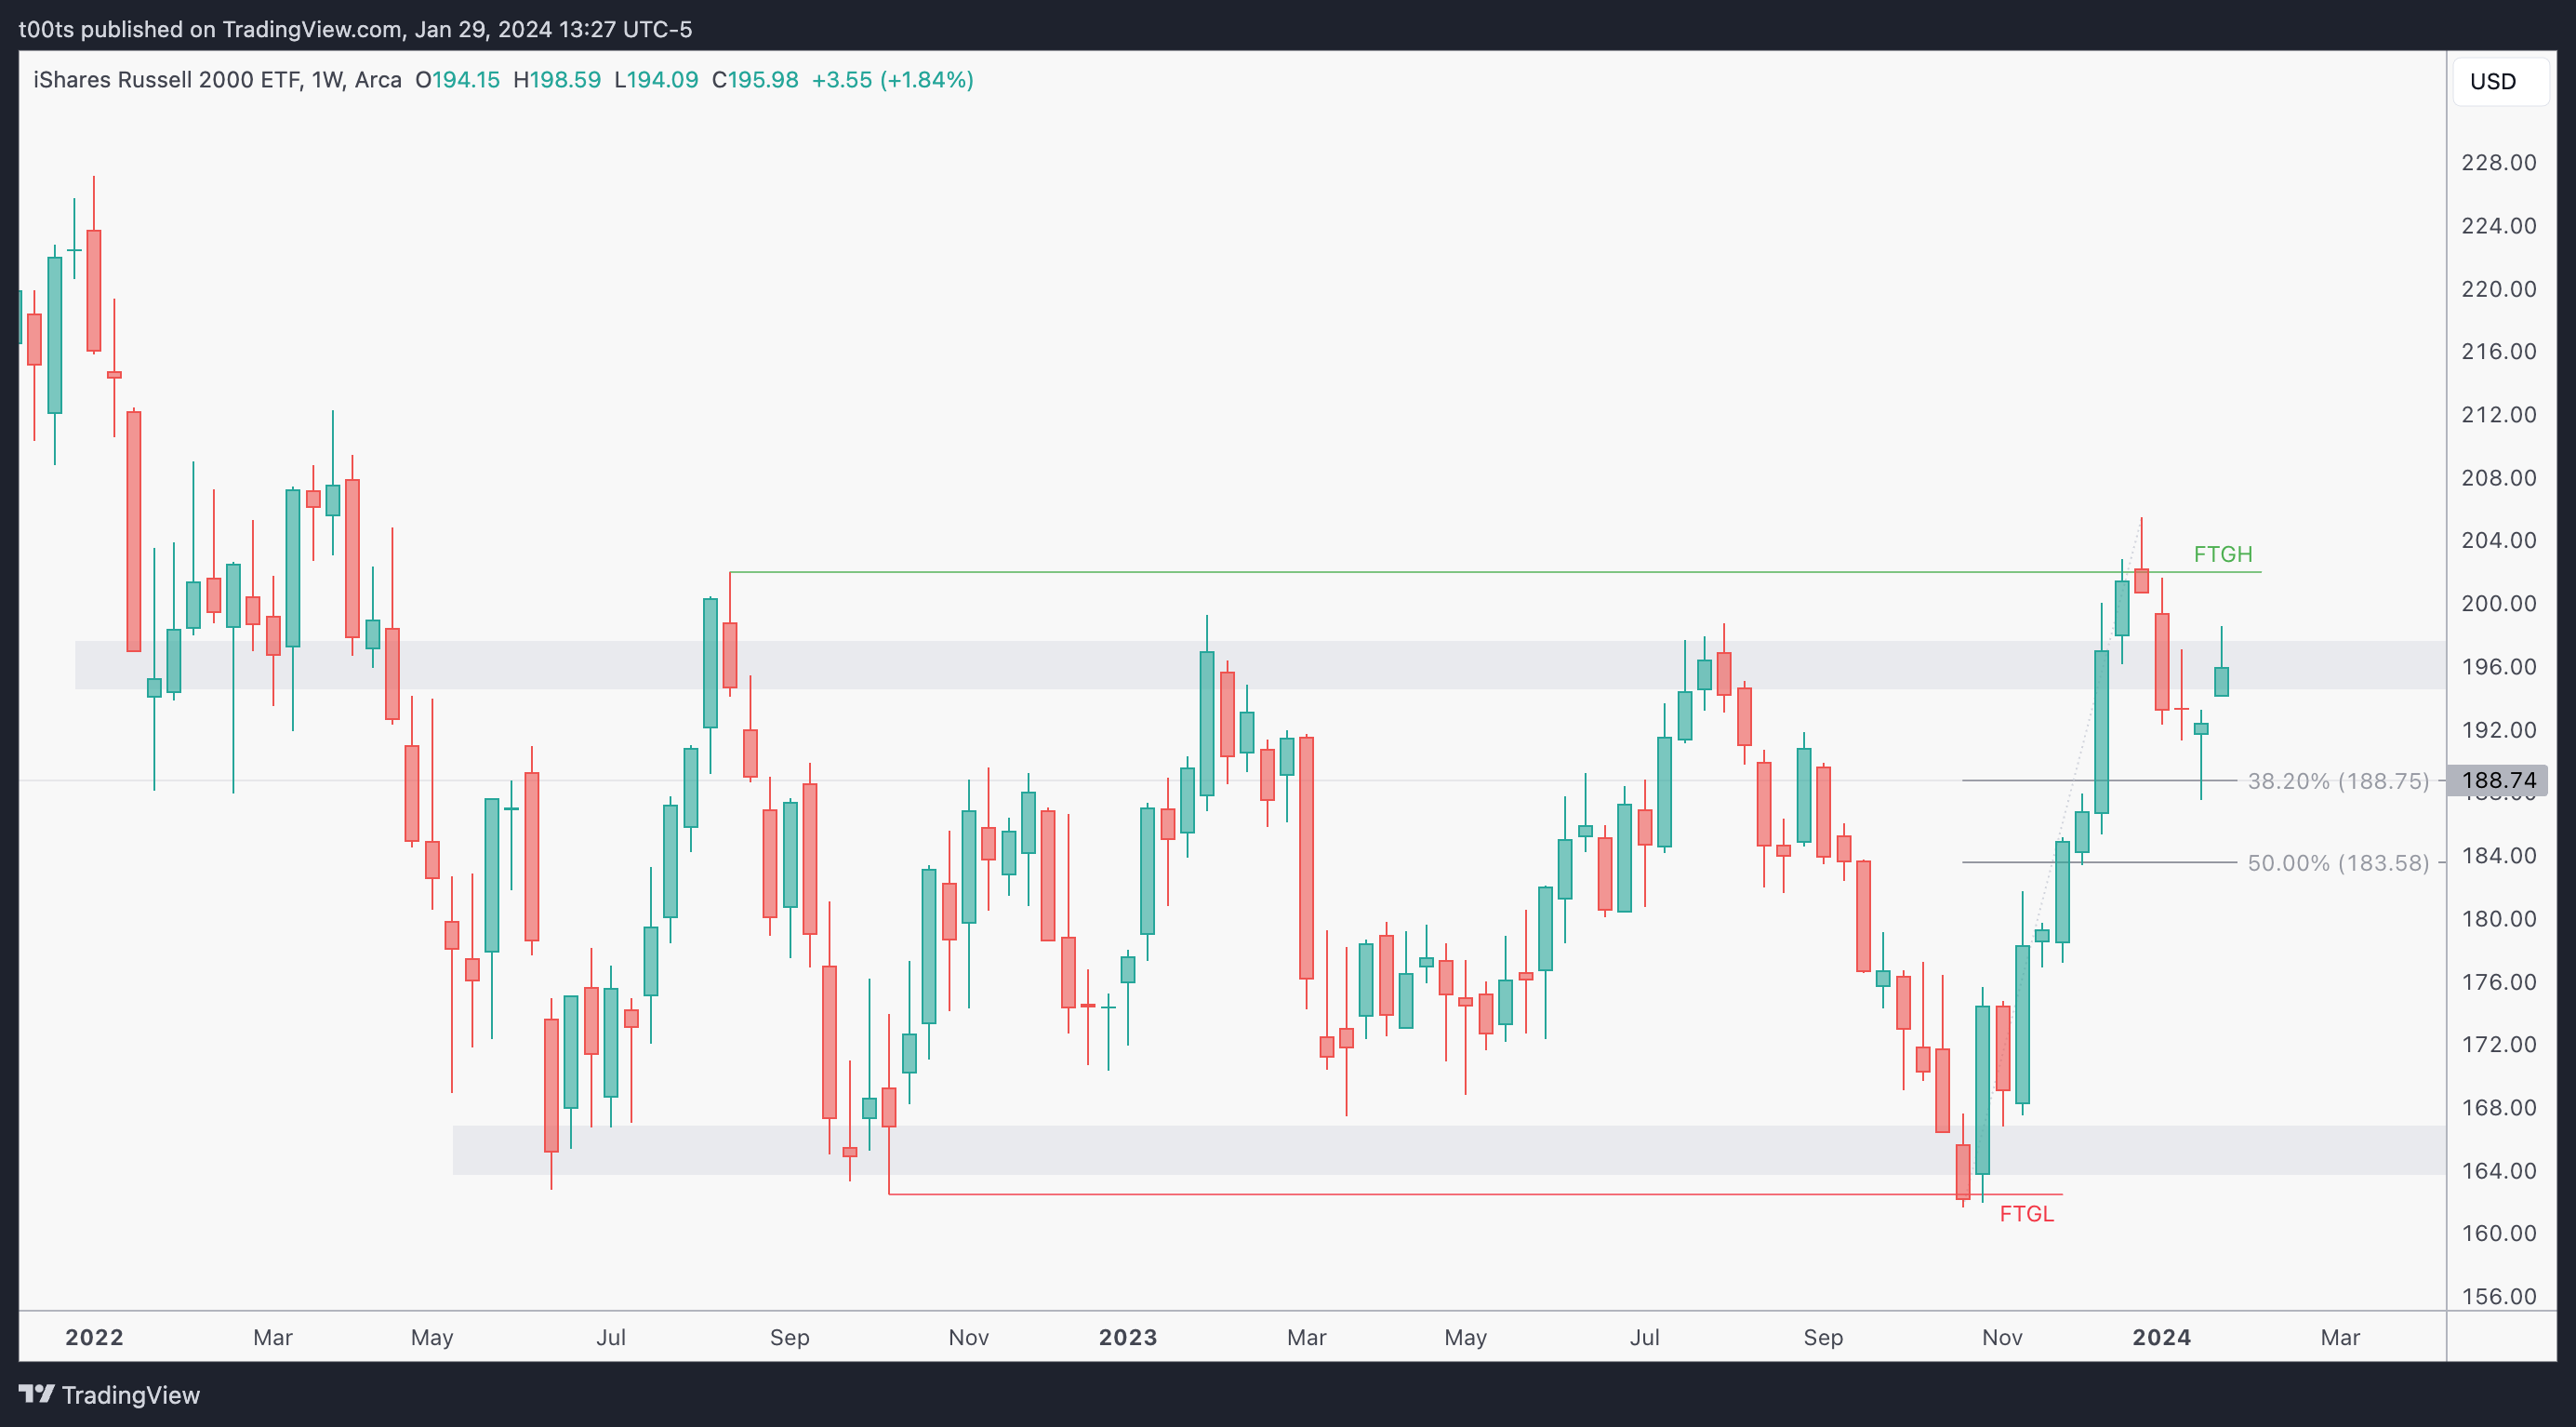
A very interesting weekly chart that I've been eyeing for a while. Price has been bouncing up and down inside a ~40pt range for over a year. We've just pulled back from a significant rally and are bouncing off the 38.20% FIB retracement area, which quite conveniently matches a weekly level where price has reacted over a dozen times during this past year.
The momentum seems pretty strong. Note how price swept the lows of the range before this aggressive bounce all the way up to new multi-year highs. Yesterday we briefly touched on how markets need liquidity to move, and that's why price hunts those levels of liquidity. We find ourselves in front of a great example that illustrates this phenomenon. Price swept the lows, and went straight up to sweep the highs.
Daily chart
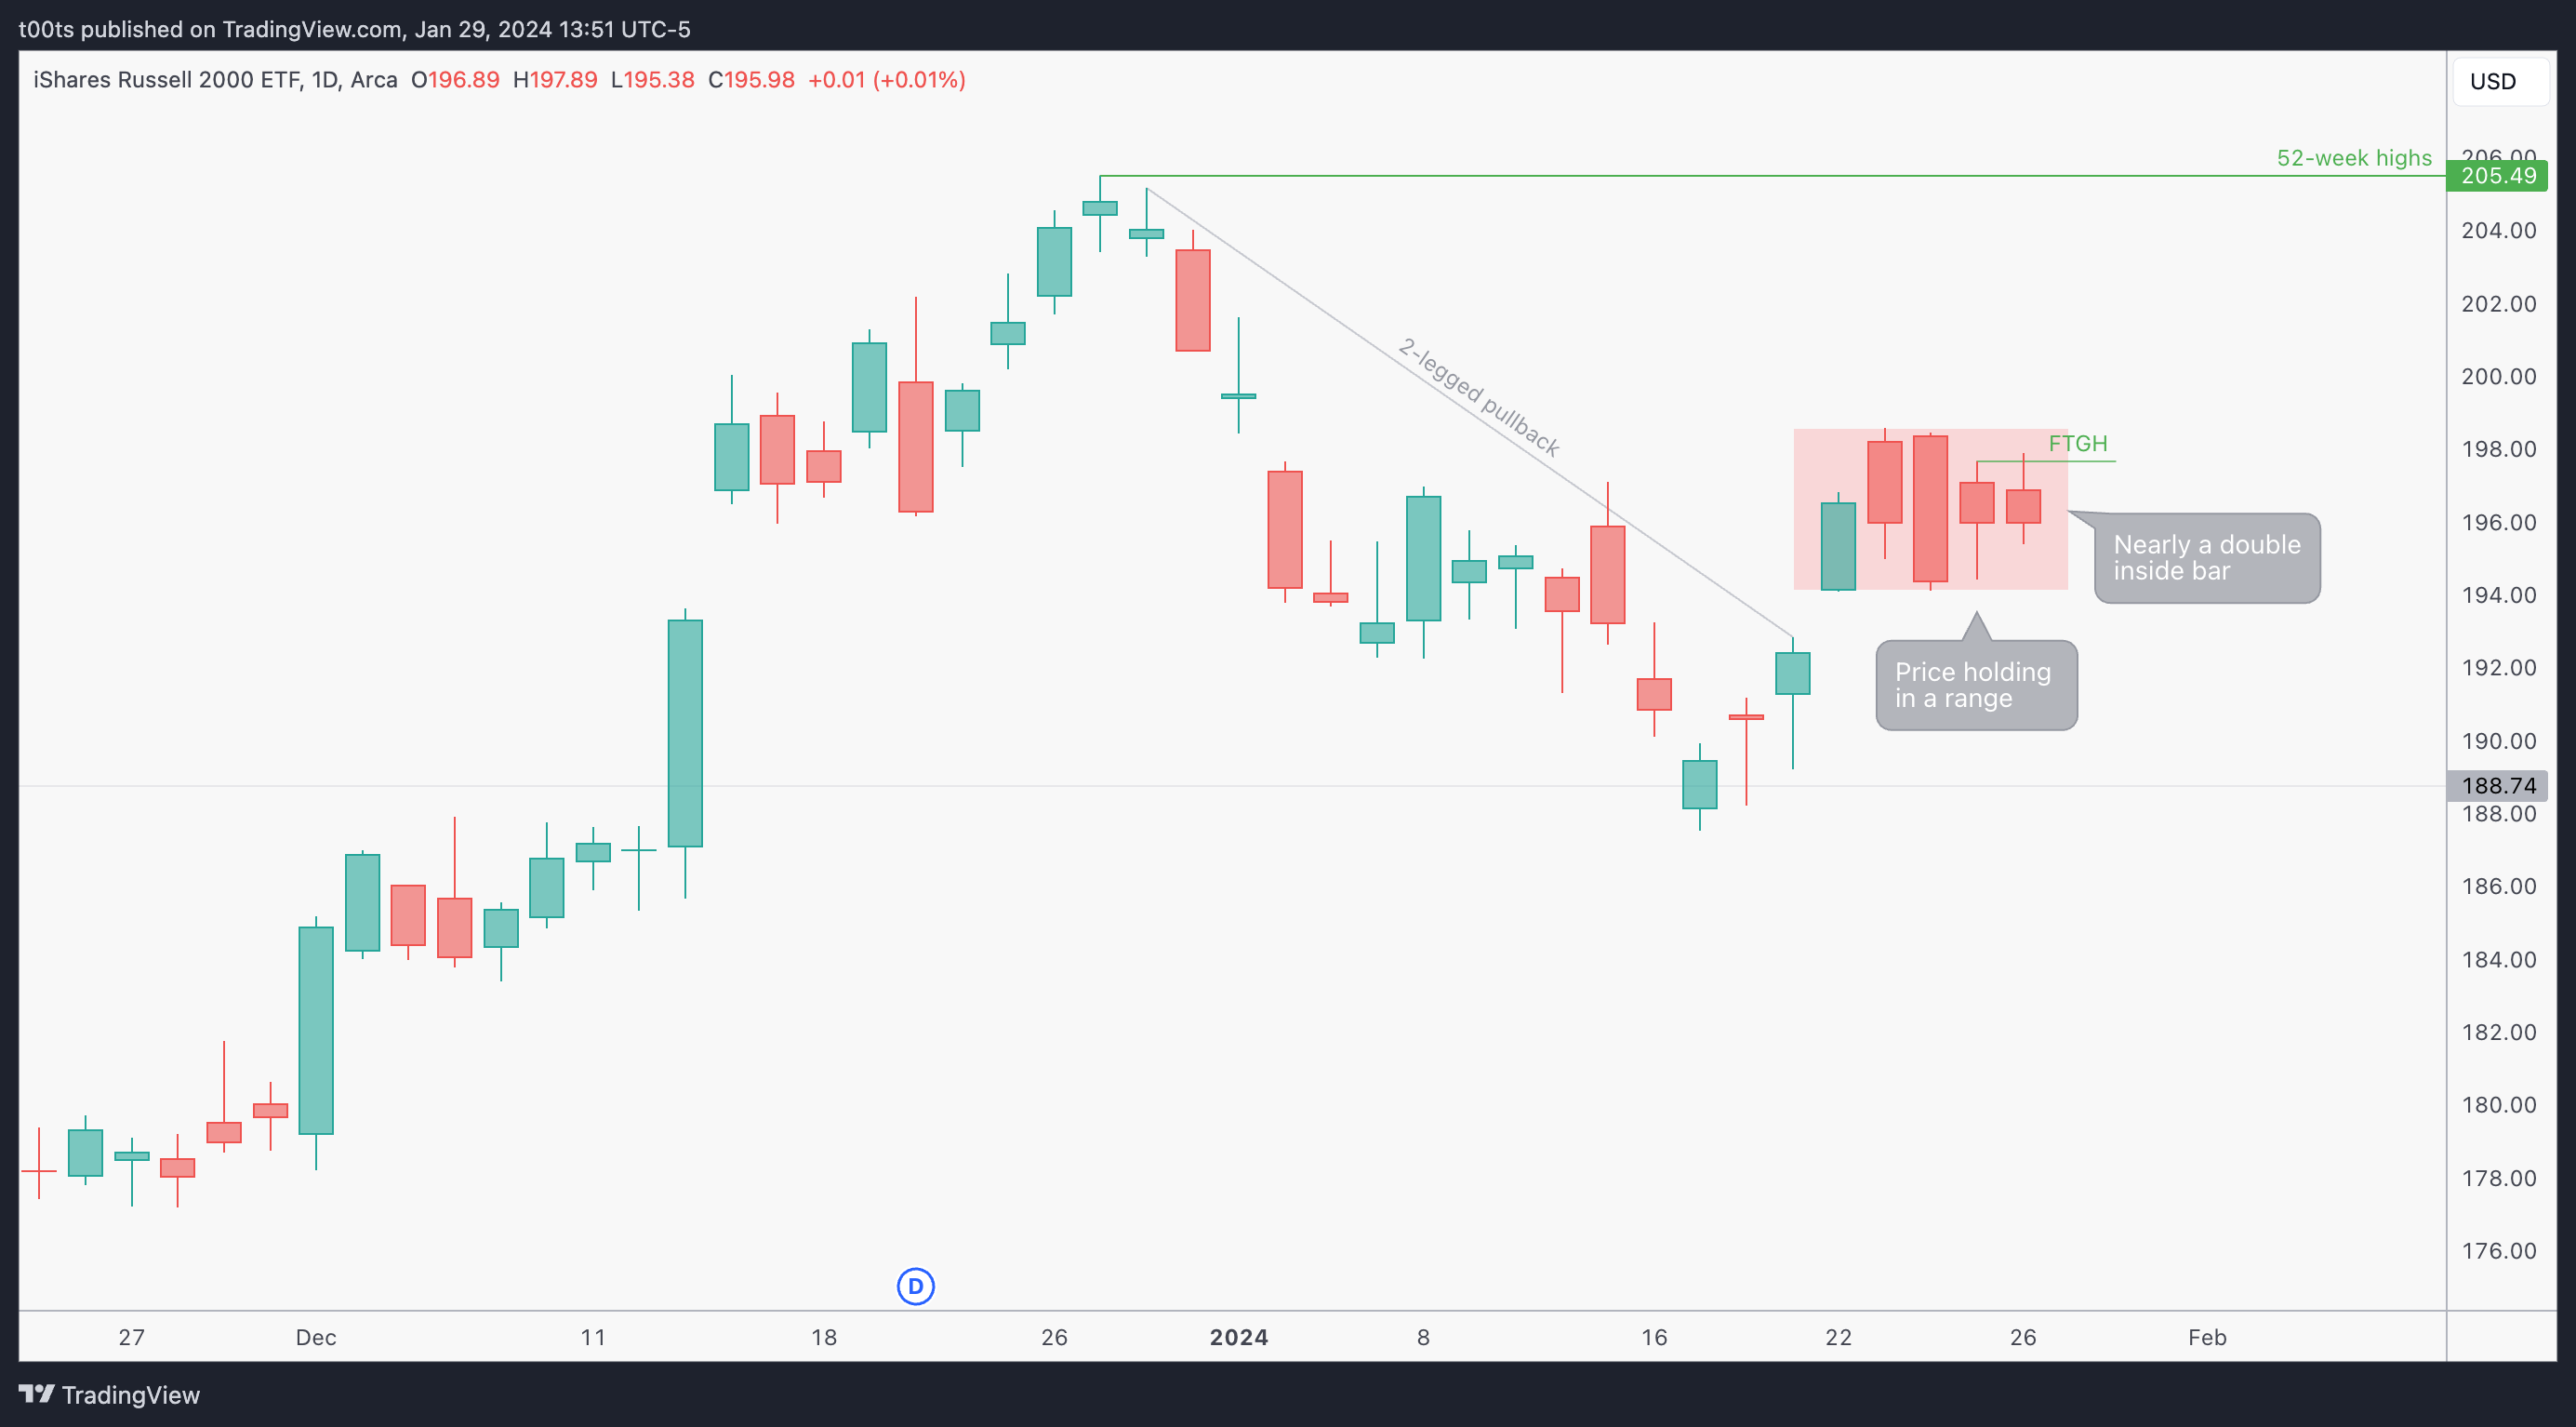
This daily chart is interesting because price is trying to resume the weekly trend after a 2-legged pullback from the highs. Last week was pure range action as price sets to decide where to go next. Last two bars are inside bars with respect to the previous outside bar. Friday shows a mild failure to go higher.
Hourly chart
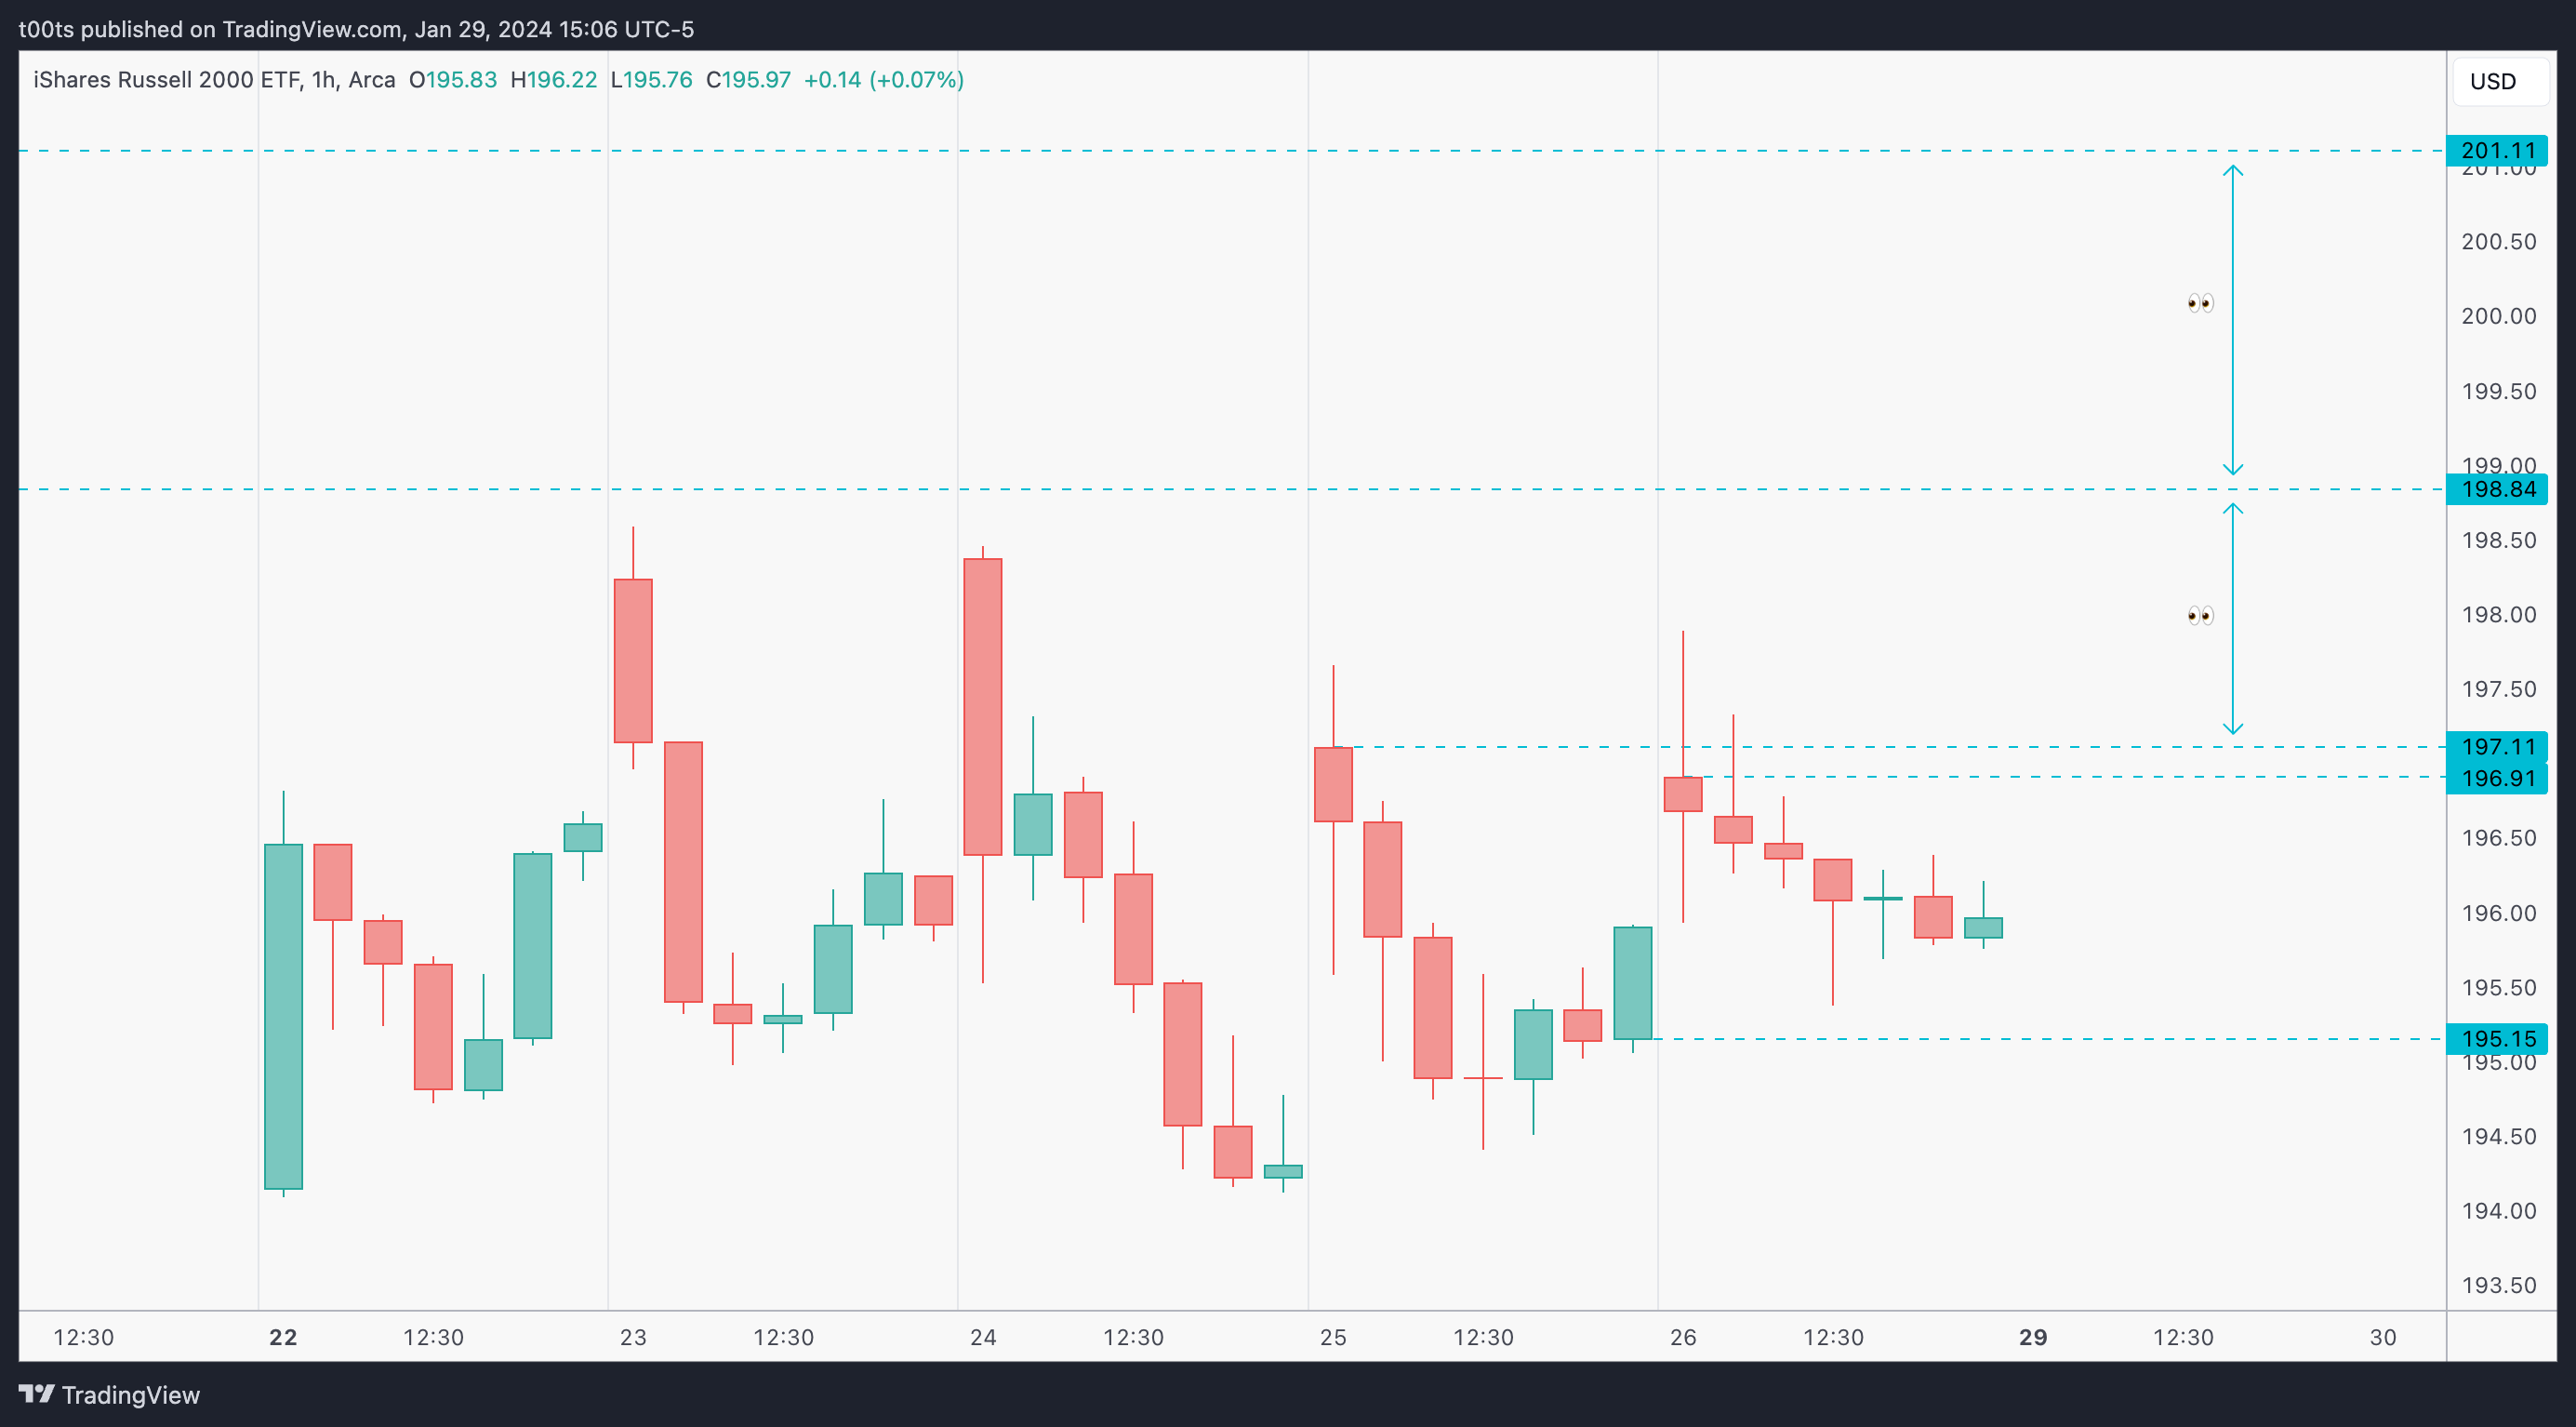
Not much to go over on this hourly chart. We're clearly in a range, but our overall bias is to the upside given the weekly trend we went over above. I've highlighted how there's room to move if price can break and trend above the $197.11 level.
Pre-market action
Pre-market action was irrelevant to this trade
The trade
I was scanning charts 40m after the bell and this setup stood out.
While still early in the day, the daily chart already showed a wick below previous day lows. We just observed on the daily chart above how on Friday price traded above Thursday's highs but closed red. Today around 10:20 EST price had traded below Friday's lows and was now hovering around the opening print in what could become an intraday higher low and start trending.
This was my CPT at that point:
Cue(s)
Very strong weekly momentum
Healthy 2-legged pullback after a strong move up
Potential failed failure pattern forming in the daily chart
Intraday cue: Early morning level bounce as potential daily FTGL forms
Intraday cue:: Potential intraday higher low forming at the opening print
Plan
The higher timeframes are looking extremely juicy at this point, so I'm thinking about a longer hold. I am also kind of concerned about the other indices potentially pulling back, so the first thing in my plan is to buy time. However, I also want to capitalize from the short term momentum if things speed up. I settle on two different contracts: a shorter term near-ATM call, and a 2-week out $200 strike call.
The stop for both is if price falls below the opening print. I'm very clear about that with myself because sometimes the fact of buying time messes with you when it comes to take an early loss.
Trigger(s)
Price trading above the signal bar.
5m chart
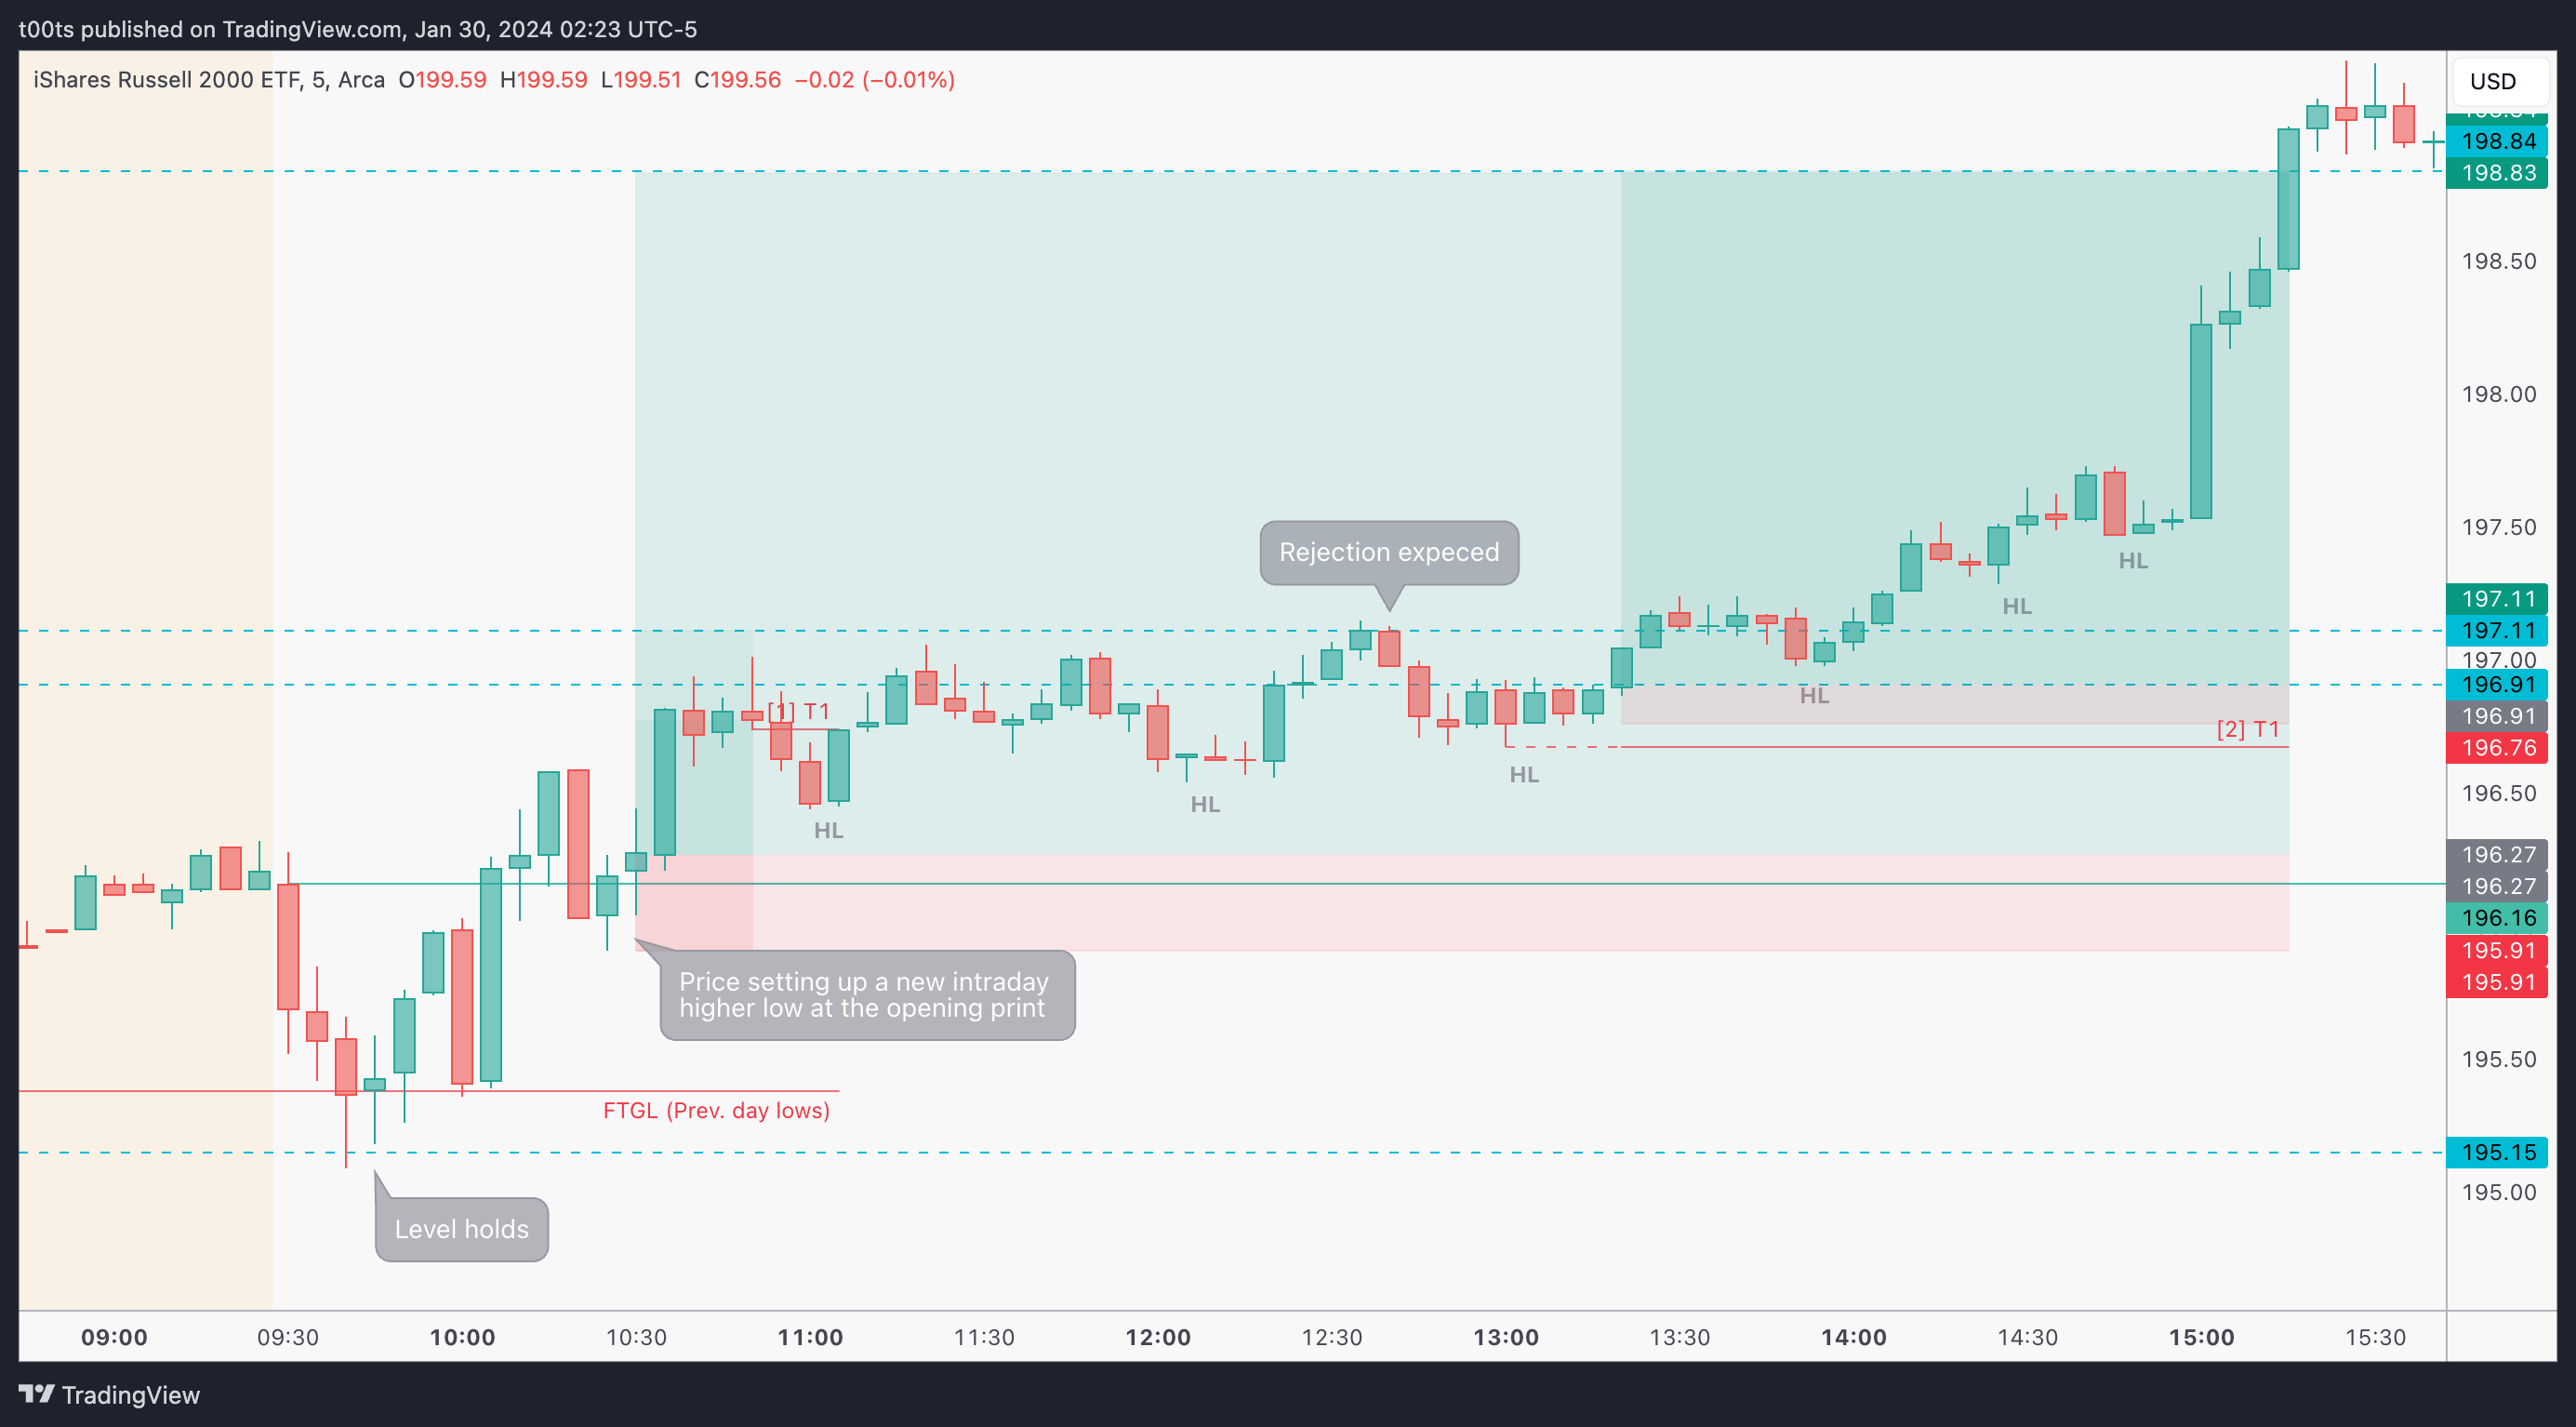
I jumped in with both contracts as the buy setup triggered, as I alerted the entry on 𝕏.
The first trade, while profitable, was pretty short-lived. The $196.91 level above rejected twice, and if you've been reading you'll know that two failures open the door to a potential trend flip, so I trailed my stop to the lows of the second failure bar and it hit immediately. I had zero issues getting out because I had the other contracts that I was prepared to hold longer. This is a very simple way of trading larger moves with options.
Price chopped around the level pretty much all day, but every time it itched higher and made a new intraday high, the pullback would never go beyond the previous higher low. So despite not having much momentum, the trend was up by definition. So it was just a matter of holding.
The first time I actually set a stop for this position is around 1:30pm EST, when price seems ready to break out, after accumulating in a tight range full of inside bars that breaks to the upside. There was a reasonable chance to add there, but I failed to do so, and instead trailed my stop in case the level failed and the intraday trend flipped.
The rest of the trade was very straightforward. As it hit our first target I took half off and decided to swing the rest. My ultimate target is for price to hit the $201 area before JOLTS tomorrow (10am EST). I might hold one runner through the news depending on the price action that leads to it, but ideally I'd be interested in taking my profits and sitting cash until the FED announcement on Wednesday.
Closing notes
This trade was essentially guided by the daily chart. While you're always going to want to look for entries and exits in the smaller timeframes, if your trade is planned from a daily chart, you need to be ready to zoom out and be patient. With options, being patient gets a lot easier when you buy yourself time, essentially going for further out expirations.
When trading indices there's plenty of option contracts to choose from, and they're generally pretty cheap. So, just we went over in this case, expressing your trade idea with multiple strike/expiration combinations can help you gain exposure to the best of both outcomes.
I am posting one trade writeup every day throughout 2024. I focus on large caps using levels and price action. The subscription is absolutely free and will always be. I will strive to provide value by offering clues and ideas for you to enhance your edge. Let’s grow together!