

Higher timeframe context
Palantir is one of those companies that has historically failed to gain real traction in the markets after the 2021 craze. I believe Wall St. has struggled to understand what they actually do, as it's always been a little bit vague. As far as I know, they create and license enterprise software for companies, institutions, governments and intelligence agencies in order to help humans make better decisions using data. I guess that would classify as Business Intelligence (BI).
Regardless, Palantir had their Q4 earnings and the company is doing well. A solid 70% YoY revenue growth, with the CEO emphasizing the strong demand they're receiving for AI-related products and enhancements, especially in the Large Language Model domain. The forward year guidance was just slightly above analyst expectations. The stock gapped up notably on this report and offered an extremely solid trading opportunity which we're about to go over.
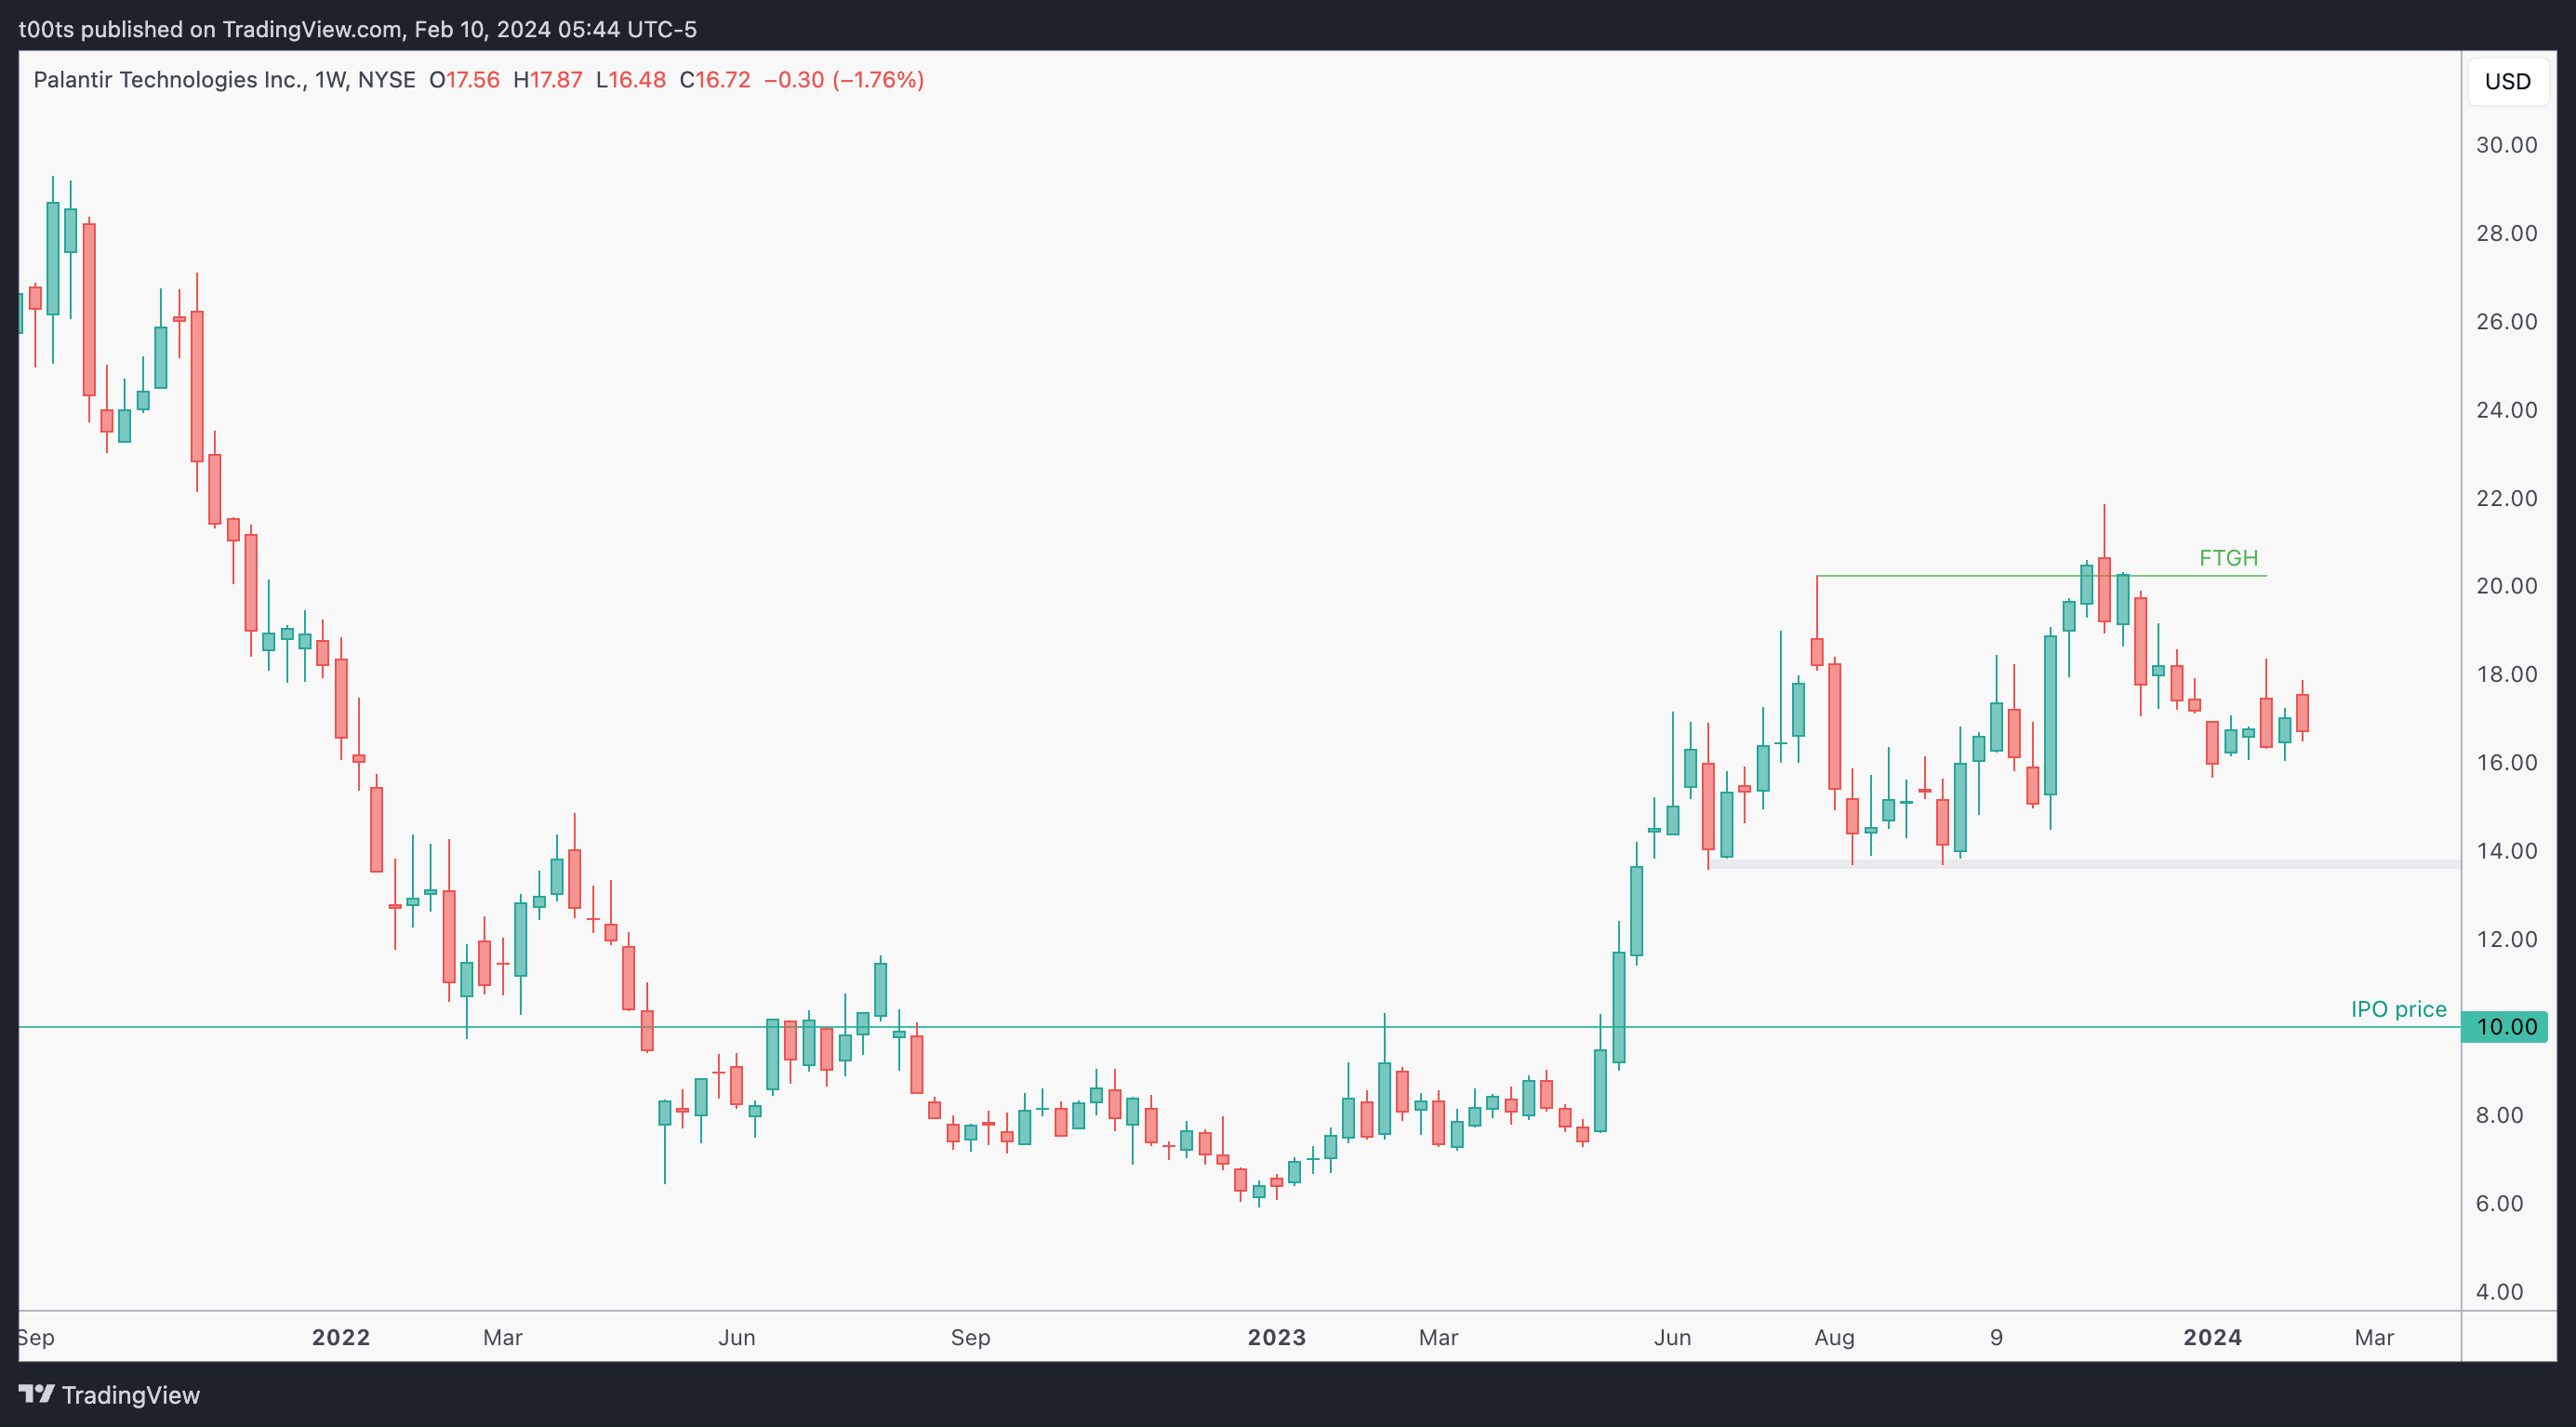
Weekly chart
Very clunky chart frankly. Probably not something you'd be looking to trade without a catalyst or some sort of external event coming in. After trading below its IPO price for around a year, it finally broke out and is currently consolidating in the sub-$20s after it recently failed to break to the upside.
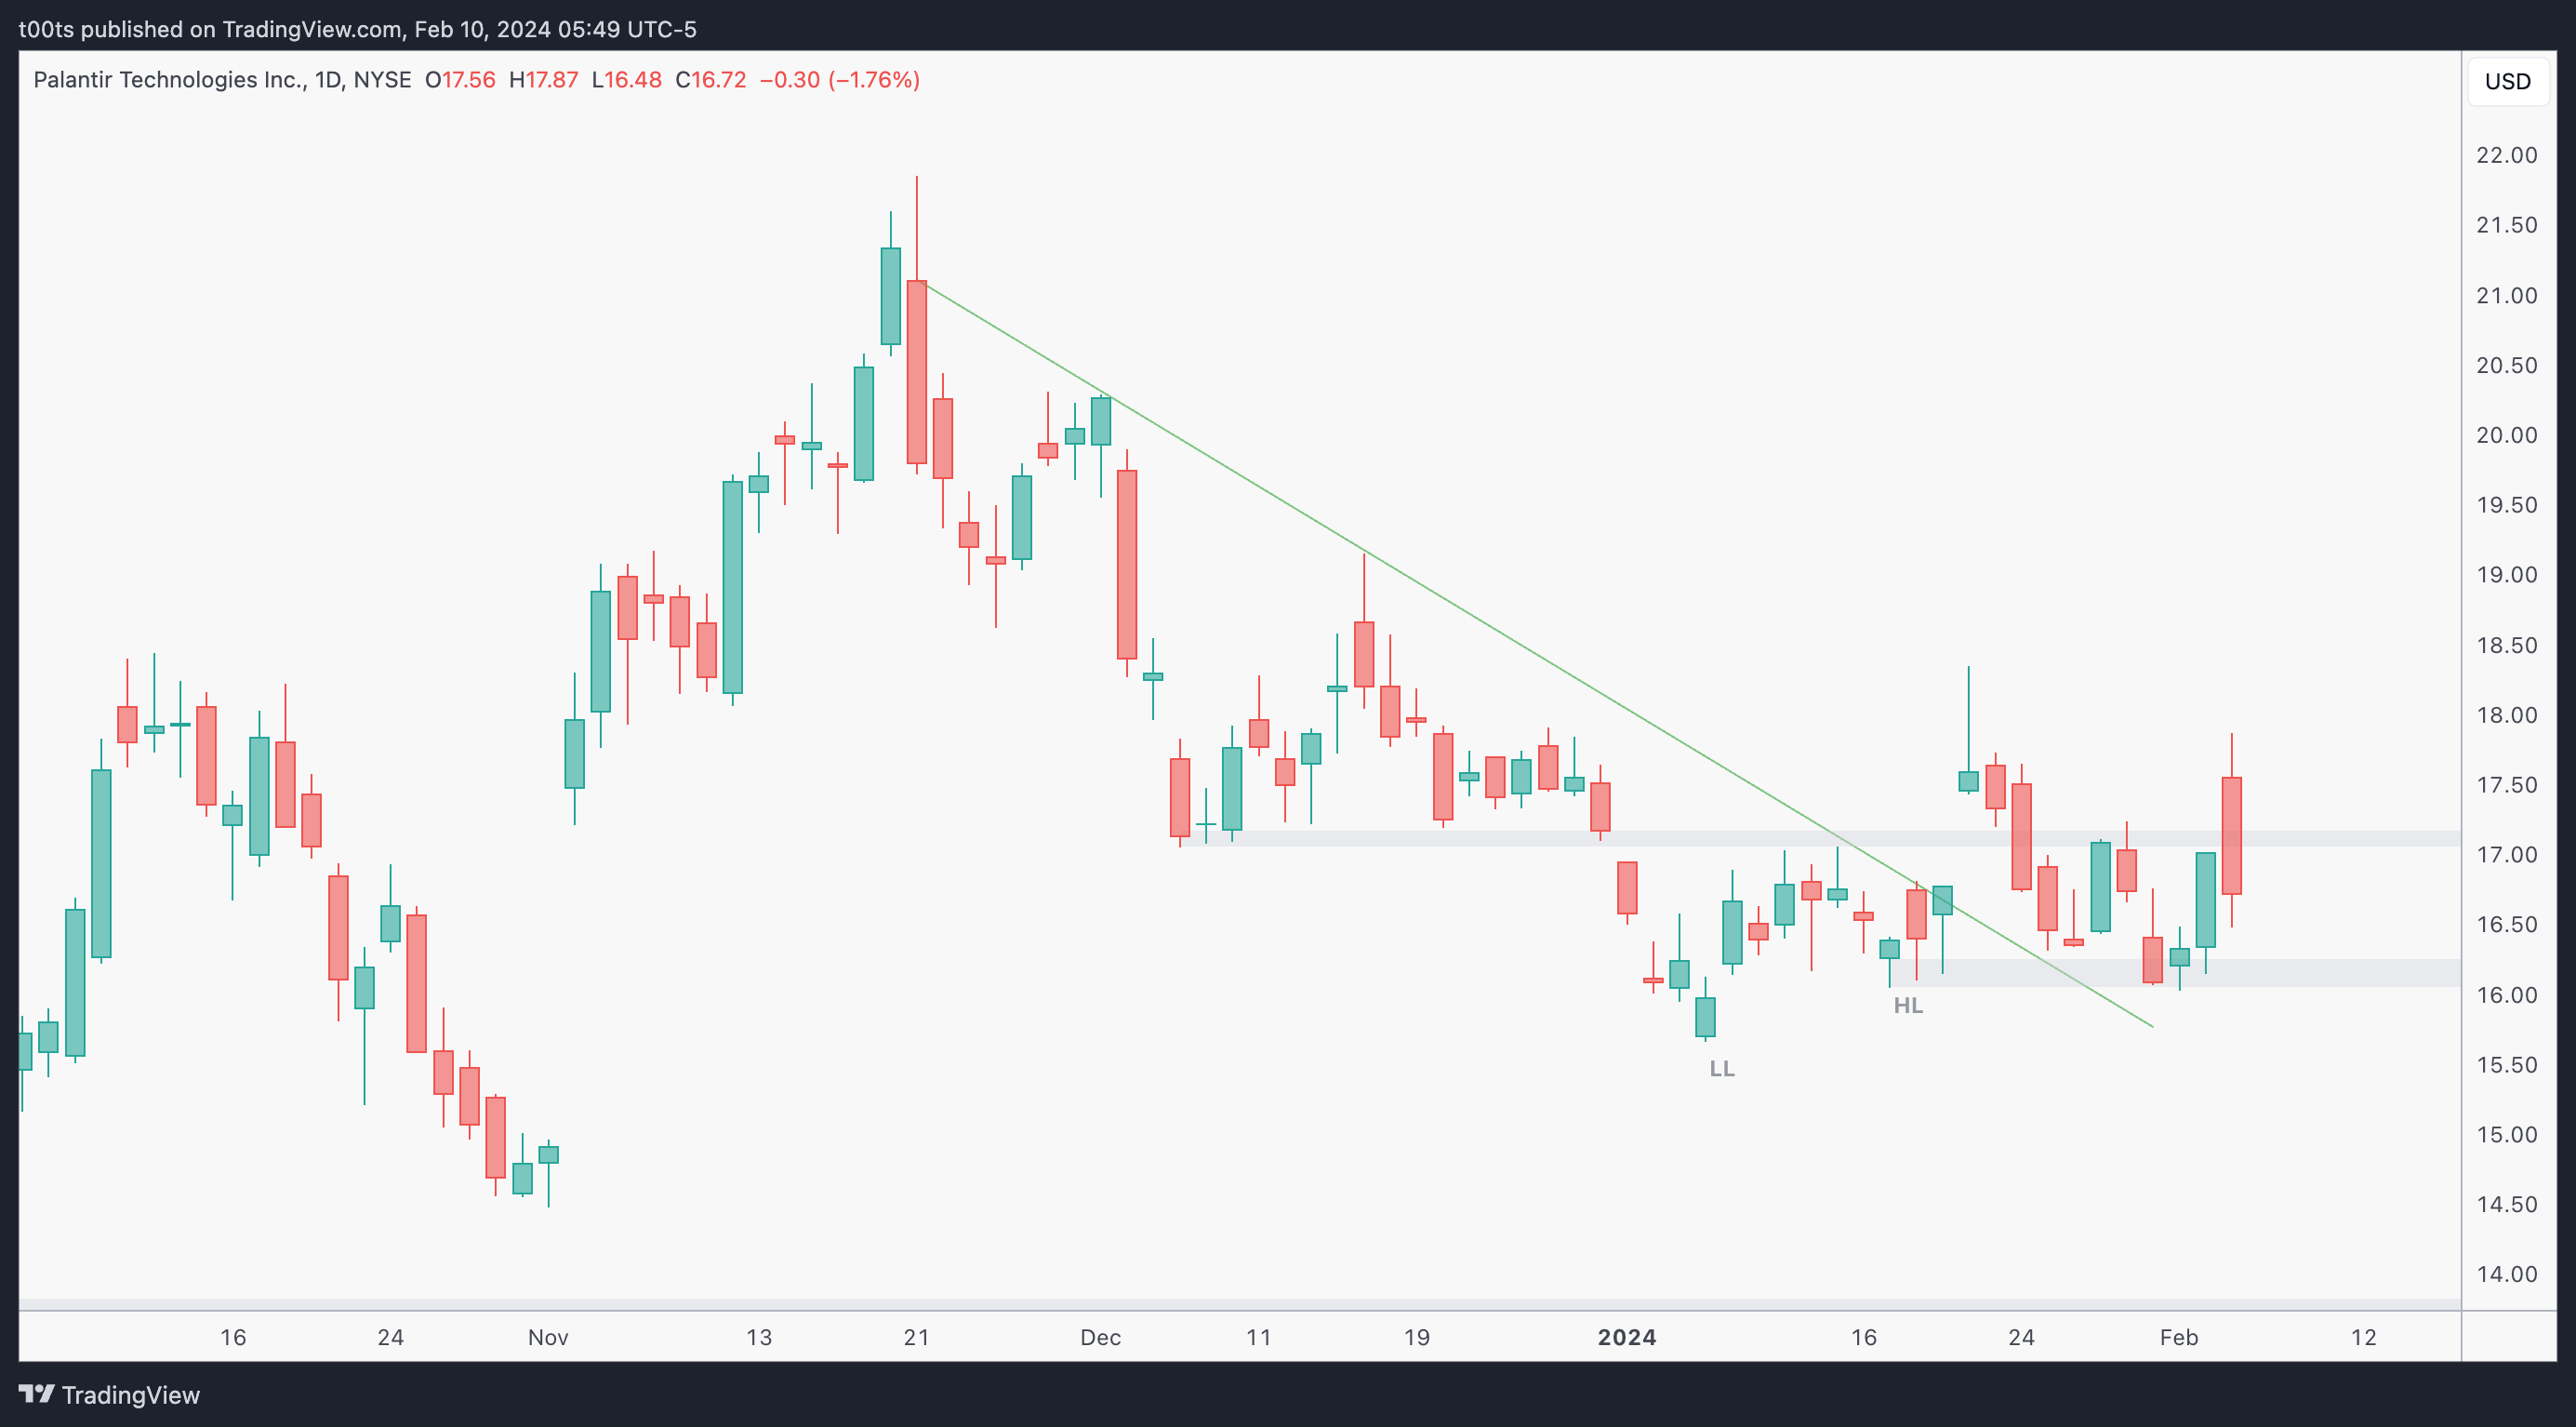
Daily chart
Once again, a bit of a mess. Price is basing above the $16 mark after this multi-month downtrend since it failed to break the $20s. However, despite breaking the downtrend it hasn't really caught any traction to the upside. The only thing worth highlighting on this chart ahead of the trade we're about to cover is that the stock is headed into the earnings report with a bearish trend bar, highlighting an apparent lack of risk apetite from investors heading into the announcement.
Hourly chart
The hourly chart is somewhat irrelevant as the stock is gapping up notably after their earnings announcement
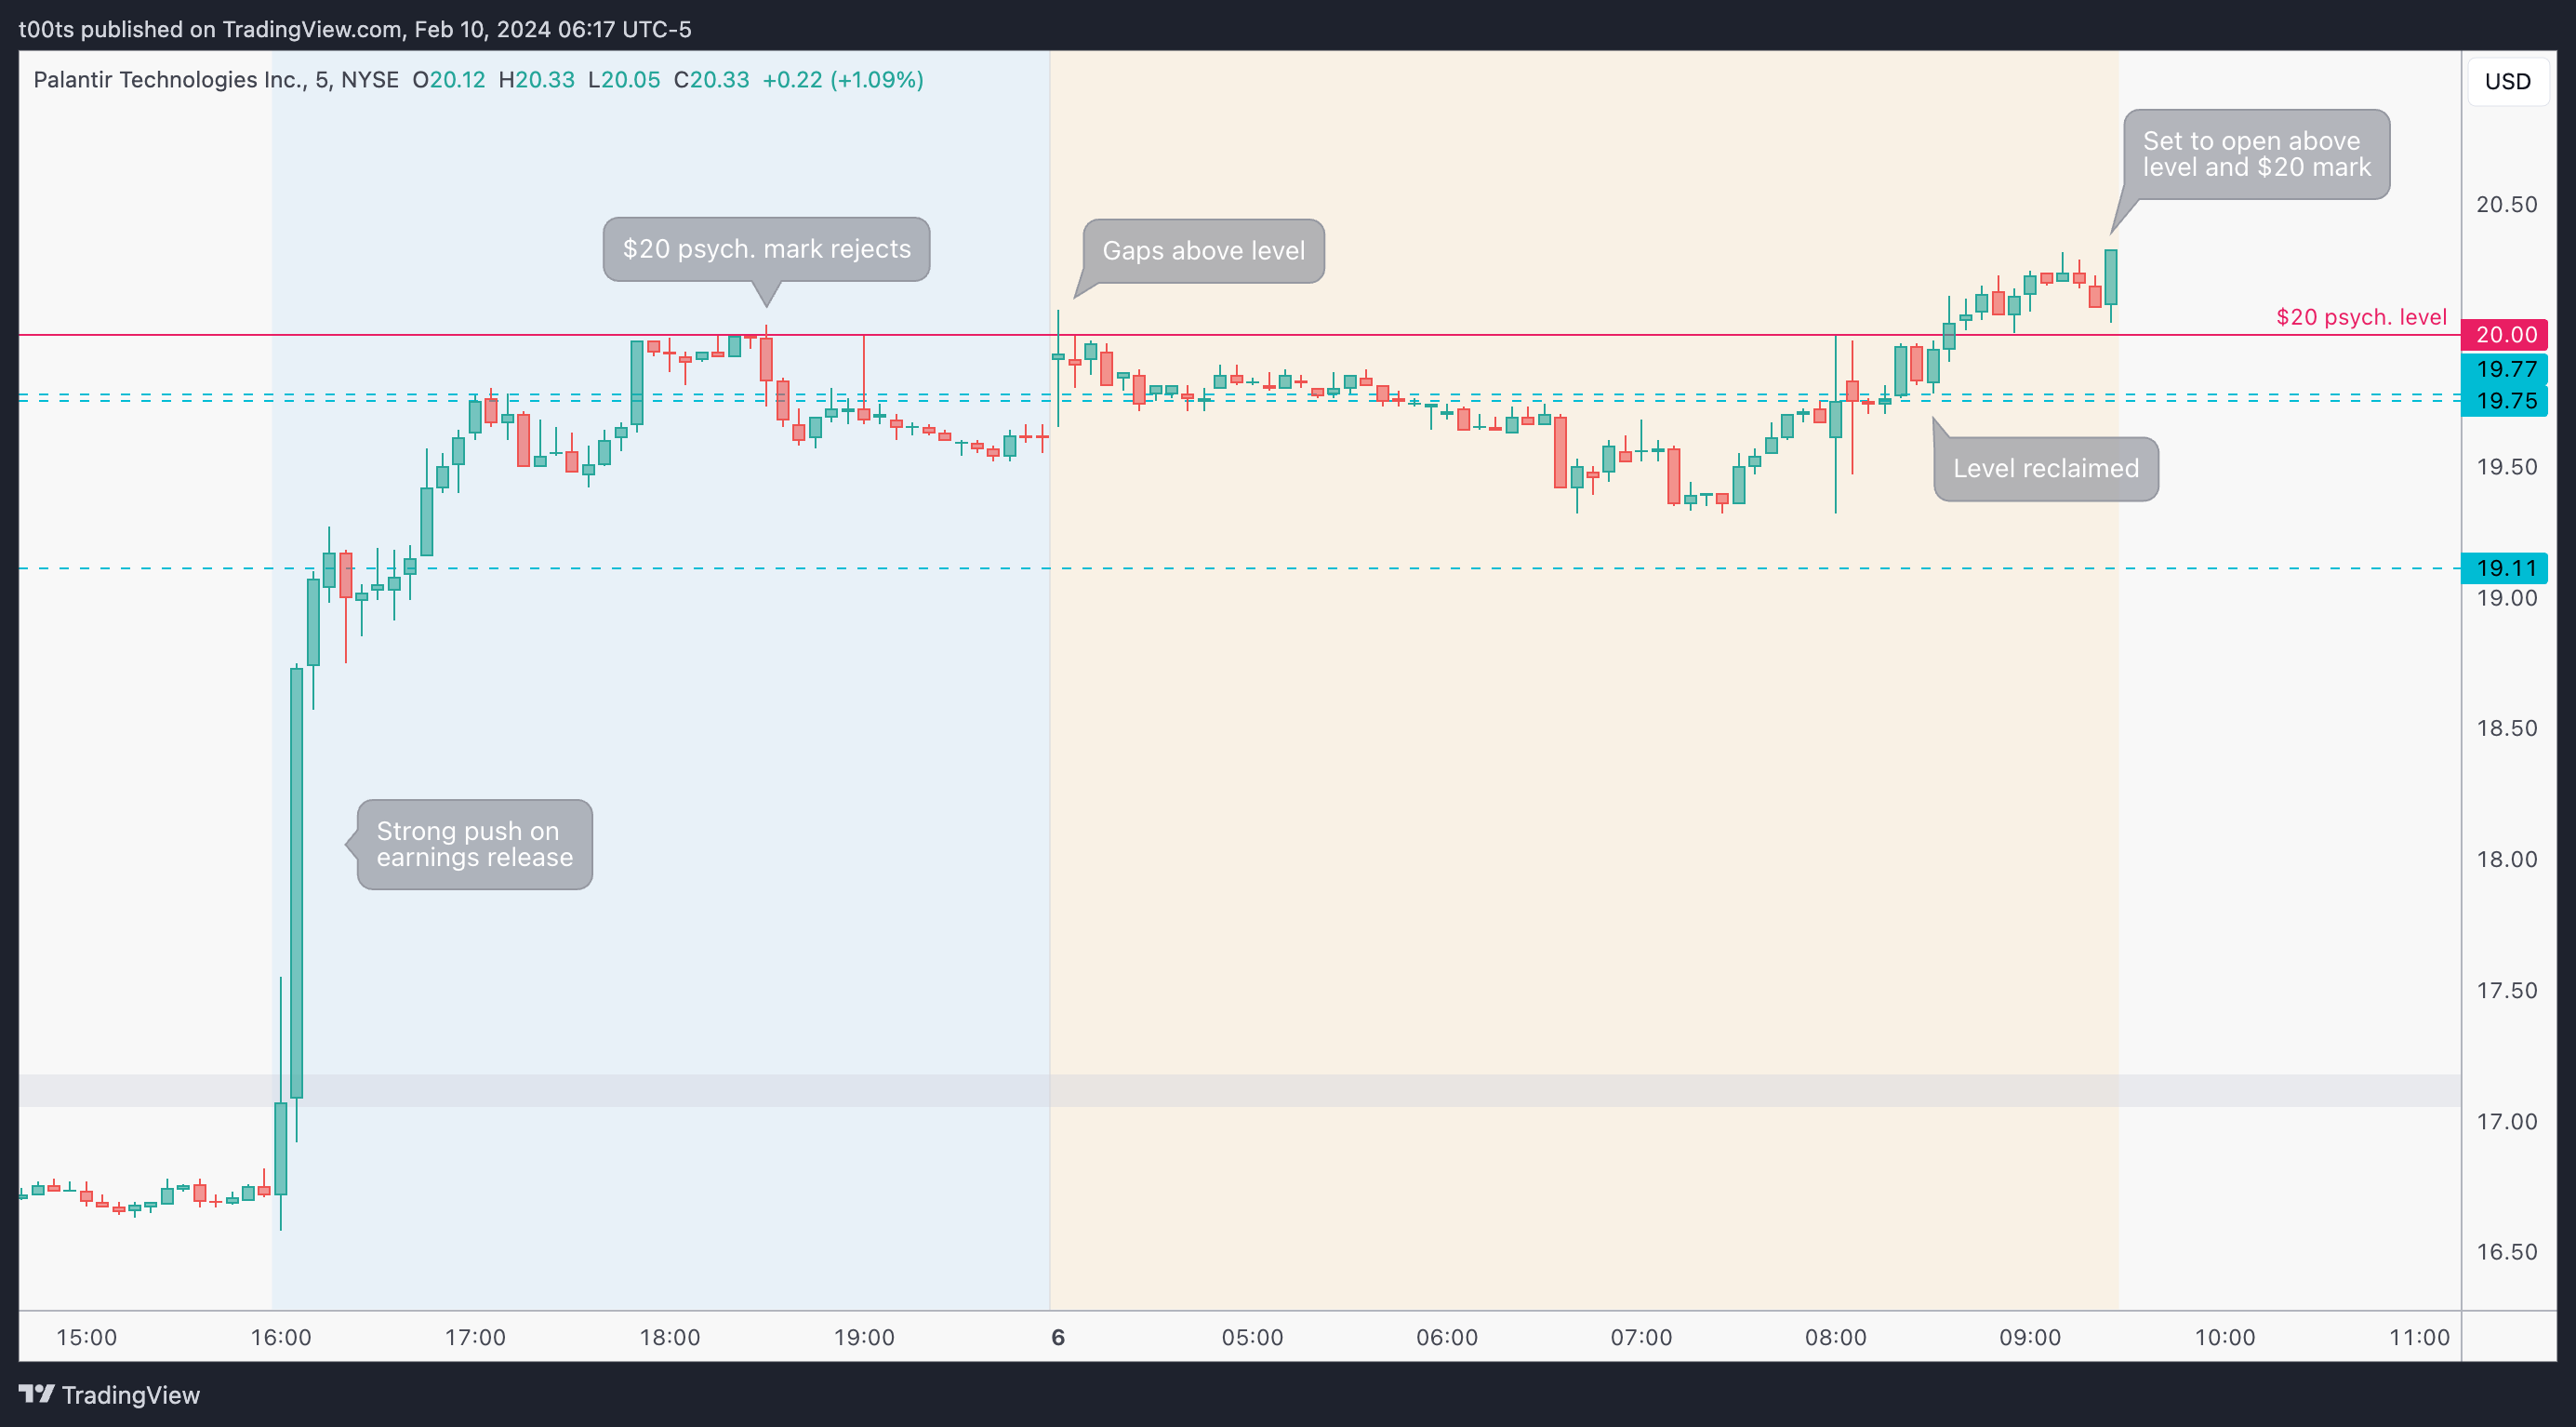
Pre-market action
Here's where things get interesting, as per usual with most earnings plays.
Price experiences a strong push following the announcement and breaks the $19.11 and $19.75 levels, to eventually face resistance at the $20 psychological level. On the next morning, price gaps above the $19.75 and despite holding above for a few hours, it eventually fades mildly until buyers kick back in towards 8am and not only reclaim the level but also break the $20 mark, leading us into a potentially strong open.
The trade
If you've been following the latests posts you already know how this plan is going to look like. We're gapping above a psych. level on a strong catalyst...
Let's frame it using our CPT Framework:
Cue(s)
Strong earnings
Gapping above a daily red trend bar (sellers trapped)
Price set to open above a strong psych. level
Intraday cue: Price bouncing off the $19.75 area and reclaiming $20
Plan
Our plan is the same as every time we've gapped above a strong level. We're interested in longs. We want to see how price reacts to that level and take it from there. In this particular case, our $19.75 level is right below the $20 psych. mark. A quick bounce around that area would allow us to get involved in a long position risking the lows.
Trigger
If price tests the $19.75, wait for price to reclaim the $20 mark
If price shoots up off the open, find a momentum entry that allows for tight risk.
2m chart
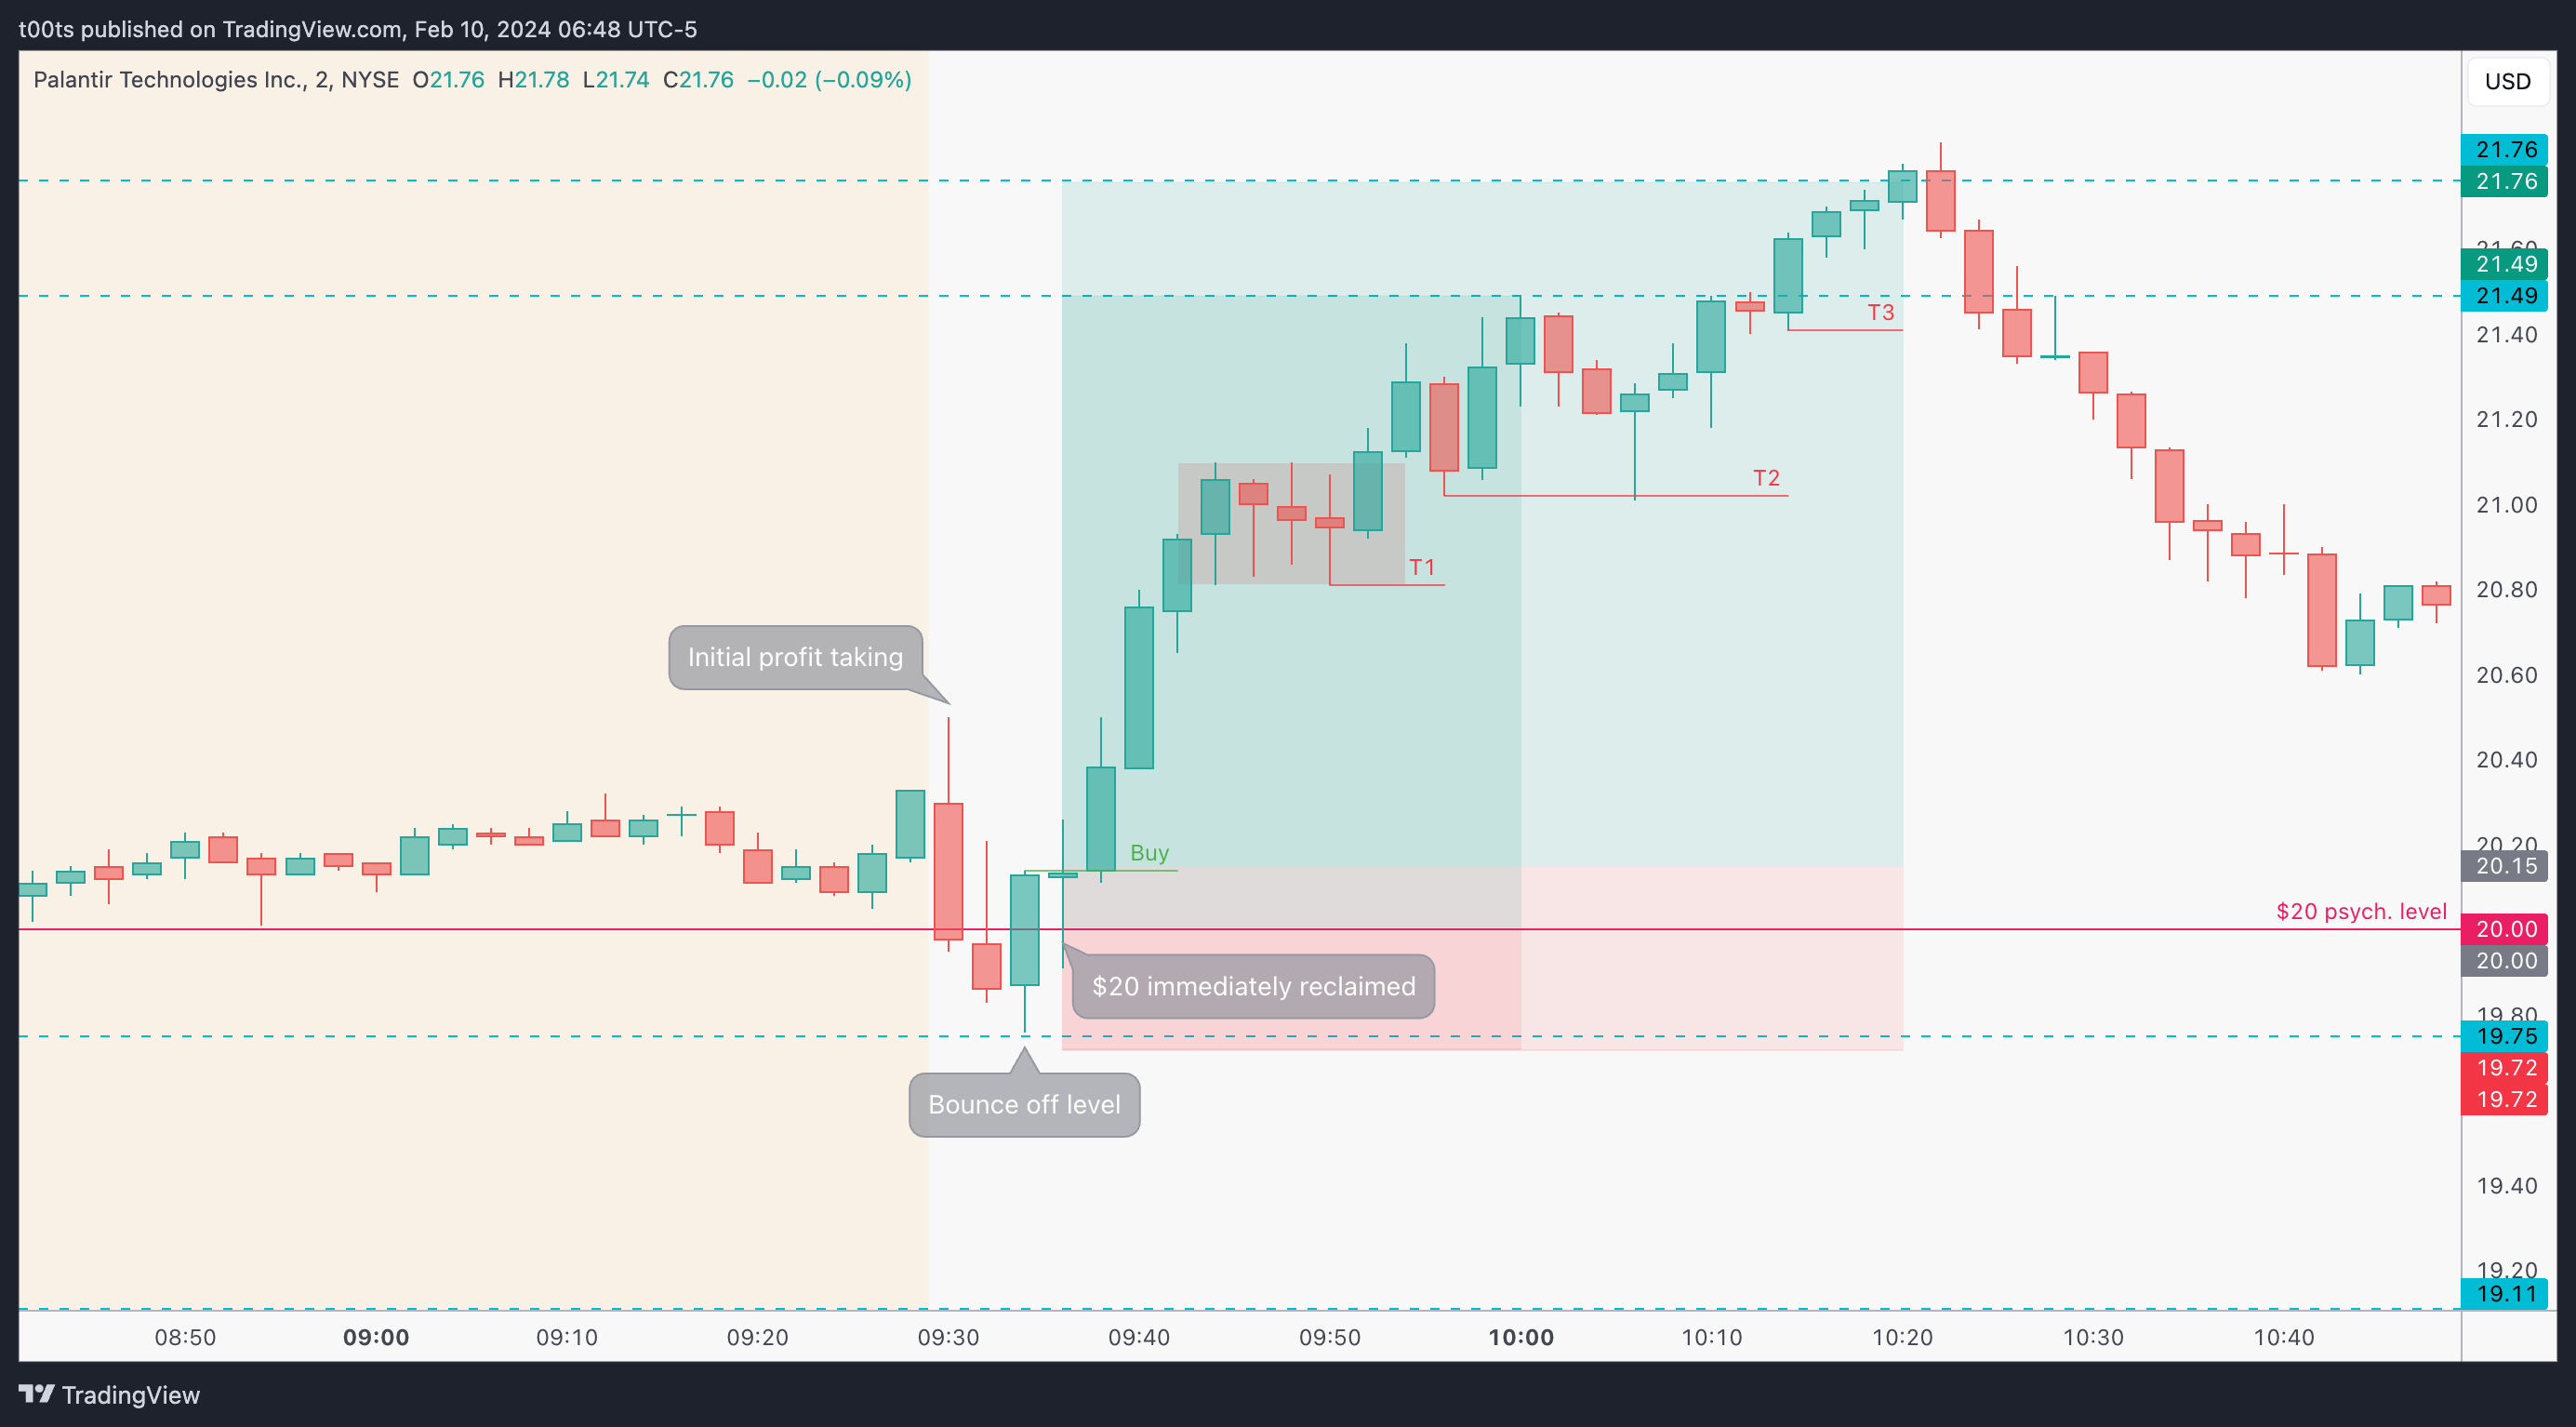
Price did come back down to test the $19.75 level as longs took profit after the huge gap up, conveniently using the liquidity from traders who attempted that pre-market high breakout.
The bounce off the $19.75 is strong. Buyers reclaim the $20 mark and we get even further confirmation in the retest on the following 2m bar.
We can now jump in as the $20 is retested and holds, on the break of the highs of that previous trend bar that broke the $20s, or even use both to pyramid into the position.
The trade works well and is a pretty easy hold in my opinion. The first little range around the $21 round number is expected. The break of the $21 allows us to trail our stop (T1) and keep holding. Remember this is a 2m chart, and while this trade carried a lot of momentum and was manageable off this smaller timeframe, you'll always want to have the higher timeframes side-by-side so you can avoid the noise and focus on the actual trend.
Price retests that $21 range top and bounces off it, as expected, allowing us to trail our stop even higher (T2) and hitting our first target of $21.49, which leads to a slight pullback that paves the way to the continuation move up into our final target. The moment price breaks the level on a nice 3-bar play, we can trail our stop even further (T3) and can either take profits at the $21.76 or let the stop hit (or both).
5m chart
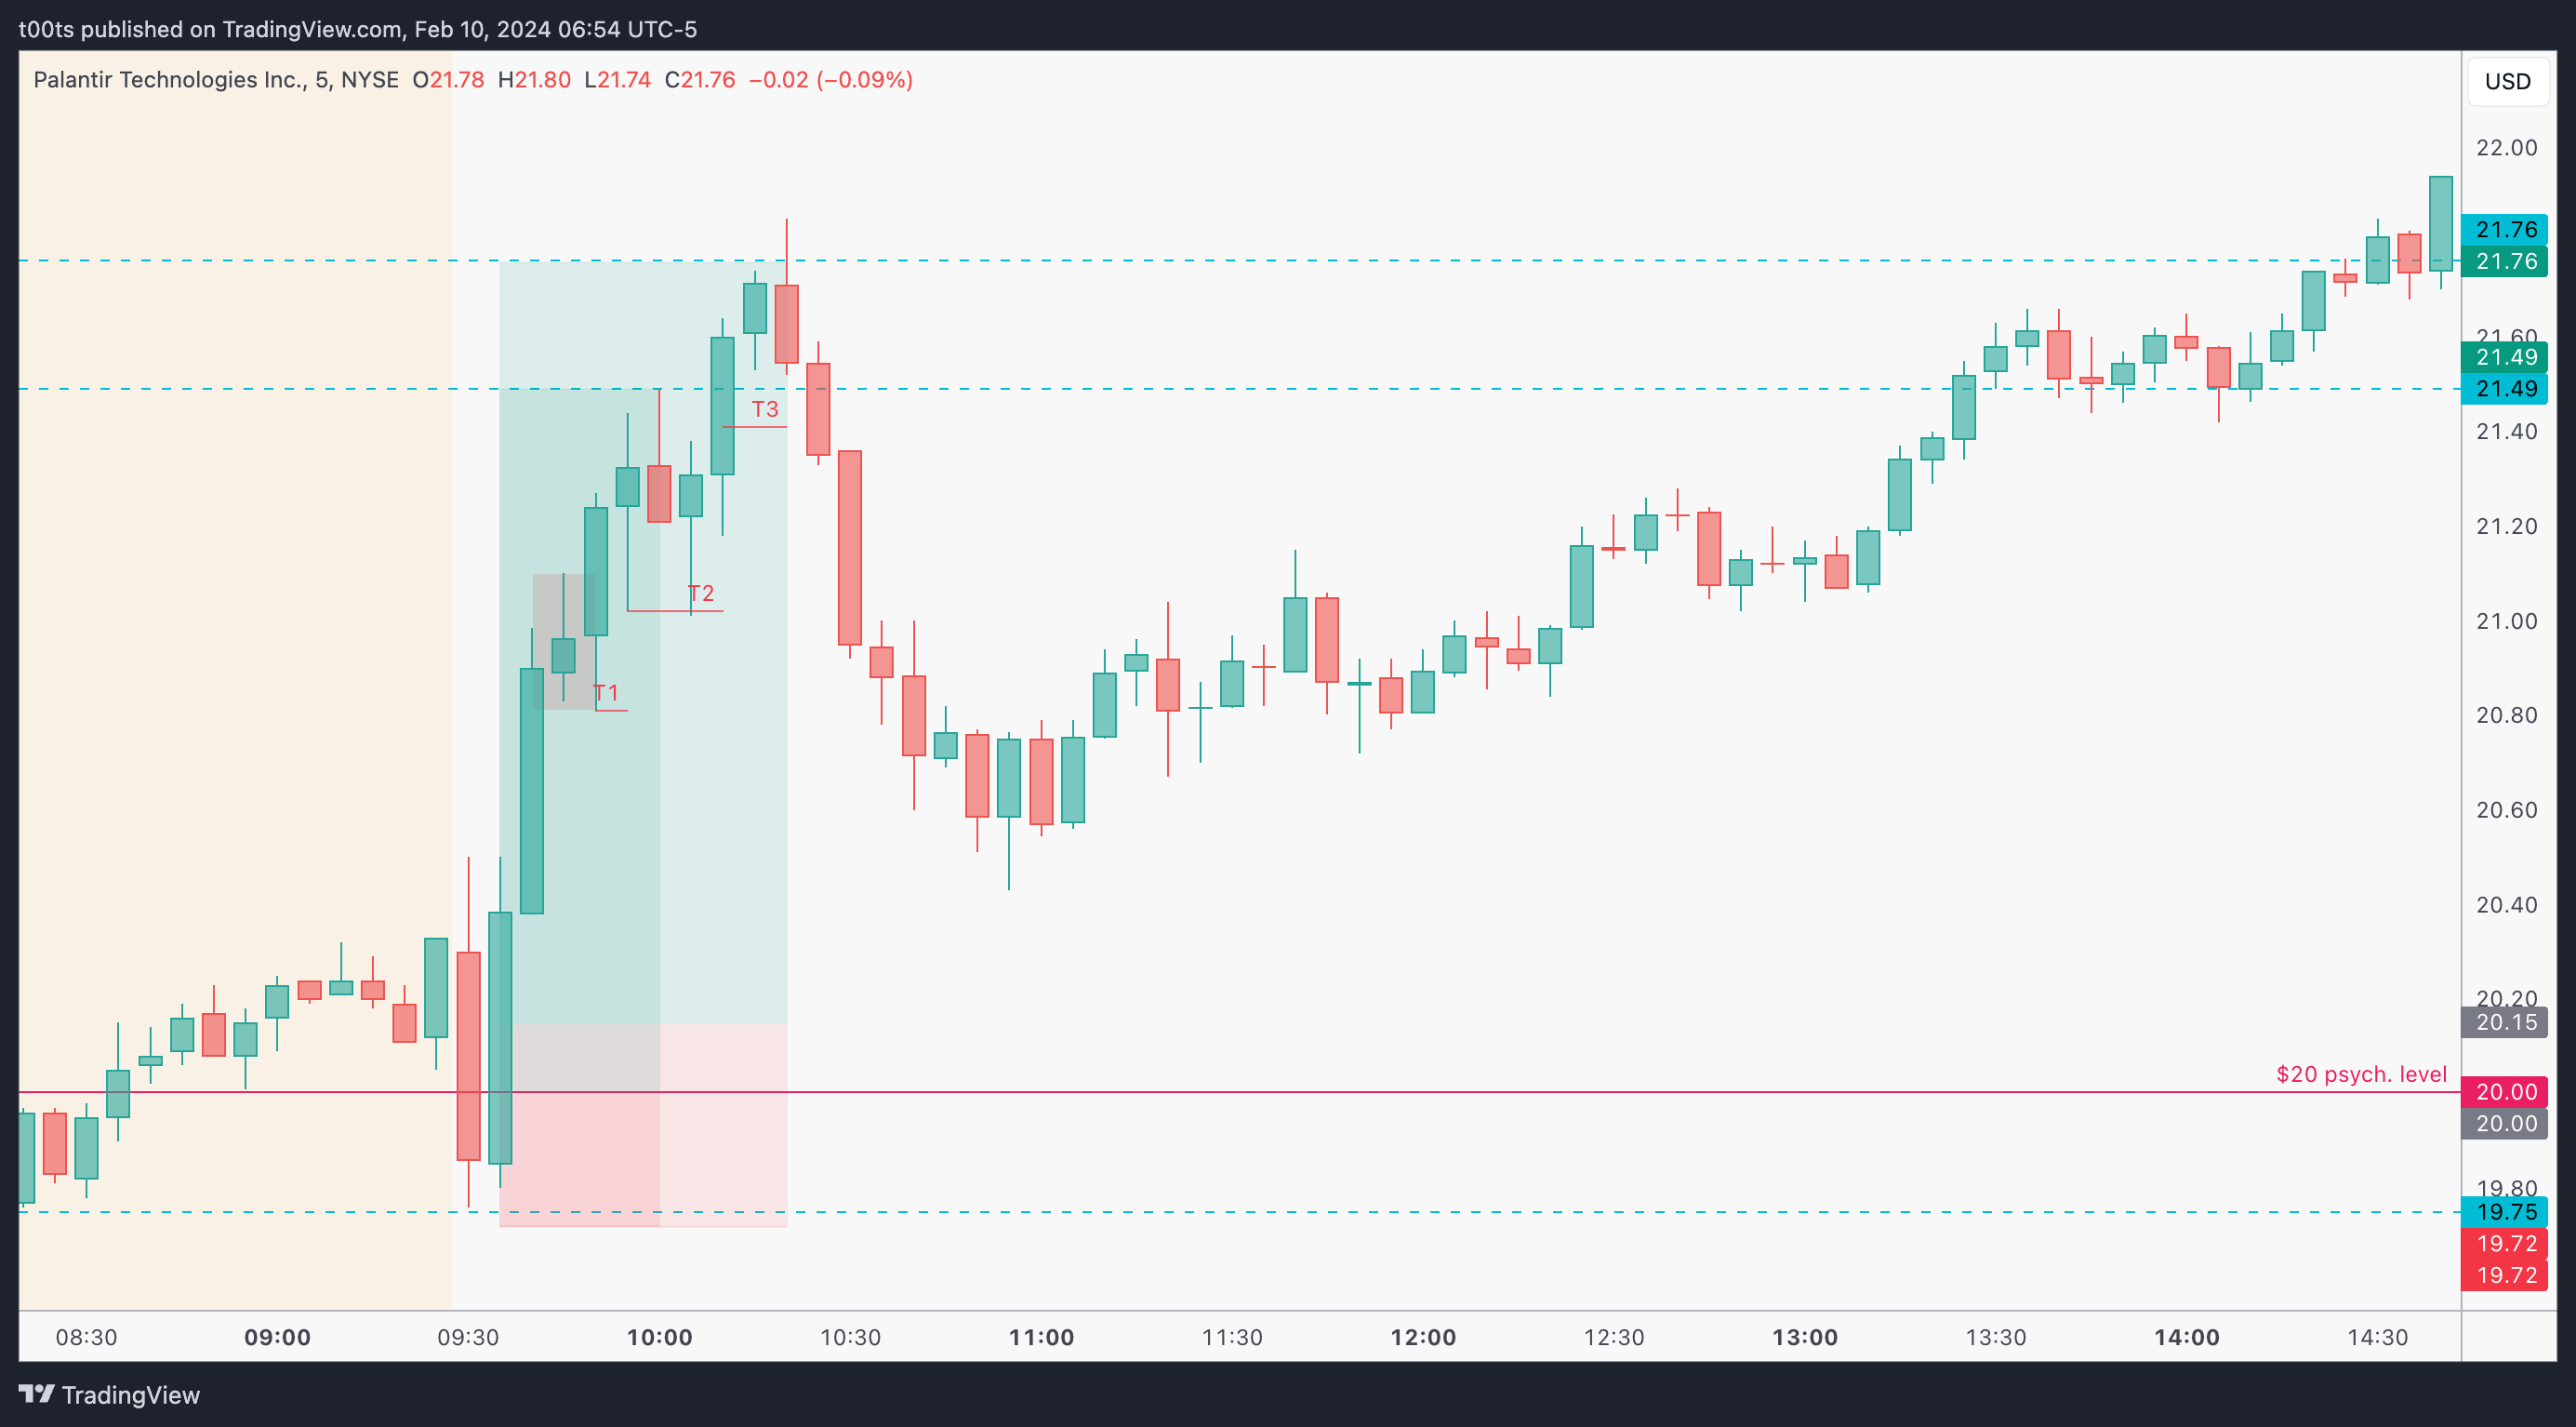
Thought I'd leave a 5m chart for context. Look at how clear that failure to go higher is at the top of our trade. That 5m bar rejecting at a level is not what I’d want to see to keep holding this trade. The moment the following bar breaks its lows you know it’s probably time to leave.
Closing notes
Earnings season is full of opportunities, and luckily for us, public companies are required to release earnings reports on a quarterly basis. This was another example of one of those trades that you'd rather not miss.
These setups repeat over and over again. I've tried to present enough cues and reasoning to get you ready for the next one.
I am posting one trade writeup every day throughout 2024. I focus on large caps using levels and price action. The subscription is absolutely free and will always be. I will strive to provide value by offering clues and ideas for you to enhance your edge. Let’s grow together!