
Microsoft (MSFT) - Jan 10th 2024
How and when to execute fearlessly straight off the open

Higher timeframe context
Microsoft has proven to be a market leader for quite some time now. Ever since their $10B strategic investment in OpenAI, investors have been piling in. While we're still in very early stages of this technological revolution, OpenAI has undoubtedly lead the way with the release of ChatGPT, DALL-E, and other state-of-the-art models. There's probably many investors who are using Microsoft stock as a proxy name to gain some exposure into OpenAI, yet the truth is both companies have been actively pushing AI-powered products to the market ever since, reinforcing the partnership itself.
Side note: This past Thursday Microsoft briefly overtook Apple as the world's most valuable company!
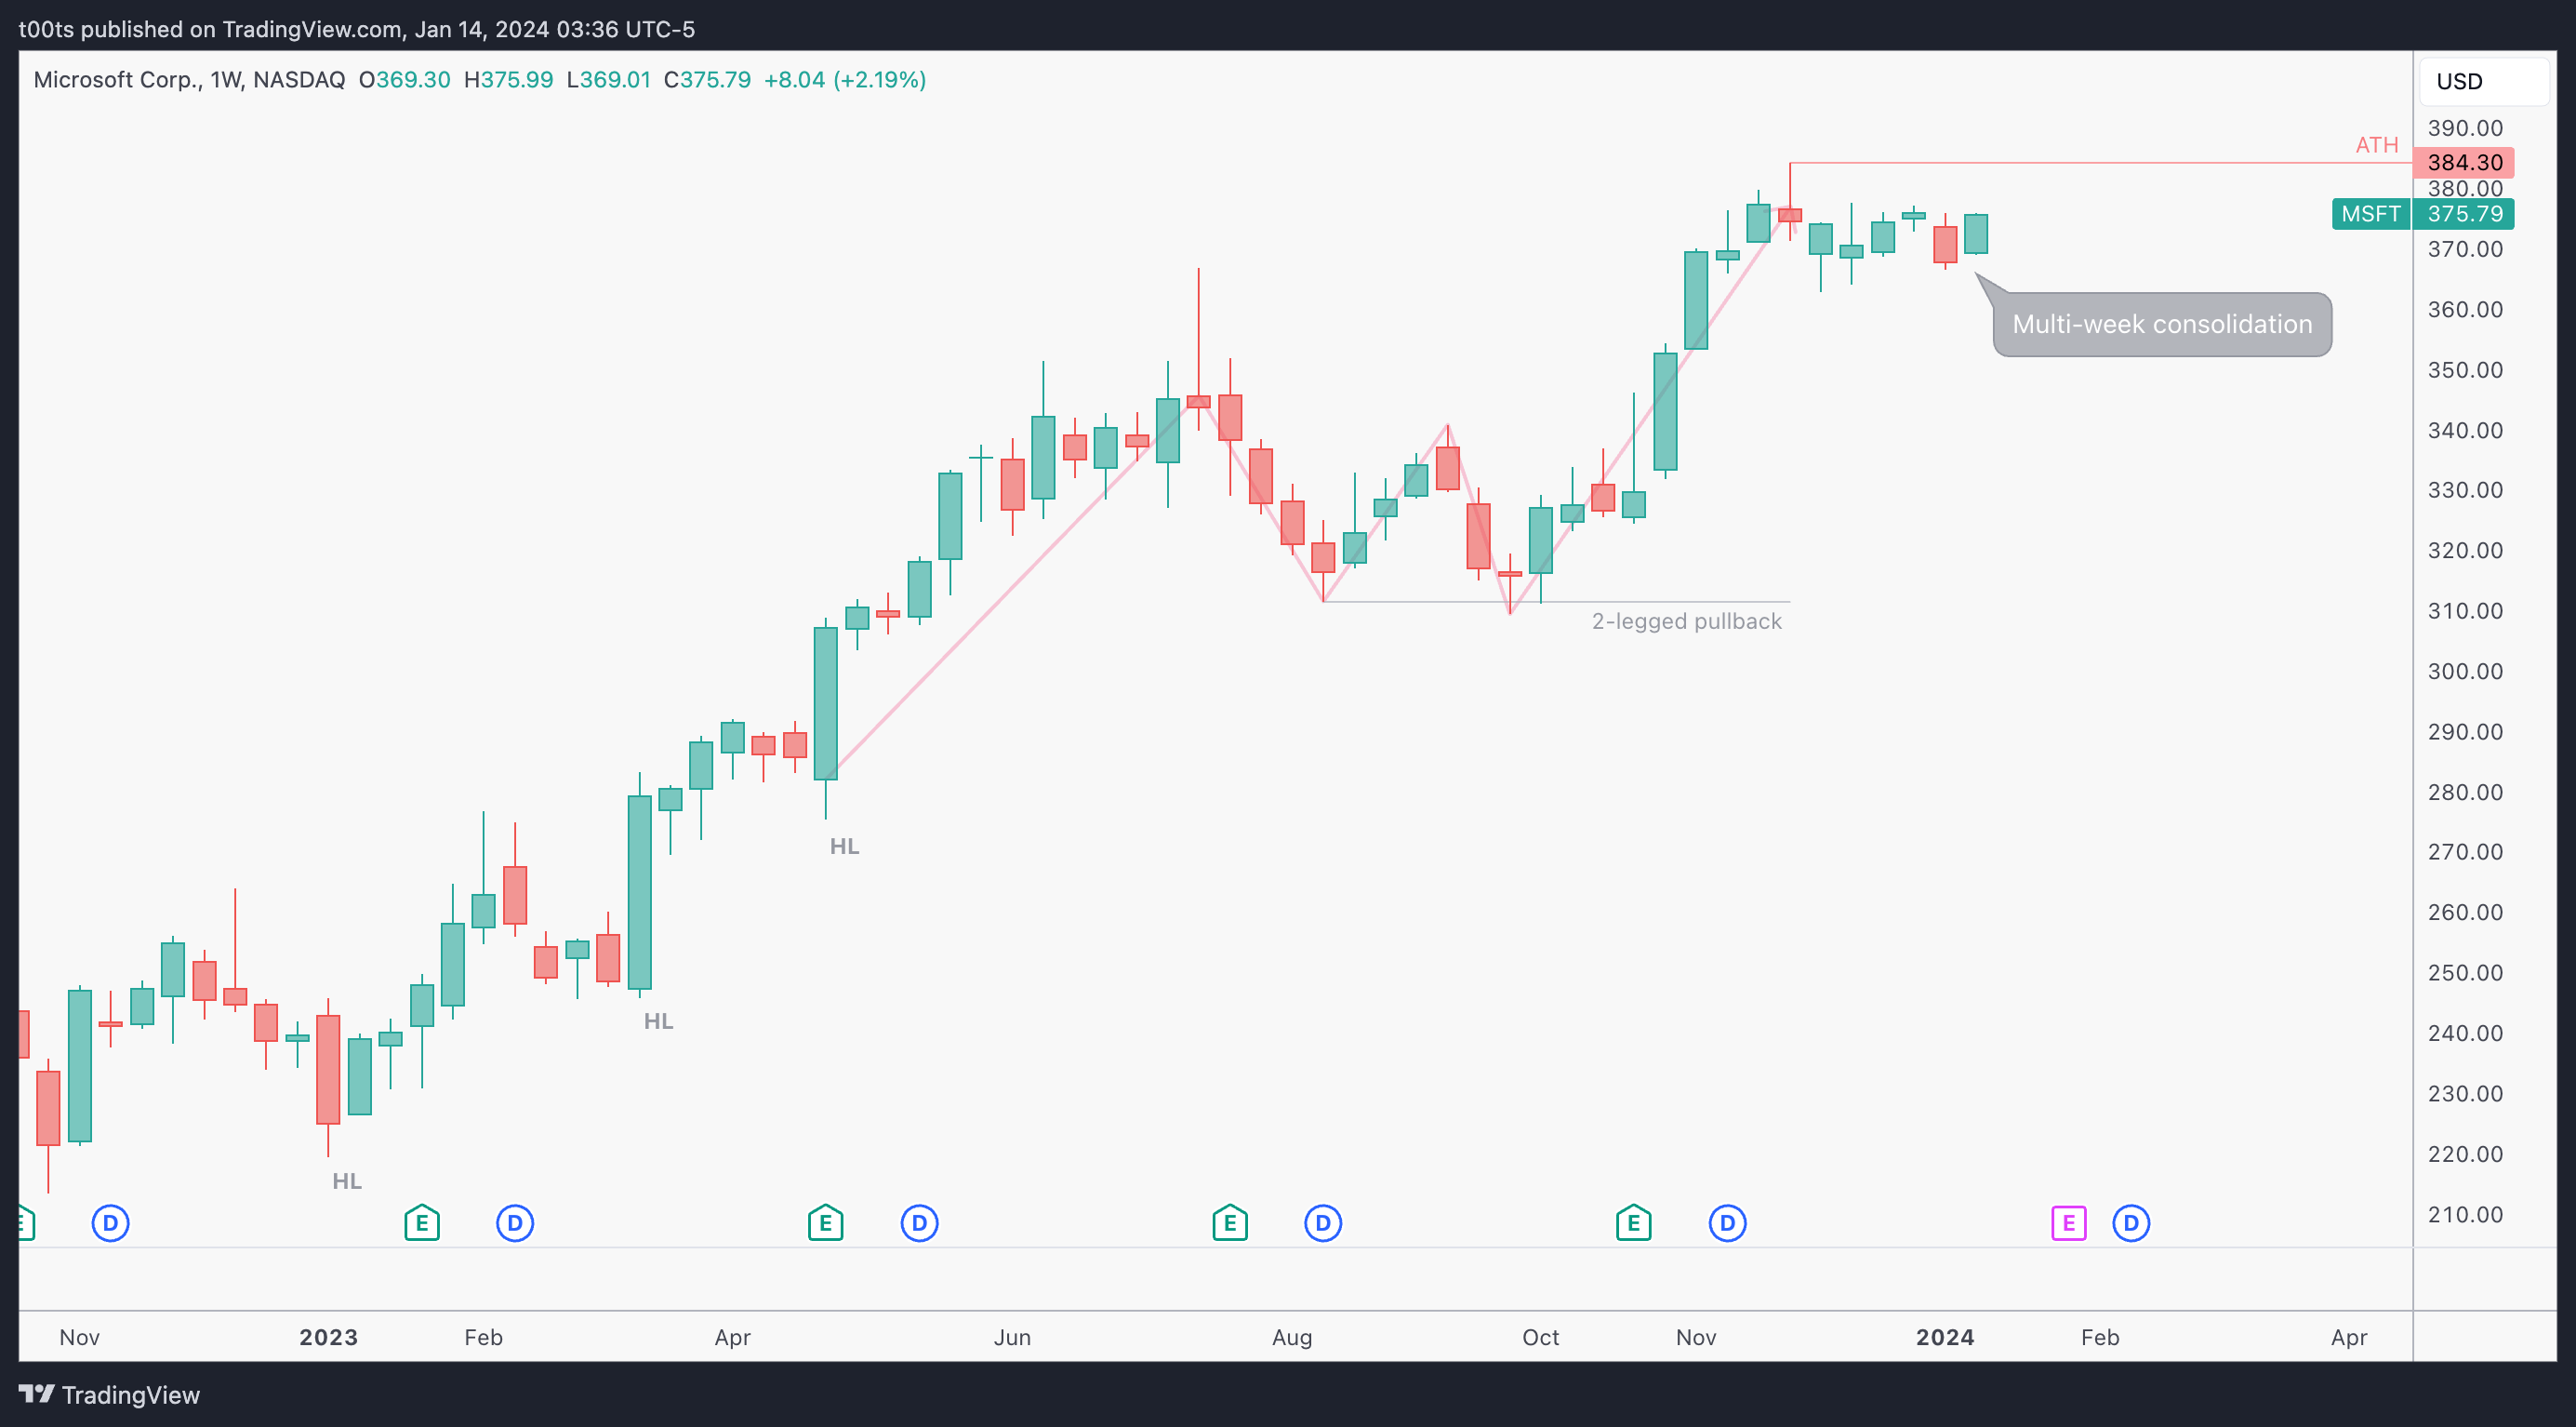
Weekly chart
There's just no doubt about how healthy this uptrend is. Price has been steadily climbing, making higher highs and lows, except for this last two-legged pullback towards the end of 2023, which lead to this next leg up.
Note that the second low of the two-legged pullback fails to go under the first low. I keep bringing this up because it's a recurrent theme. It happens all the time, and due to the fractal nature of the markets, today we observe it on the weekly chart.
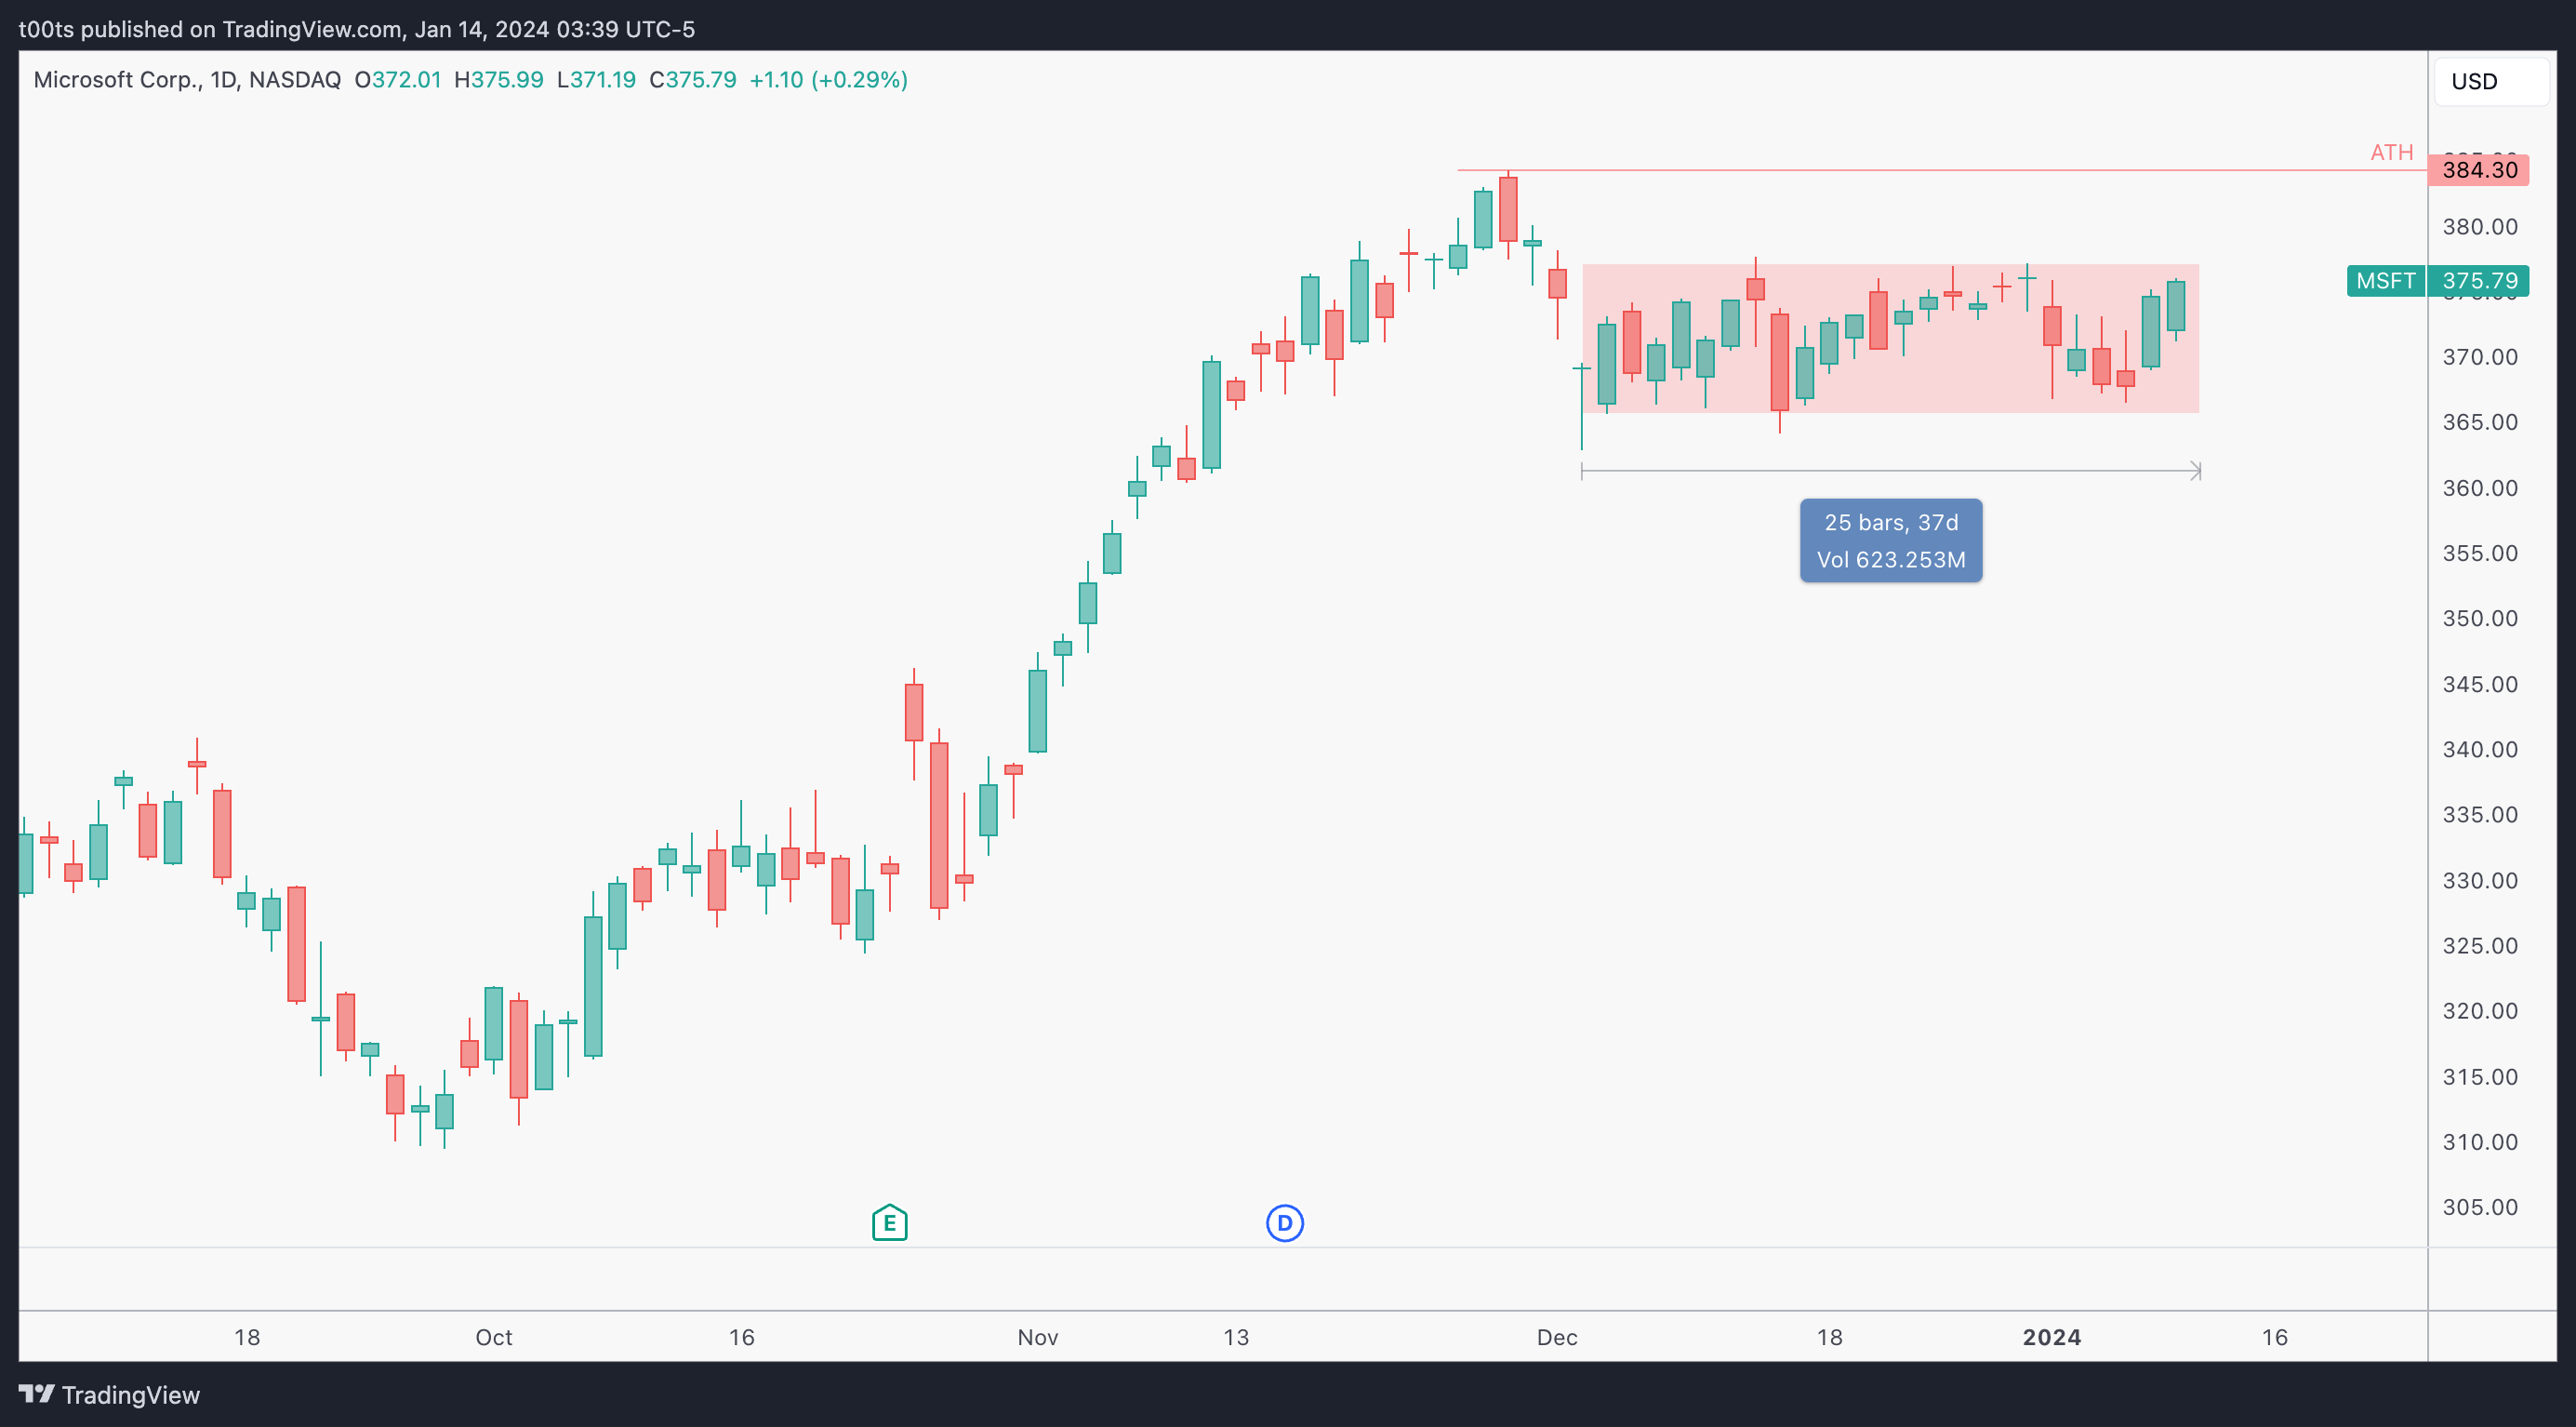
Daily chart
I've kept this chart extremely clean for a reason. The only thing I'd like us to focus on is this 25 bar range. Other market leaders like NVDA are breaking out of multi-month ranges, which makes MSFT a strong candidate for a breakout as well.
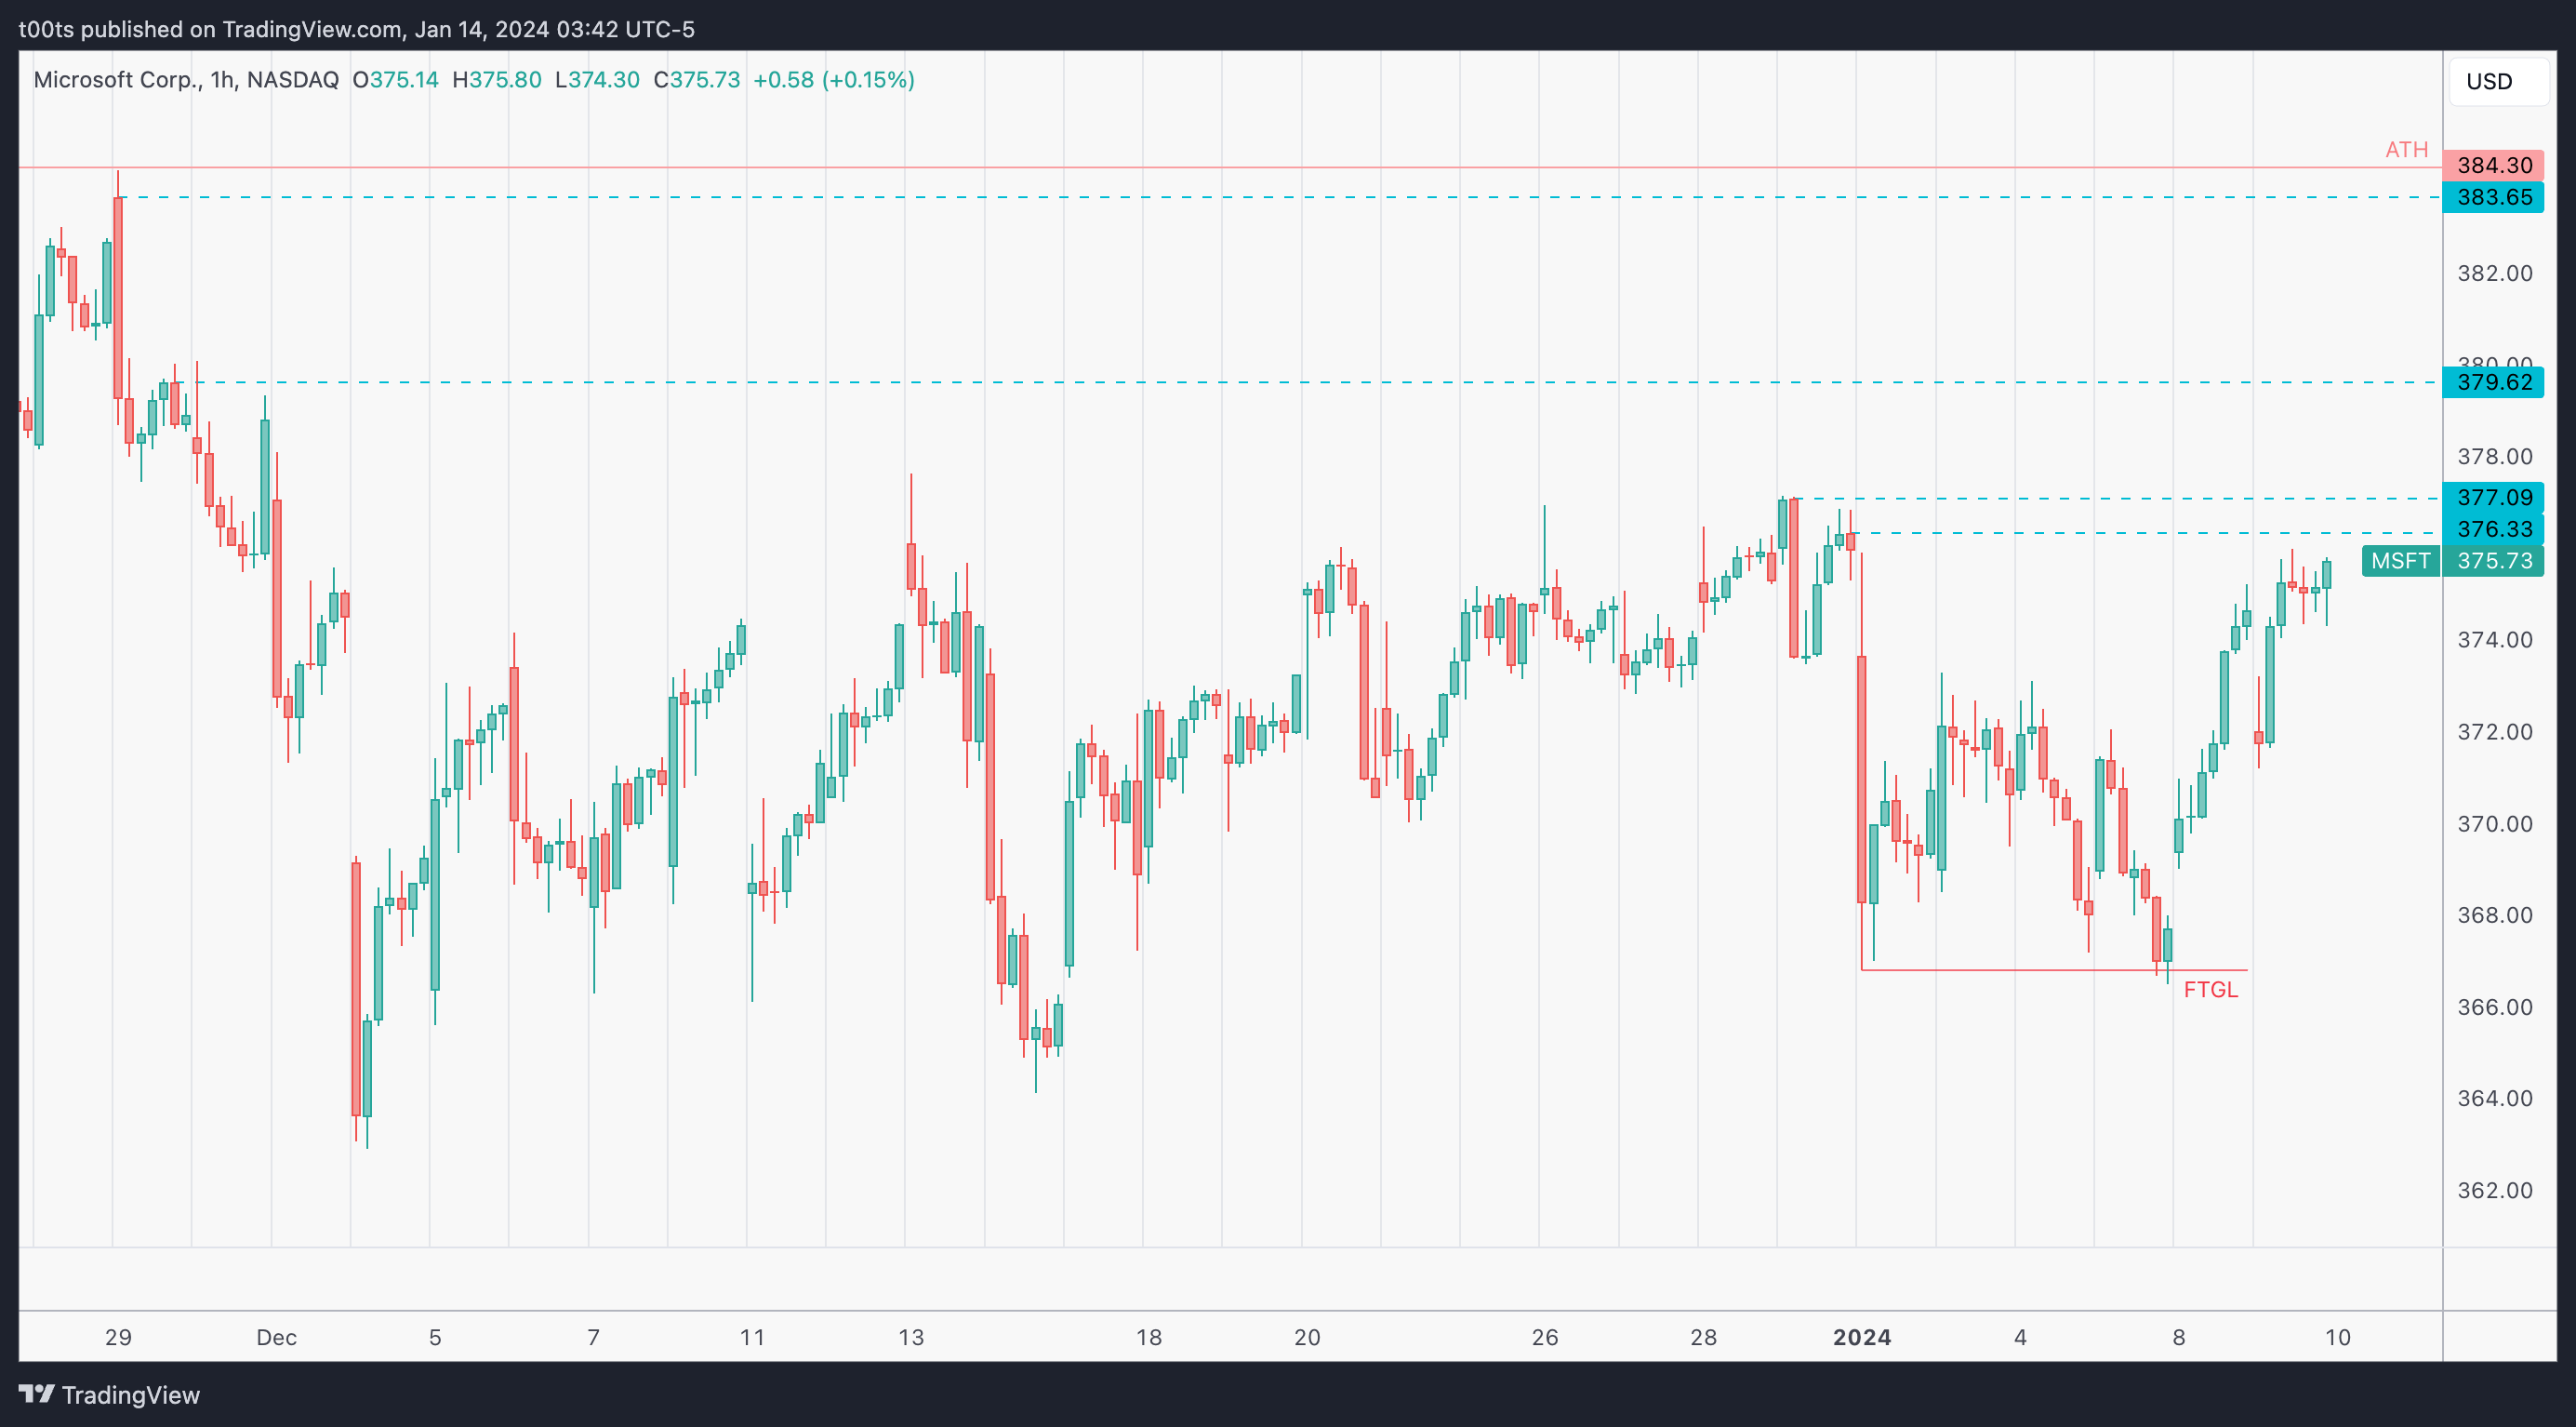
Hourly chart
Look at that failure at the lows of the range. Remember the market-wide pullback we got on the first trading day of the year? When price attempts to breakdown those lows we get an absolutely monster rally back up, confirming a trend flip (while still within the daily range). This is our first clear cue to believe a move higher is on the table.
Previous days action
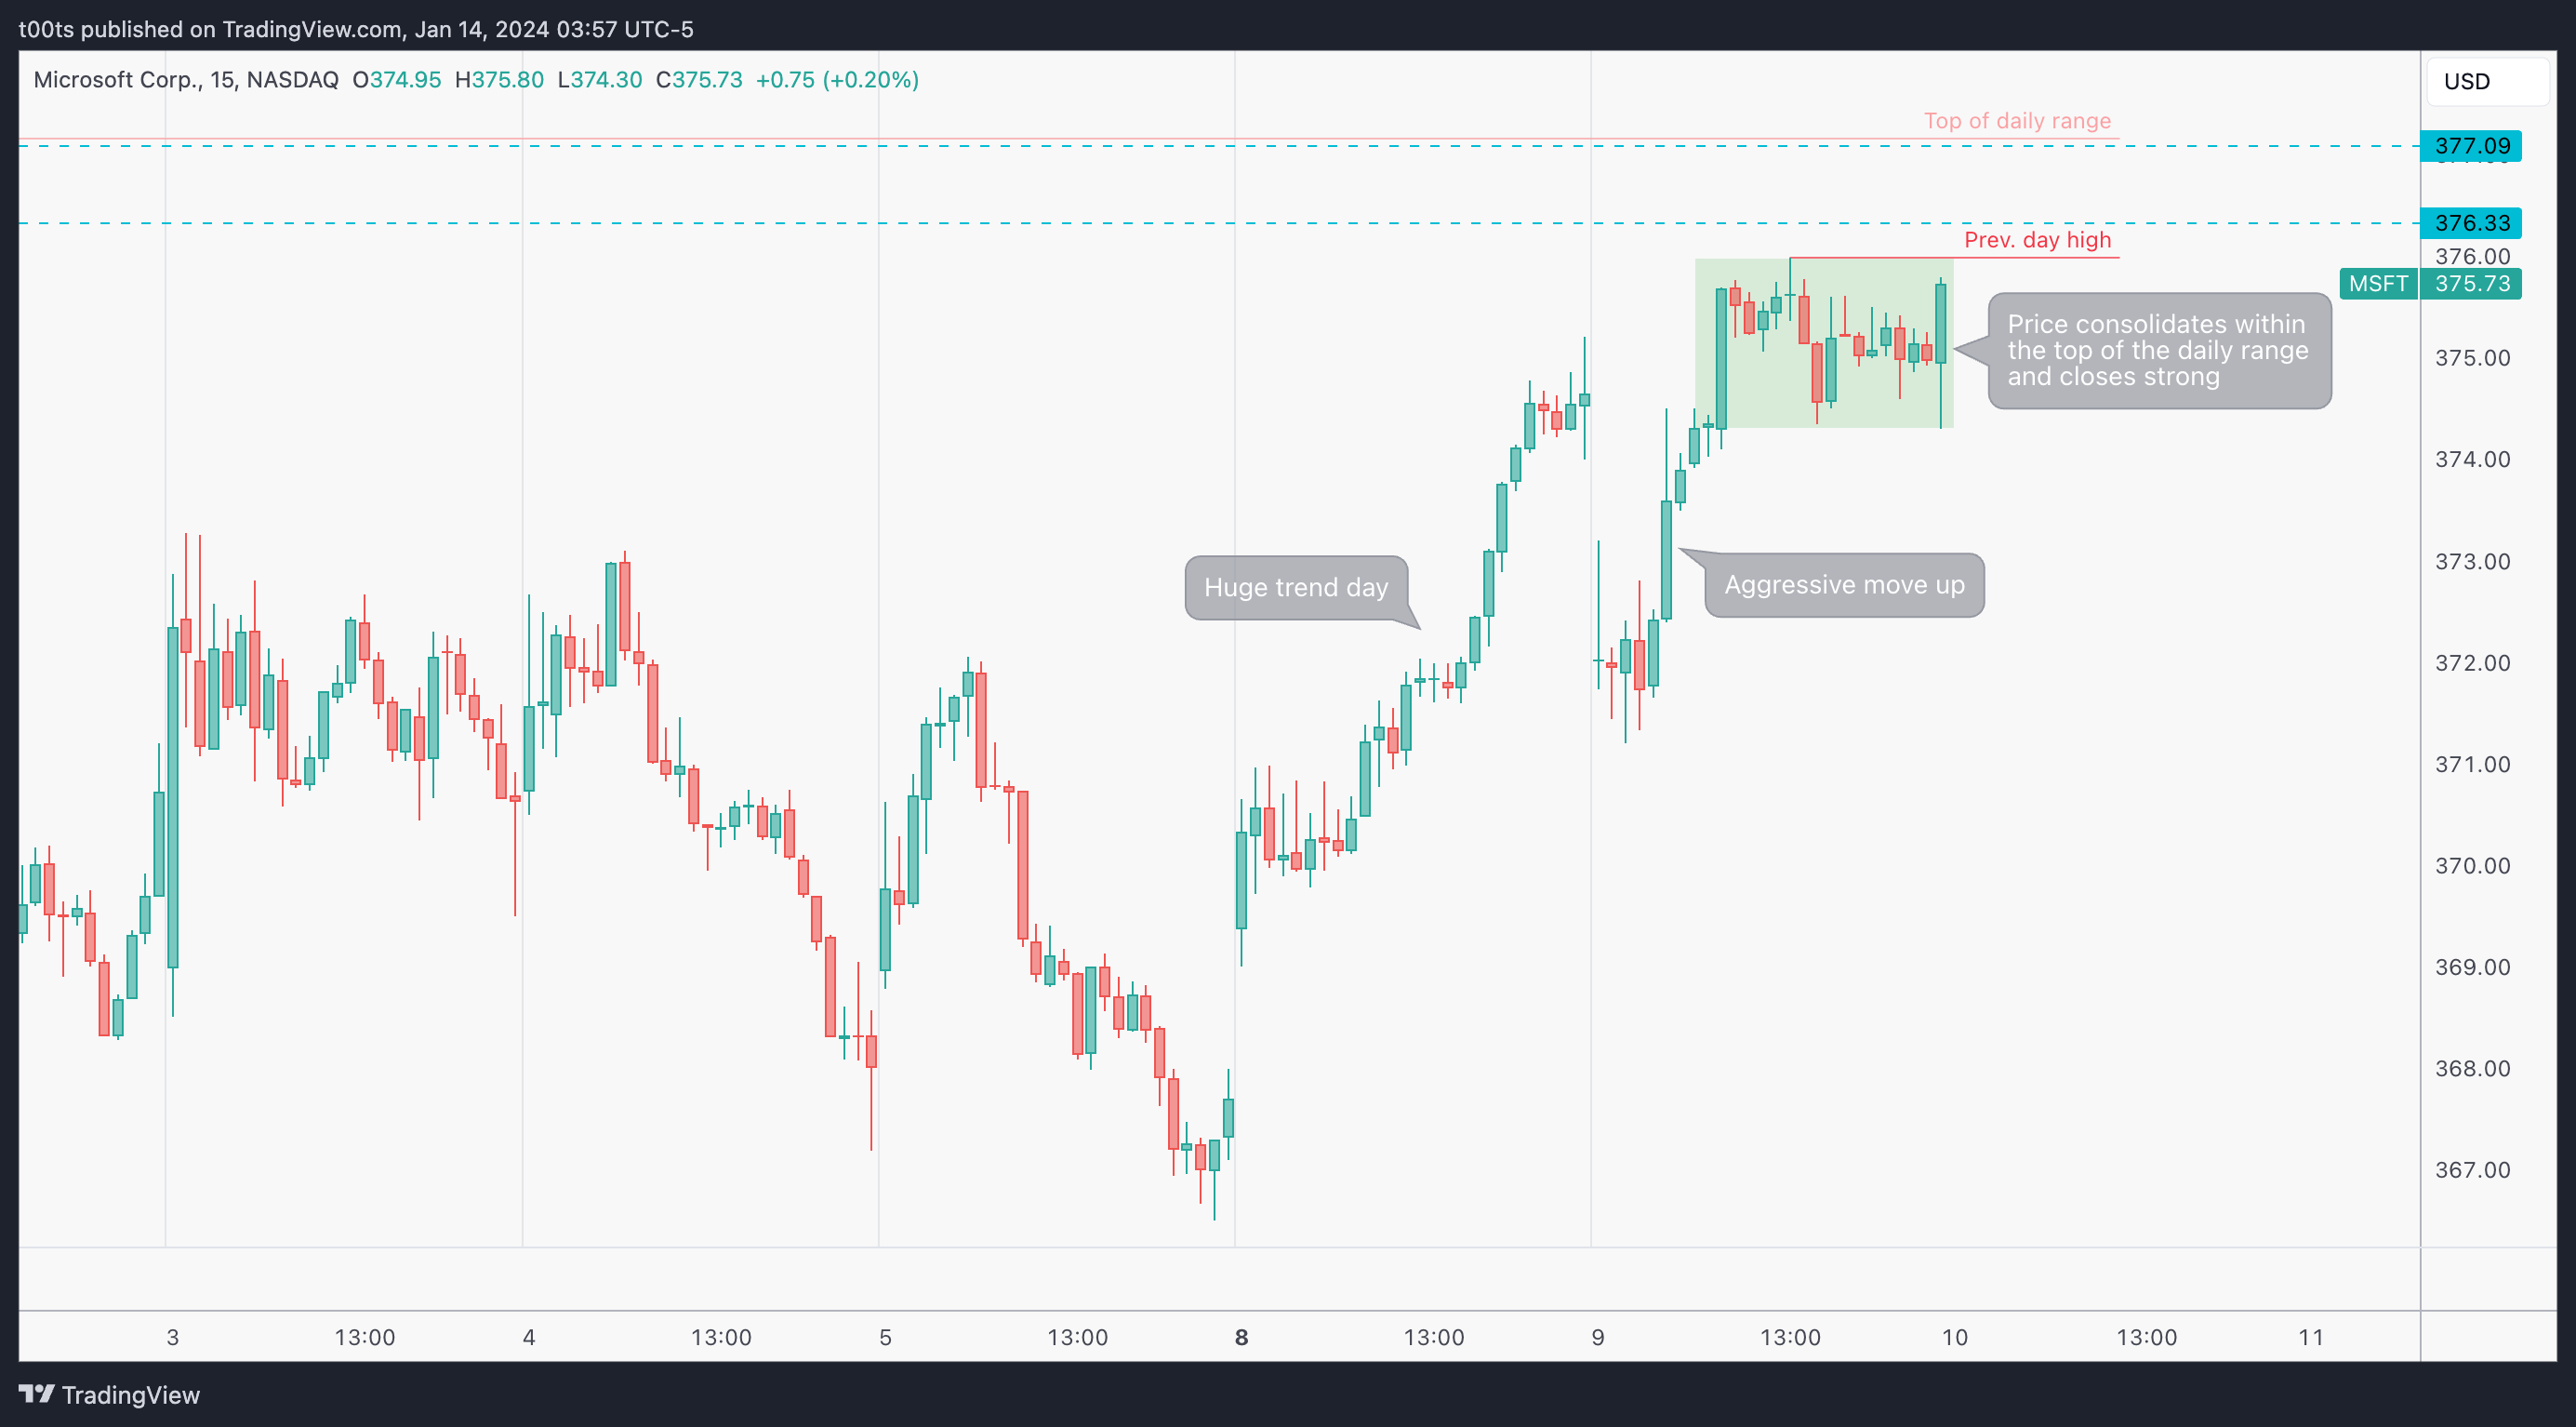
I feel it's necessary to dive deeper into what was actually going on leading into the trade we're about to go over, as this is what you'd be looking at to prepare for it.
Here is a 15m chart that includes the action from a few days leading into the trade. We can see how on Jan 8th we got a notable gap up which led to a monster rally that flipped the trend back into an uptrend. The following day, despite gapping down and a strong effort by sellers to push price down, buyers took over and pushed the stock above previous day's highs. Price then consolidated for the rest of the day above the upper half of the daily range, closing pretty much at its highs.
Pre-market action
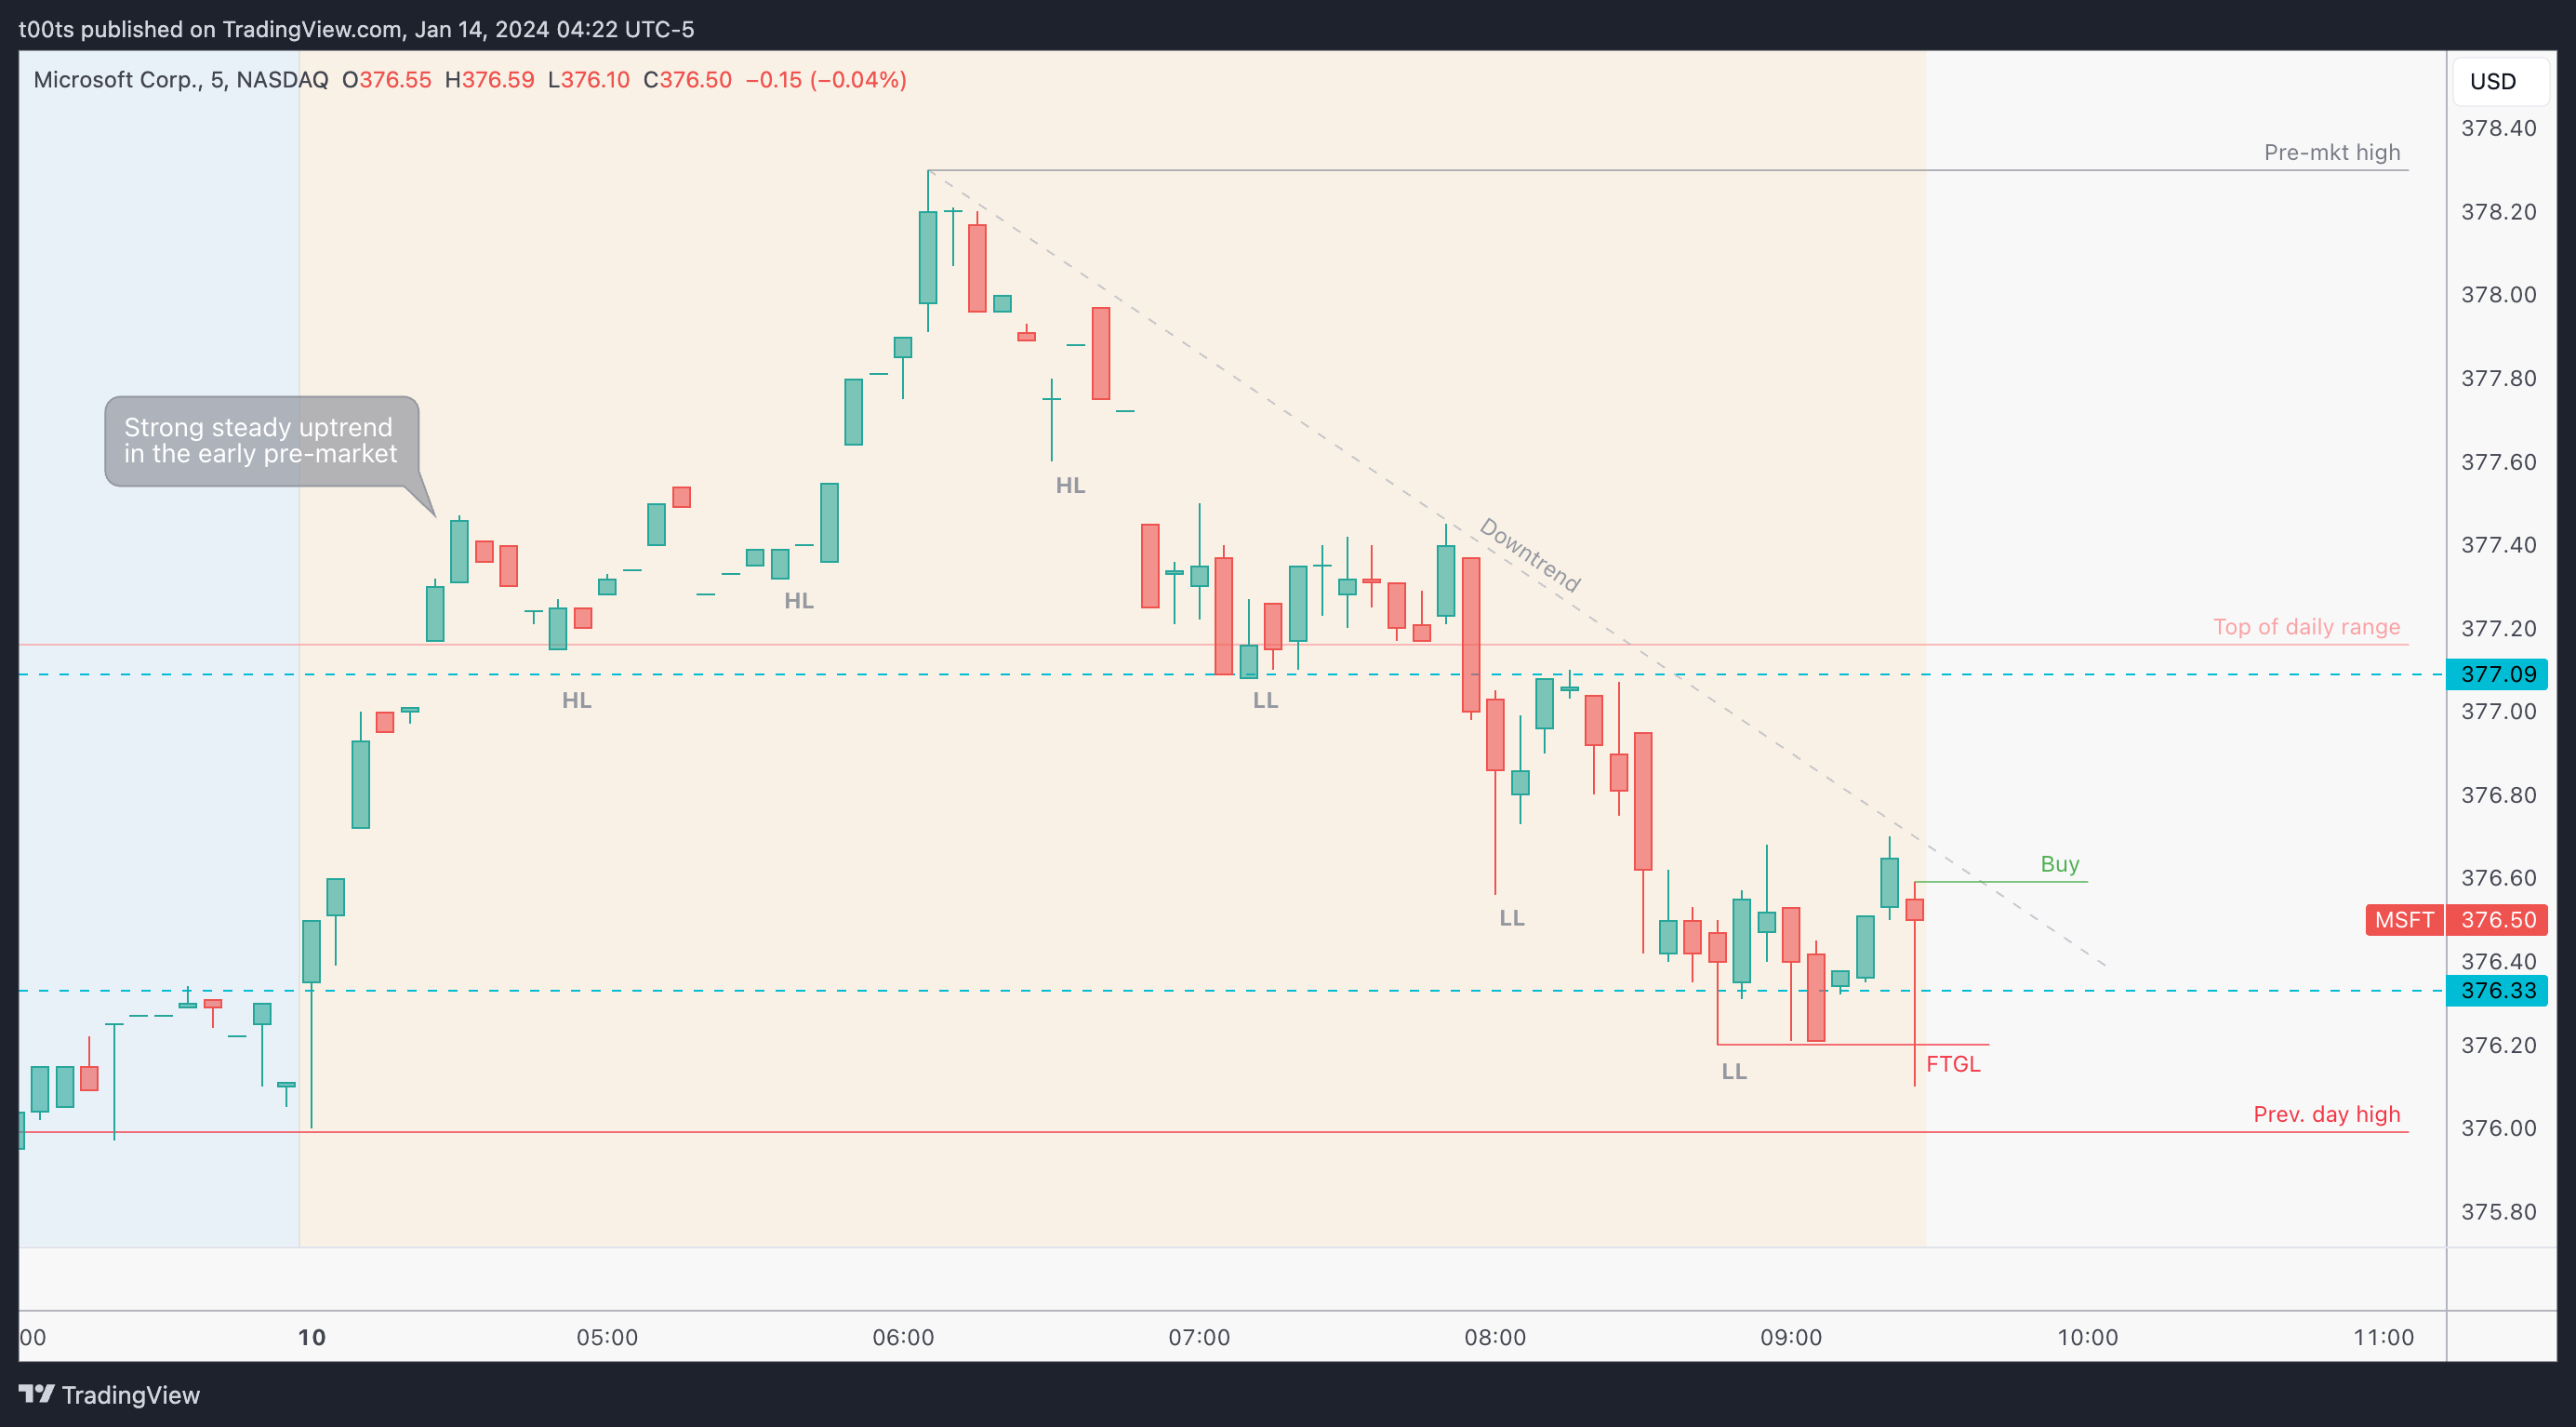
Microsoft is set to open pretty much flat after attempting to break the range during the early pre-market session and failing. This was probably due to the overall market dragging her down a bit, but regardless, the overall context is still bullish for us. If we were to see a rejection at the $377.09 level we could consider looking for a second entry to take the short. But right now, we are in a strong uptrend as we just went over in the chart above, so there's no room for shorts in our gameplan.
While the stock trending down into the open, we do get a pretty convenient failure pattern as price tries to trade below the $376.33 level. We've seen these before during market hours, so what's stopping us from using this 9:25 5m bar as our signal bar for longs?
The trade
This trade was an absolute monster opportunity which I've been wanting to go over all week. The multiple entries and exits this chart provided offered plays anywhere between 5 to 18R. Let's dive in.
Using our CPT Framework:
Cue(s)
NVDA, another market leader, just broke out of a multi-month range
Stock is set to open at the top of a multi-week range
Bulls have been in total control the past couple days after a failure pattern
Previous day's closing price action remained in the top half of the daily range
Failure to go lower signal bar off a level leading into the open
Plan
The great thing about our current pre-market scenario is that our risk is super tight. This convenient signal bar we just got gives us a clear entry for us to bet on the daily range breakout straight off the open.
In terms of stops, we have a few, and all in the same area. The immediate option is to use the signal bar low, which already sits below a key level, adding further confluence to our long scenario. But we could also go a little further and risk against previous day highs. Both allow for tight stops.
Our targets are the levels above: $379.62 and $383.64.
Trigger
Break above the signal bar highs.
5m chart
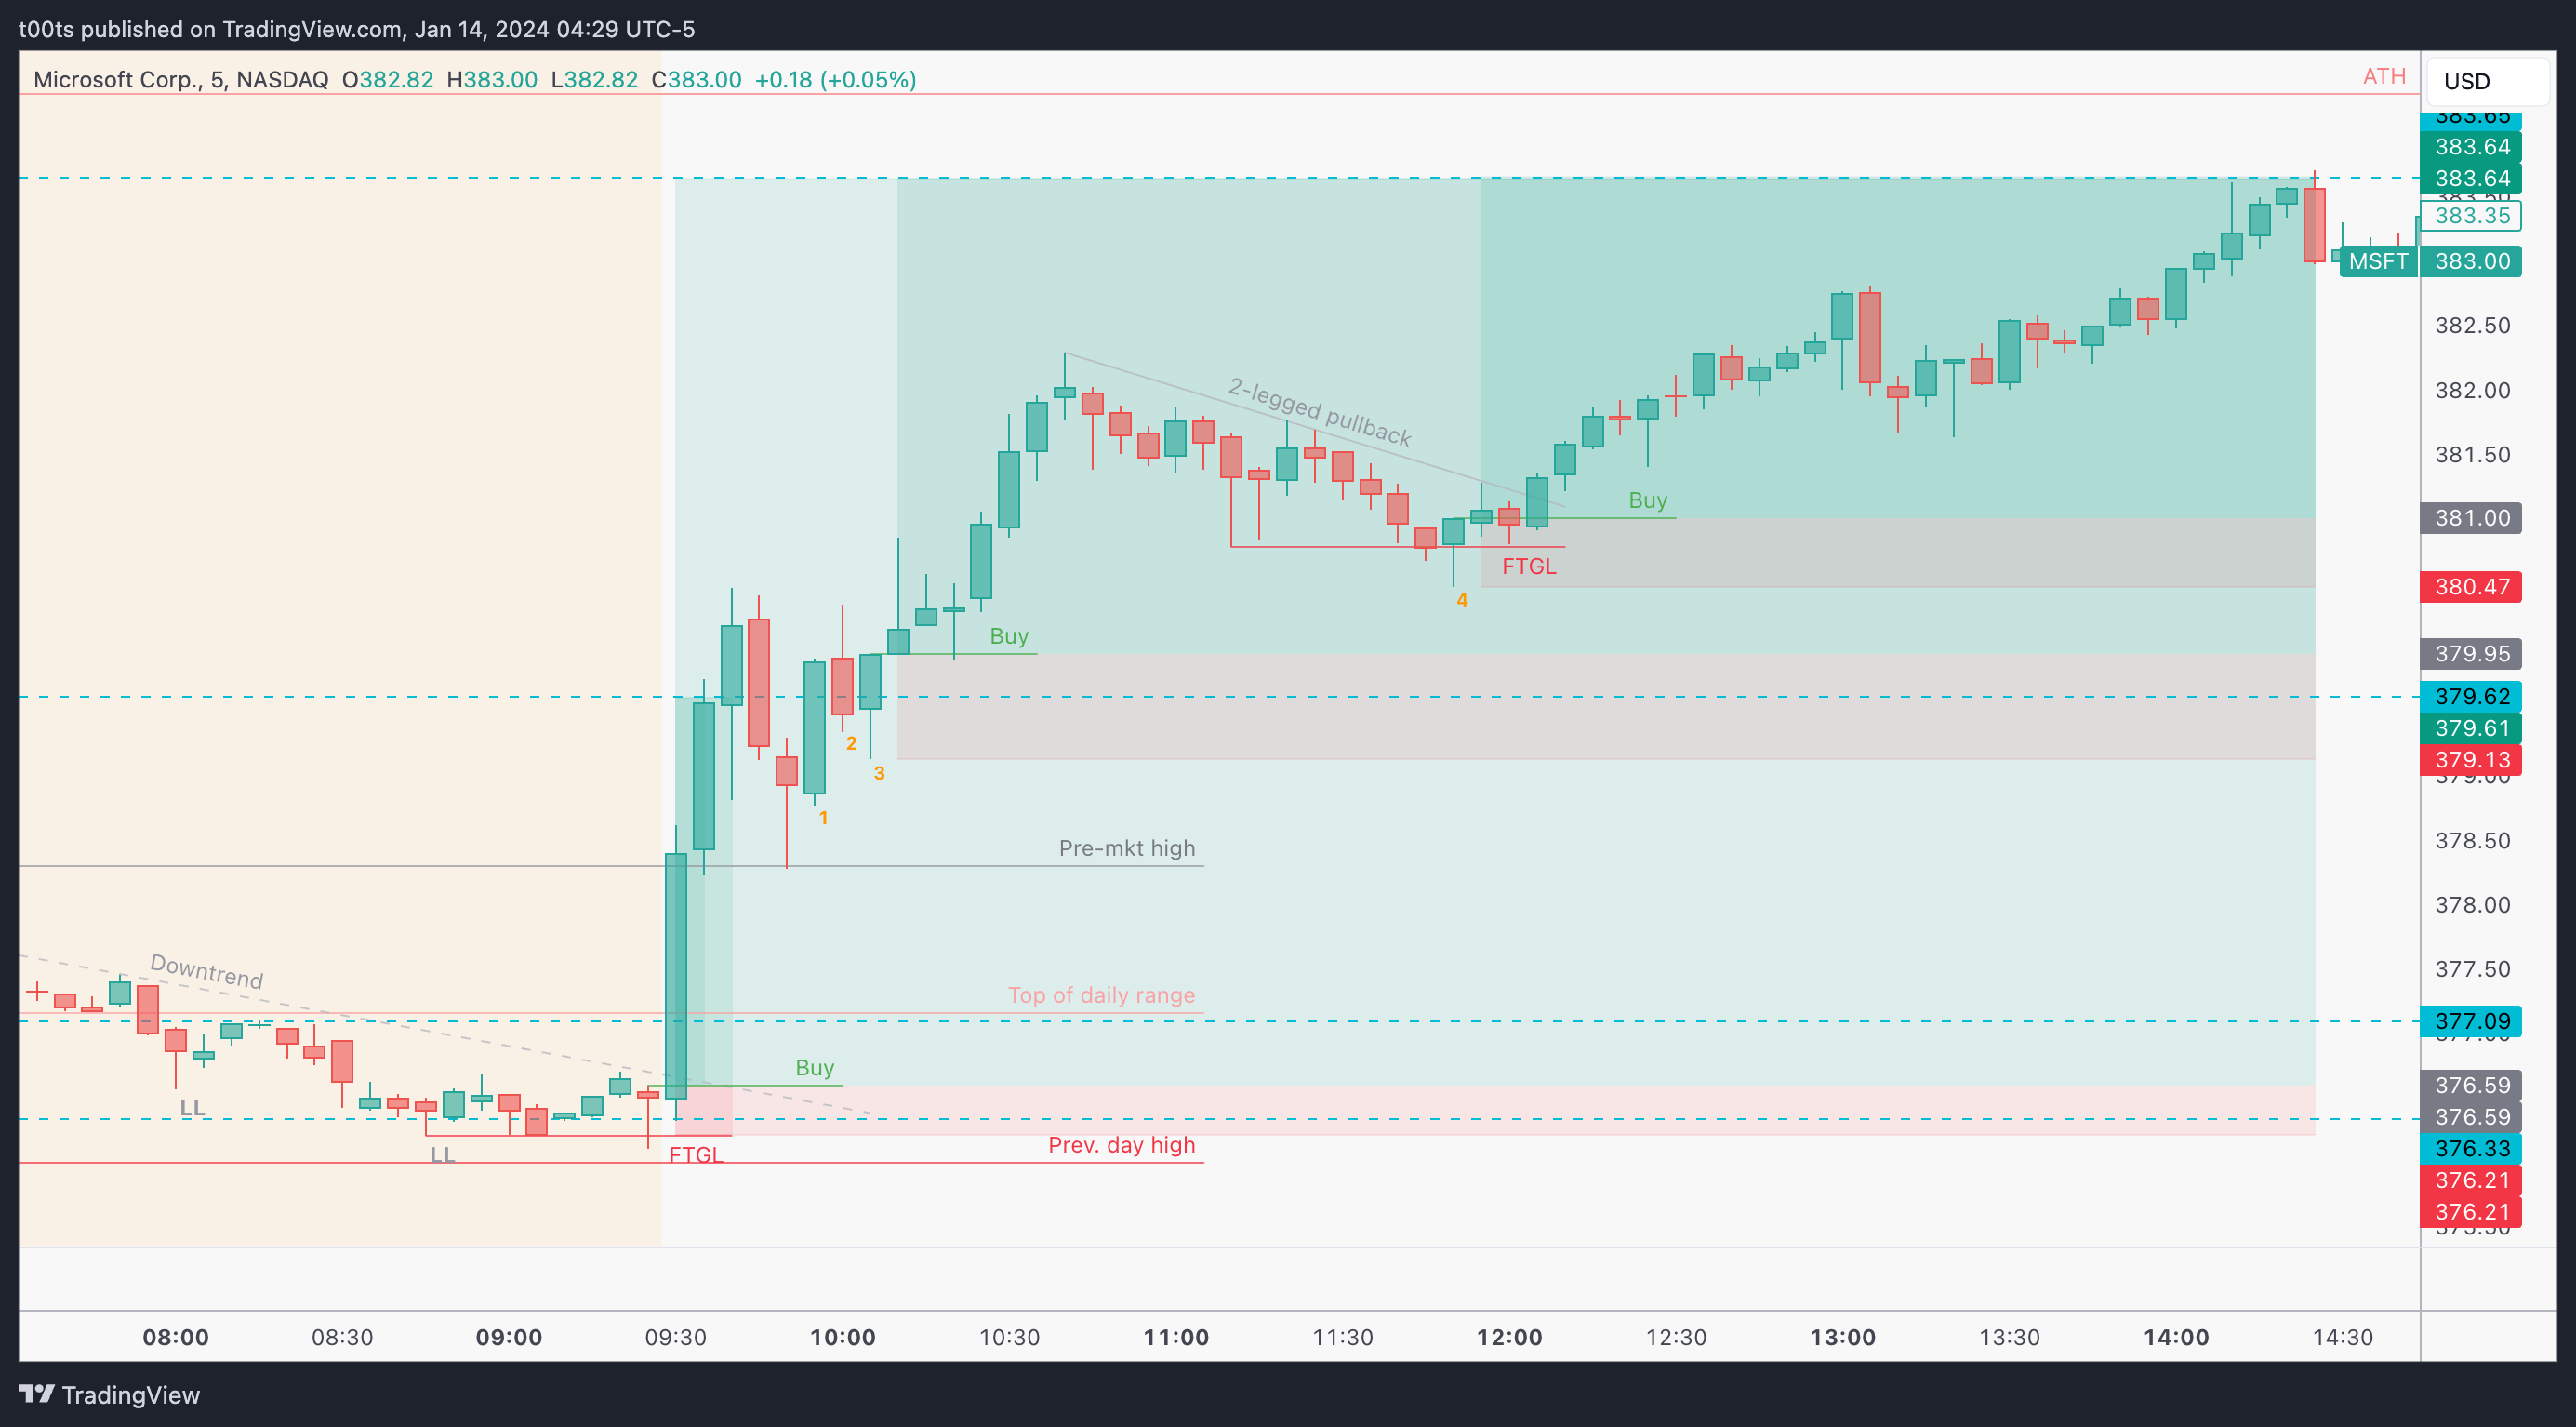
This was a super fast opening drive. You could either swing this or be ready to execute as soon as it triggered. The first trim came 10m into the day, offering 7-8 R straight off the open. From there, it was just a matter of holding a core and potentially scalping shorter-term options along the way.
Holding the core is not hard if you zoom out and understand the bigger picture we're in. It's really that simple. Once you pull up a daily chart and you see the stock breaking out of that multi-week range, it's easier to remain comfortable holding through intraday pullbacks. Of course there’s always a chance of failure, but that's just part of the game.
Let's quickly go over other potential entries this chart offered. If you miss the opening print, there were other opportunities to get involved:
Pre-market high bounce. This is not really a part of my strategy/playbook, so won't go over it, but I thought I'd mention it as many traders use this strategy.
3-bar play. I've marked the bars with a 1, 2 and 3 respectively. This 3-bar play sets up on the second leg of a bullish pullback. In my opinion, a solid potential entry for a continuation long after resting. Here’s why:
Bar 1 is a strong bull trend that keeps the momentum from the pre-market high bounce.
Bar 2 fails to go higher, leading to our second leg down of this bullish pullback.
Bar 3 fails to go lower.
We've seen this before, right? A failed failure. These patterns, more often than not, lead to great trades, especially if, like this one, they're in the direction of the overall trend.
FTGL on two-legged pullback. We just discussed this setup in the weekly chart above and here we have it again. I feel like a broken record but these entries are always worth taking in strong trends. I marked the signal bar with a 4 in the chart above. Another clean entry for a continuation move up into the next level.
Closing notes
Back in 2020, when we were bouncing back from COVID lows, this opening drive play happened almost every single day. We eventually stopped getting these plays, and after a rough 2022, I started moving away from scalping into being more of a day trader. For me, that means identifying high-potential setups, finding solid intraday entries, and holding for larger moves.
This was a great opportunity to catch one of those larger moves. When these setups present themselves, you must be ready to execute, fearlessly, straight off the open. Once your risk is established, the market can't hurt you.
I am posting one trade writeup every day throughout 2024. I focus on large caps using levels and price action. The subscription is absolutely free and will always be. I will strive to provide value by offering clues and ideas for you to enhance your edge. Let’s grow together!