
Meta Platforms (META) - Jan 10th 2024
Exploring how short positions propel the continuous upswing of this stock

Higher timeframe context
I often wonder what drives this stock. Seriously. It's just been on an absolute tear since the 2022 lows and it won't stop. What is the fundamental change in their business that I can't seem to figure out? Yes they are doing some AI (and being more vocal about it), and yes they've pushed the metaverse narrative aside for a bit, but is that really all it takes for the stock to triple its value in 12 months?
Please feel free to drop your comments on this below.
Now let’s dive into the charts.
Weekly chart
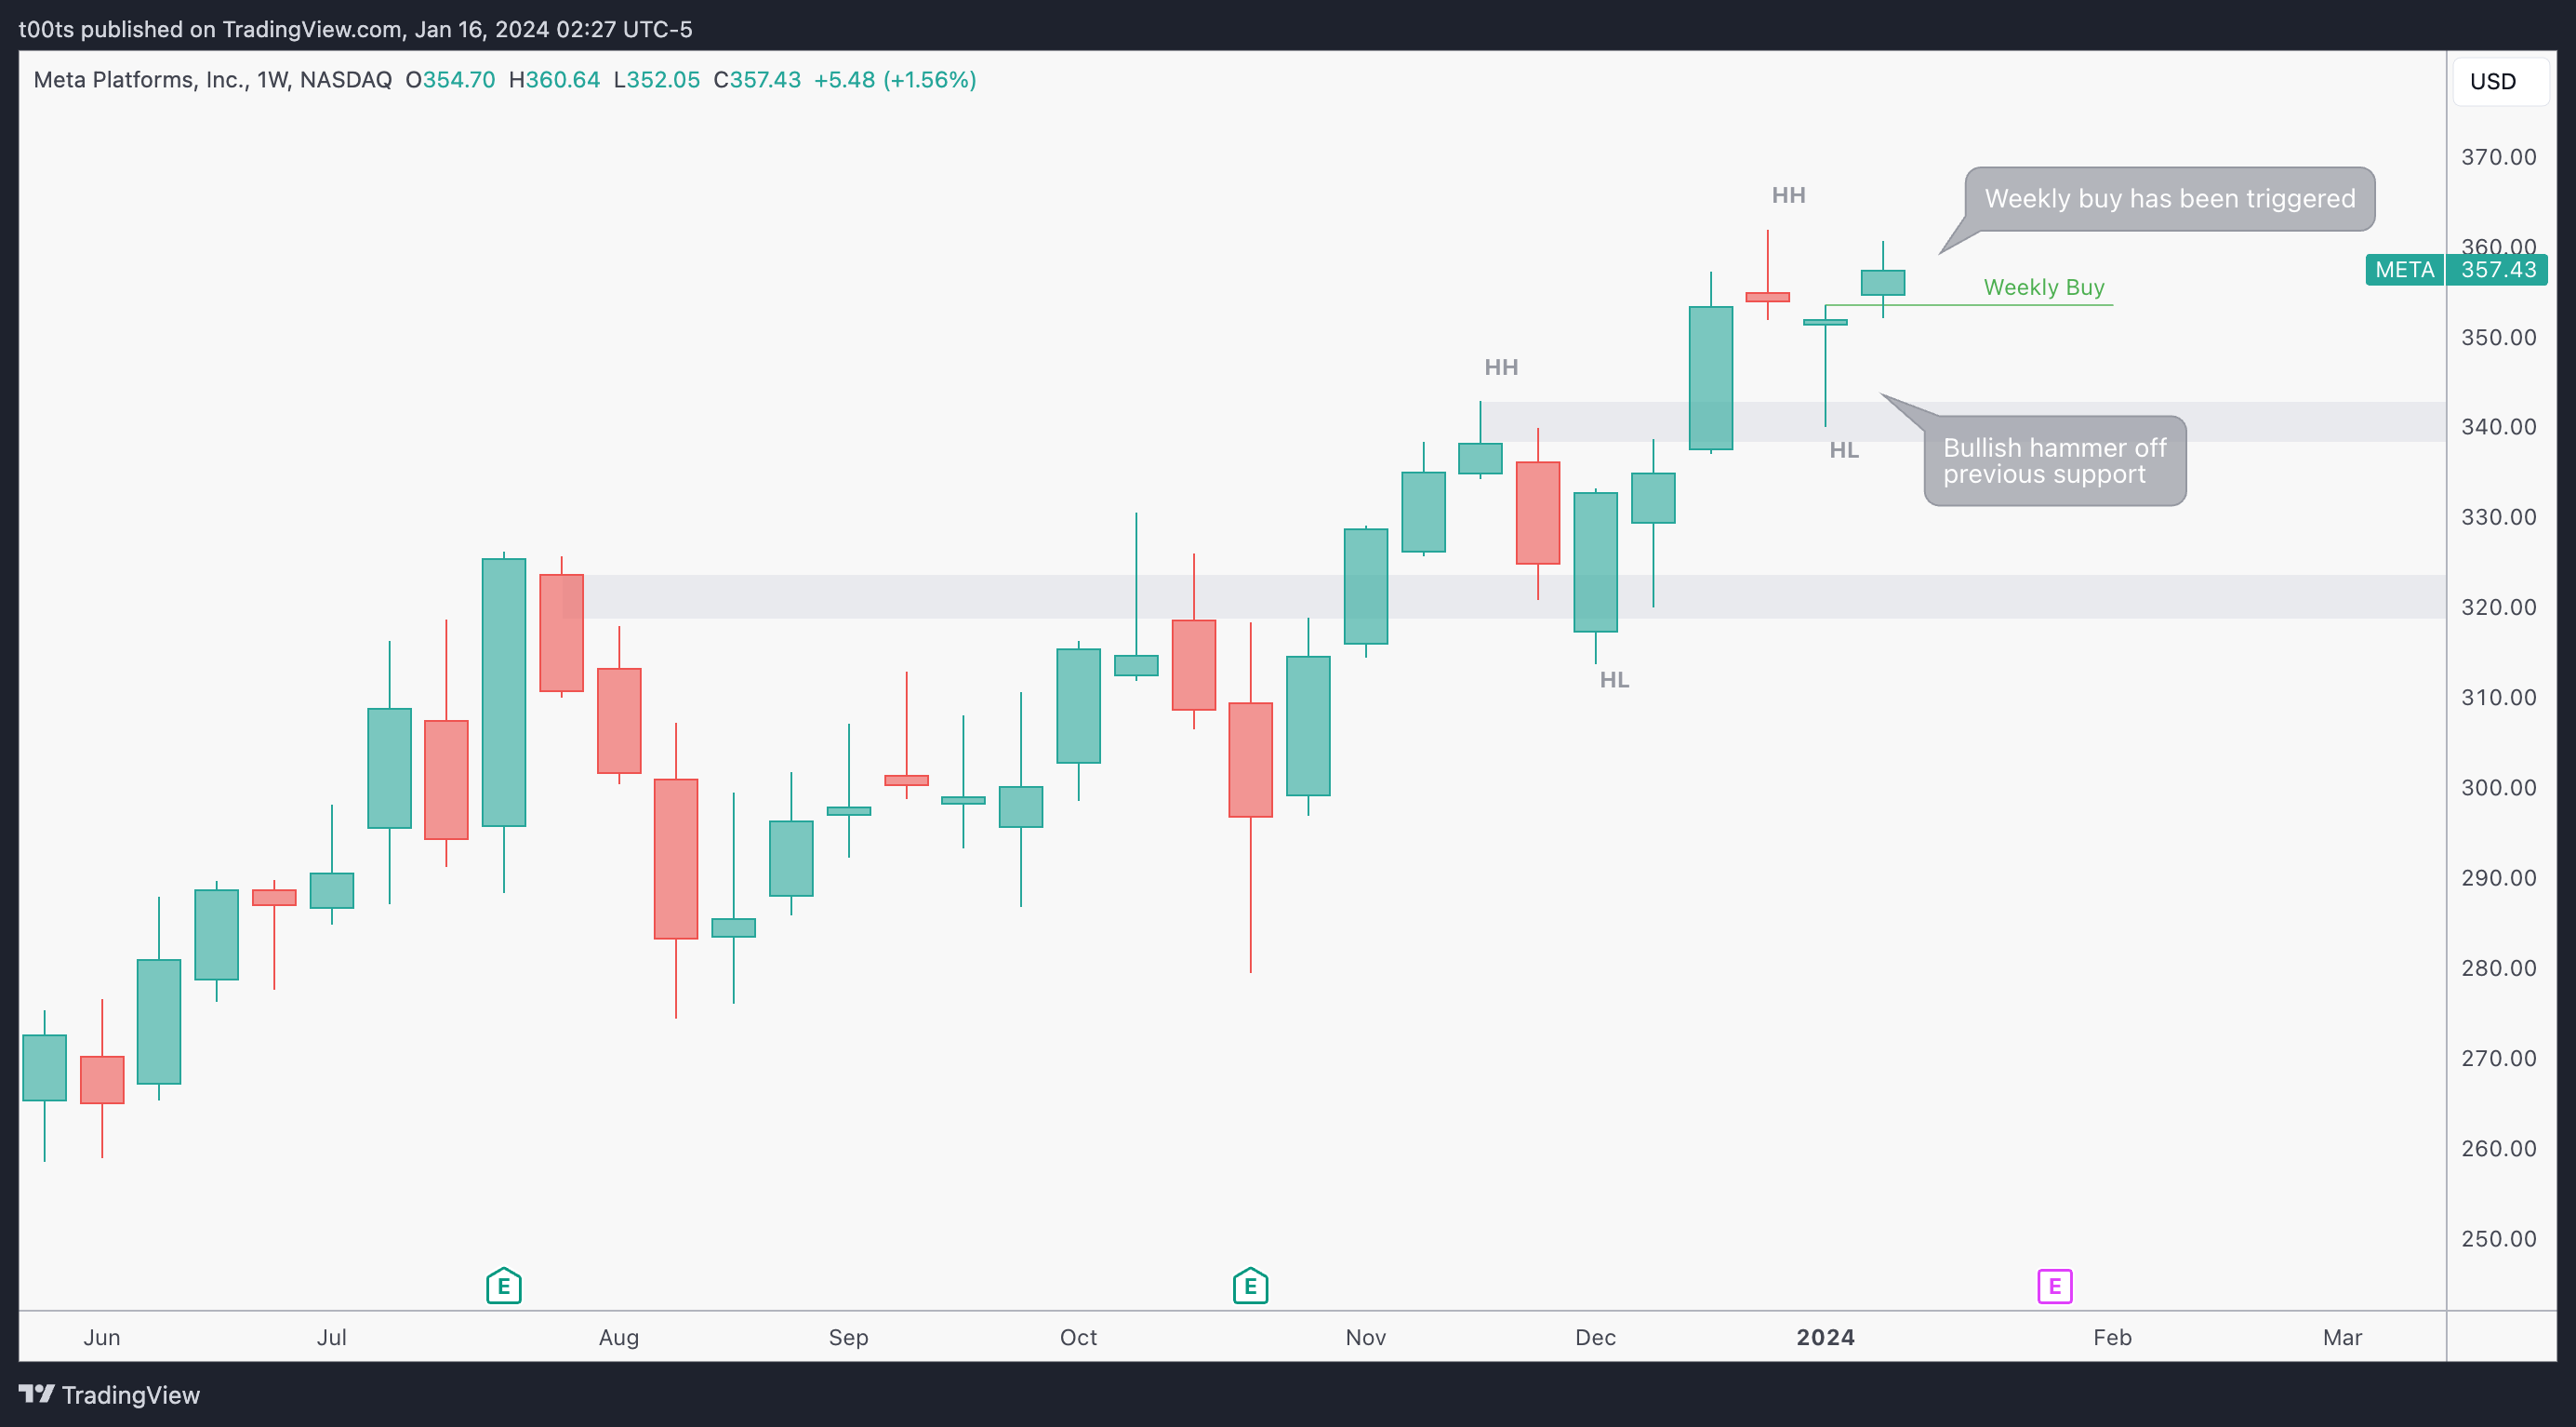
META is very close to its 52 week highs. The uptrend is unquestionable on this name and there's no signs of stopping. We can clearly see higher lows and higher highs being put in, and more recently a very appealing bullish hammer bar bouncing off the retest of a previous breakout level. The classic breakout and retest that every trader learns in their first few days of price action basics. Well, there it is.
To briefly add to that, the weekly buy setup is actually triggered by the current (in progress) weekly bar, which is already trading above the previous bar’s highs.
Daily chart
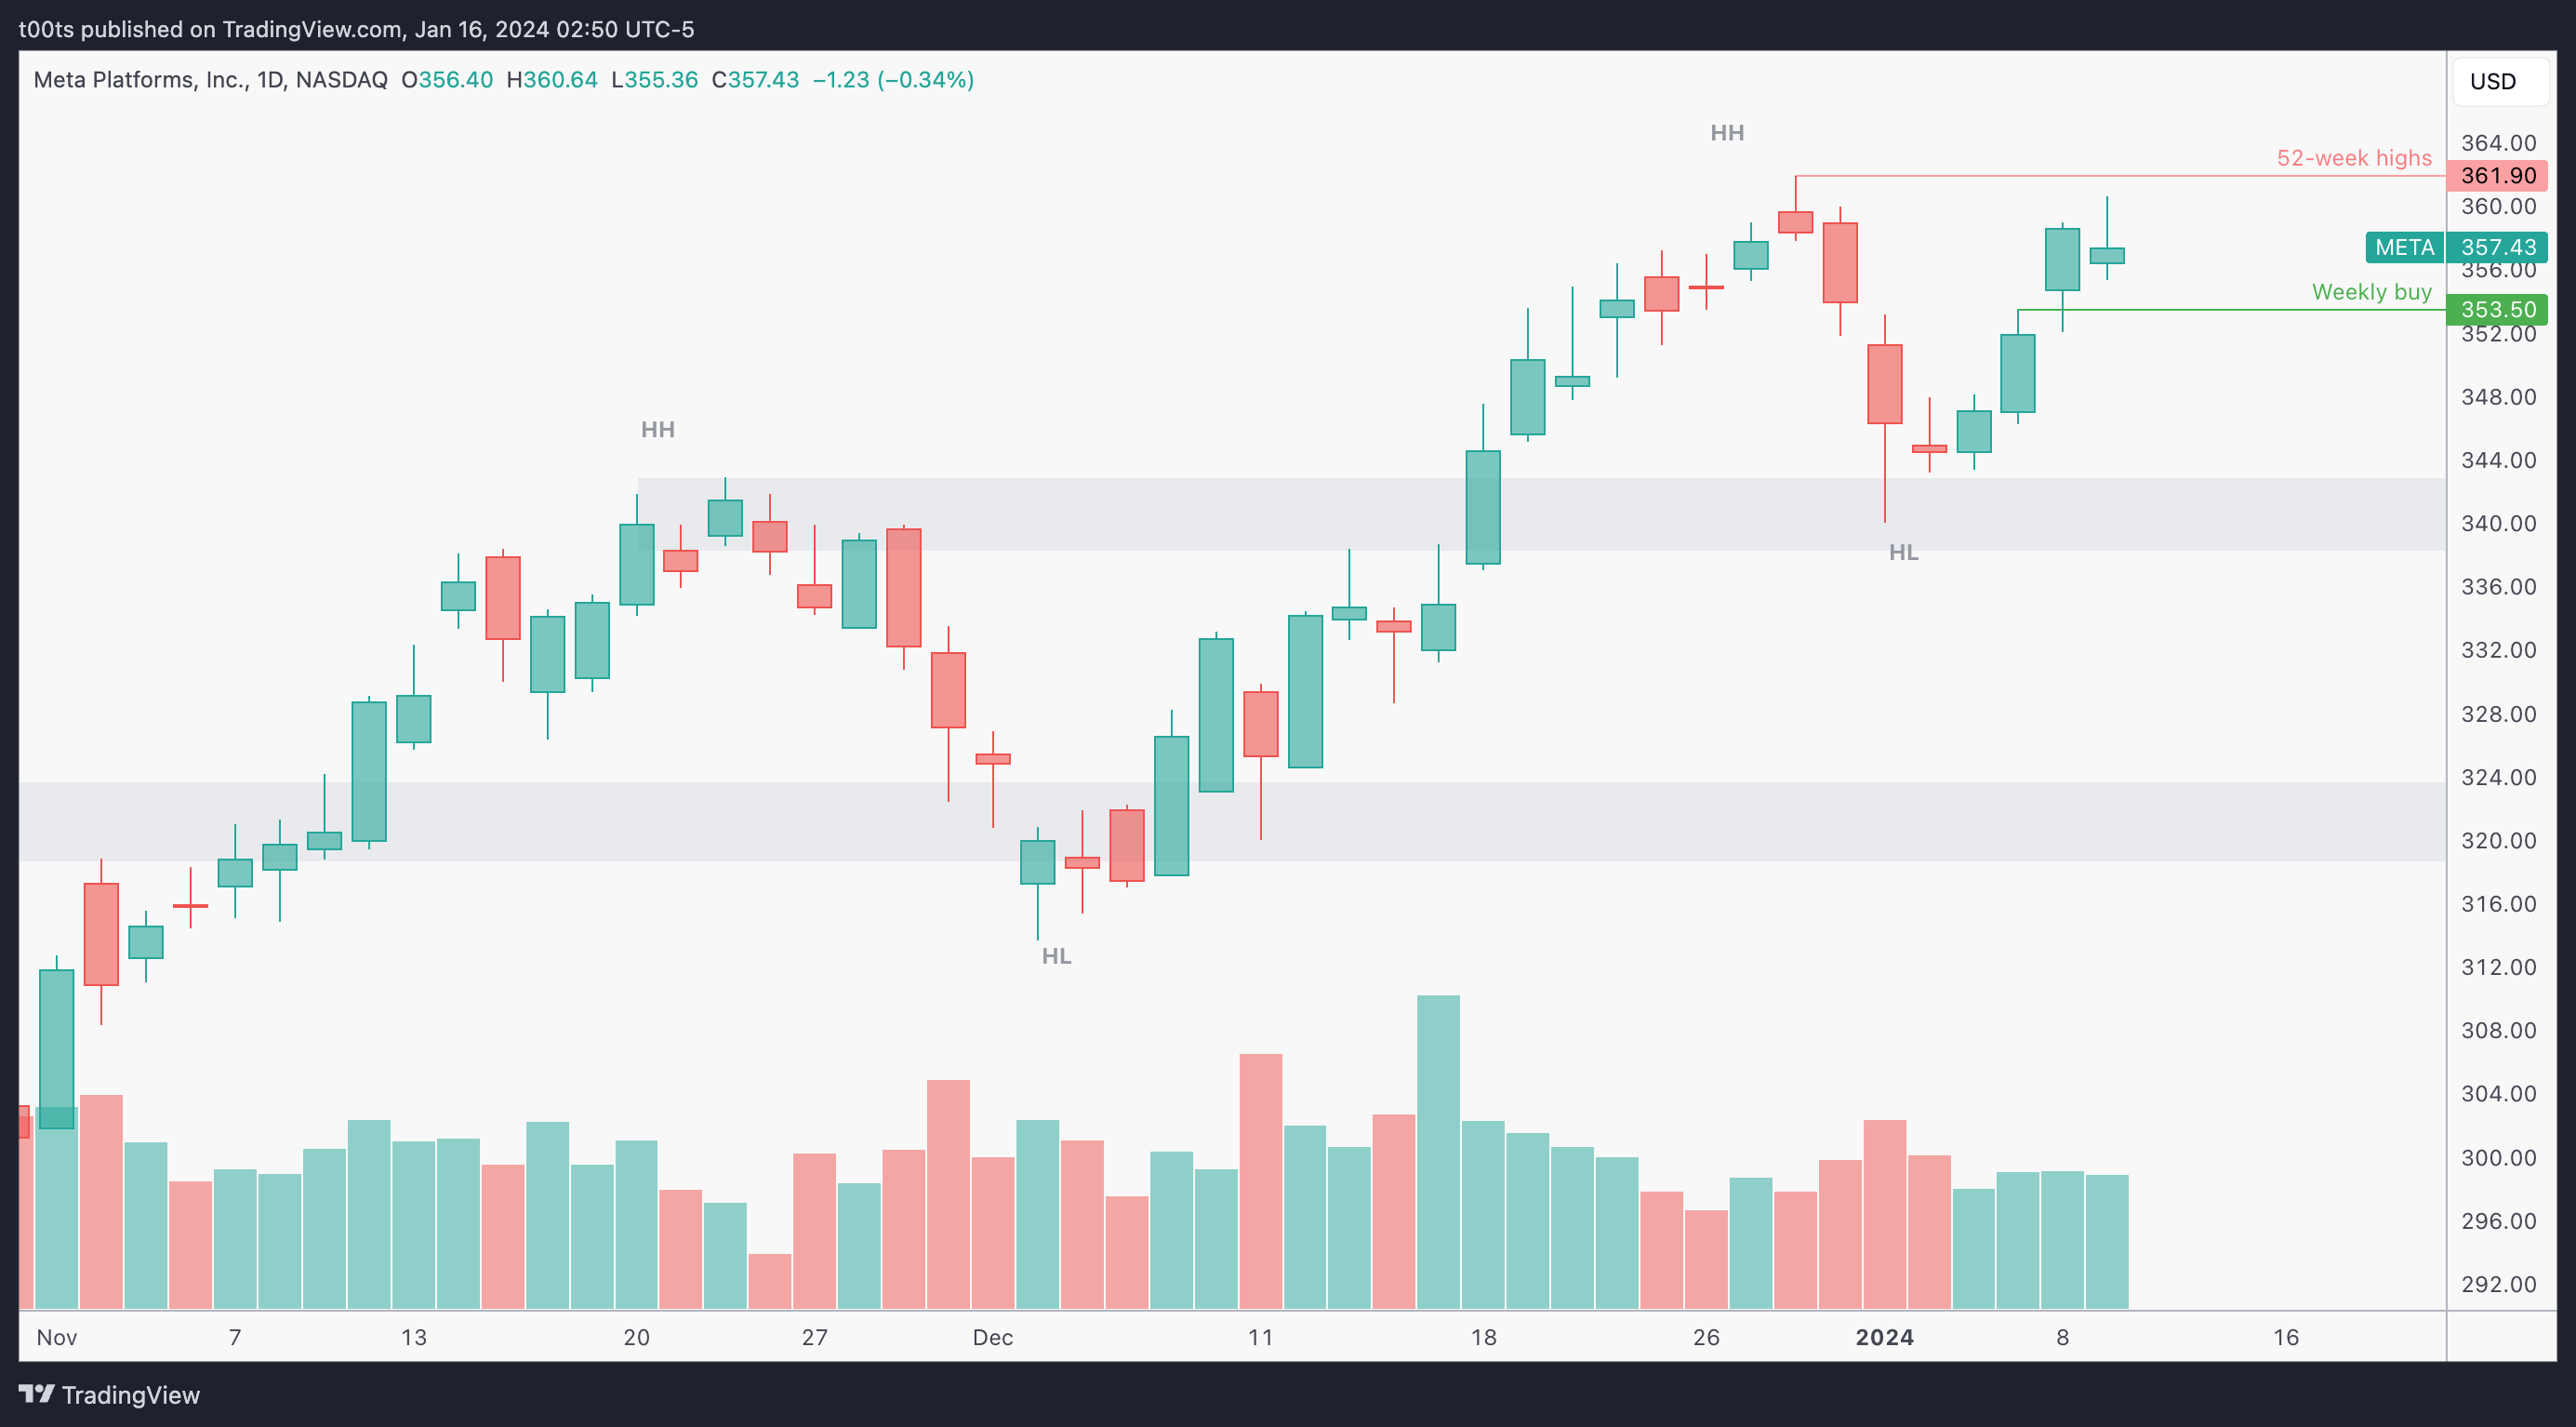
There's really not much to add about this daily chart. The strength is obvious.
However, there is one detail for which there's a fair argument: Yesterday's bar failed to go higher after breaching those previous day's highs.
Is this bearish? Whenever you face a question like this, make a quick list with arguments that justify both sides. In this case, you'll quickly realise there are more arguments to remain bullish than to flip to a bearish bias just because we got a wick above a previous bar high.
For the sake of completeness, here are my reasons to remain bullish:
Weekly uptrend
Daily uptrend
Bar closed green
Bar never traded below prev. day lows
Price barely traded below the opening price on that day
Hourly chart
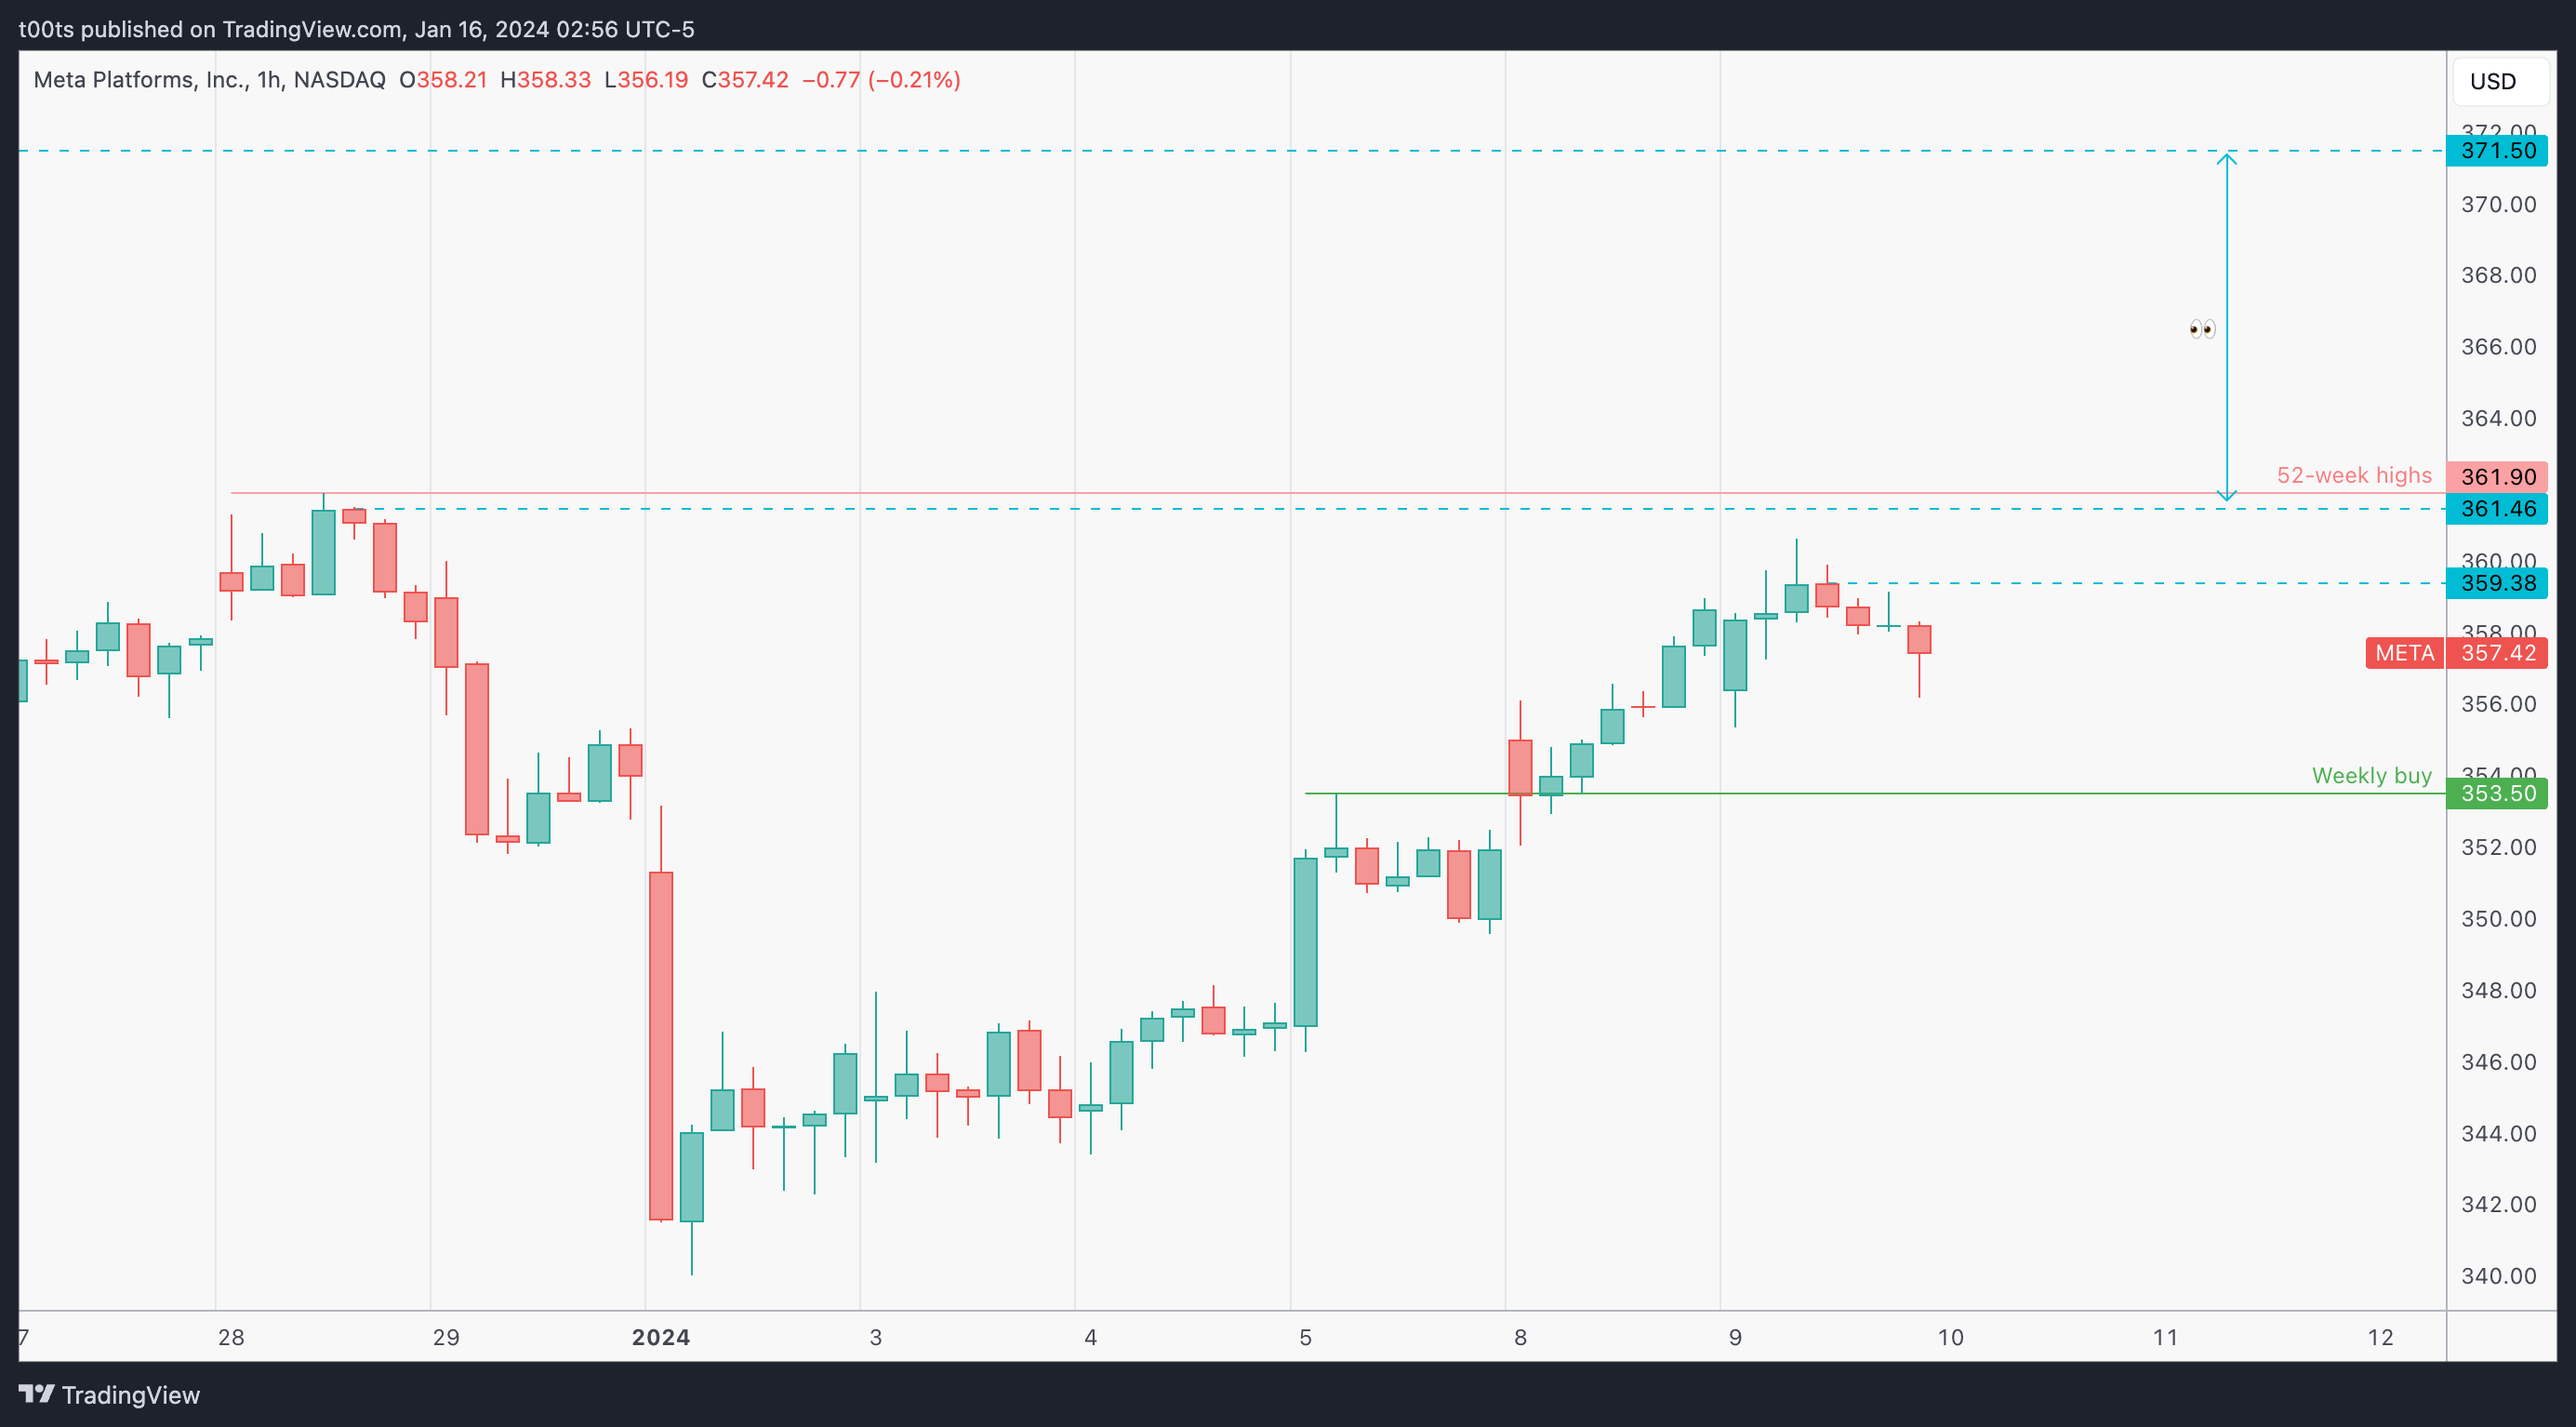
There's a few key things I'd like to note on this chart:
The strong level of $361.46, which caused the last major pullback, is just cents away from the 52-week highs. We should be ready to protect our longs if price rejects there again.
There’s plenty of room above. This is something that I always use to evaluate whether or not to pay attention to any given setup. If an area is crowded with levels I might pass. If I see so much room to move aligning with my directional bias, I'm definitely having that one up.
There's a convenient level at $359.38 that's right below the $360 “round number” psychological level. As traders we're always looking for confluences. Just as with the first point -those two levels made the resistance potentially stronger- this confluence reinforces the idea of a potential support if price is trading above.
Pre-market action
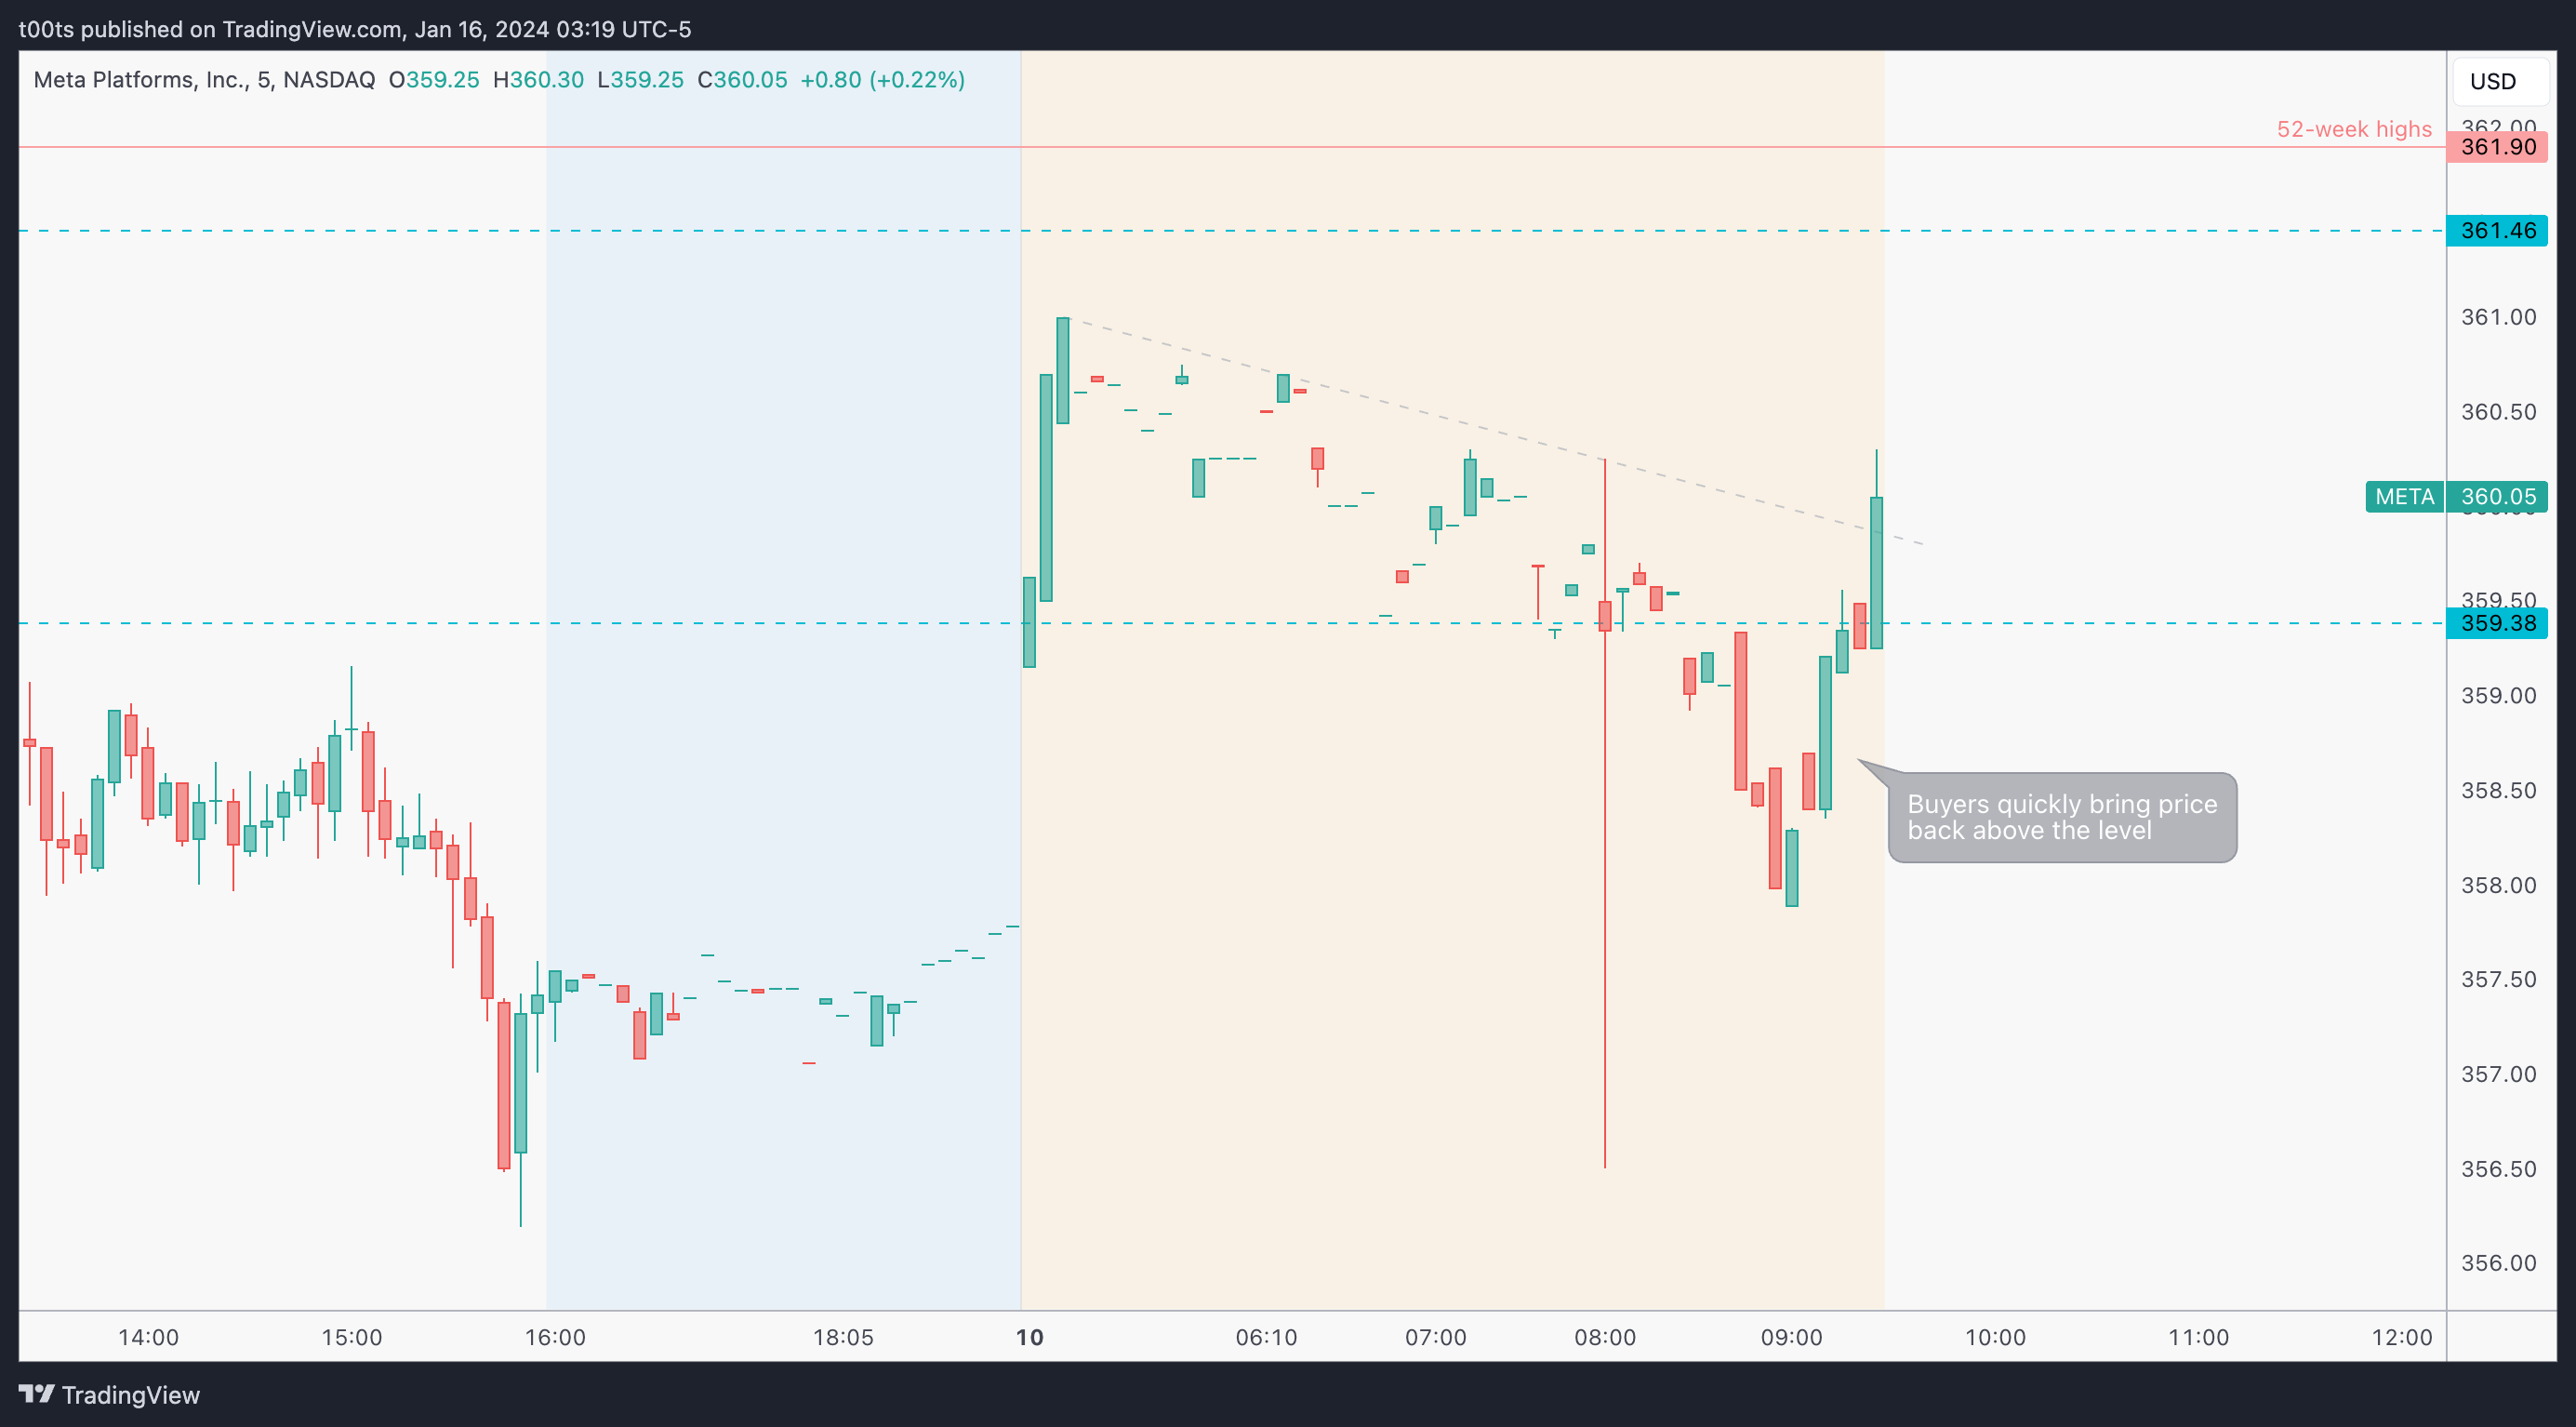
Honestly, there's not much to go over on this pre-market chart. Stock is set to open with a slight gap up but nothing notable. The only thing that's worth commenting on is how quickly buyers rushed to bring price back up the moment it lost that $359.38 level from yesterday. While that is certainly a good sign and denotes buyers are still very interesting in bidding this name up, it doesn't really give us any actionable insights in my opinion.
The trade
Using our CPT Framework:
Cue(s)
Stock near 52-week highs
Strong weekly uptrend
Bullish weekly hammer off support with a triggered buy setup
There's some sellers from yesterday who'd be in pain if stock pushed
Pre-market buyers immediately took over the moment a level was broken to the downside
Intraday cue: Strong rejection at the 52-week highs right off the open lacks follow-through (see 2m chart)
Plan
Scenario 1: In an ideal world, we'd like to participate in any buying opportunity off a bounce of the $359.38 level. However, we do have the $360 psych. level right around where we're set to open. So might as well wait for a dip and buy the $360 reclaim if it ever happens. If the stock rejects the $360 there's no trade unless price gets back above it.
Scenario 2: If price breaches and closes above the $361.46 level, find a momentum entry to jump in risking against the level itself.
On both bullish scenarios, our target is the upper $371.50 level we saw on the hourly chart.
Trigger
For the first scenario, we want price trading above $360. For the second scenario, we'll need an aggressive entry as close as possible to the the $359.38 level.
5m chart
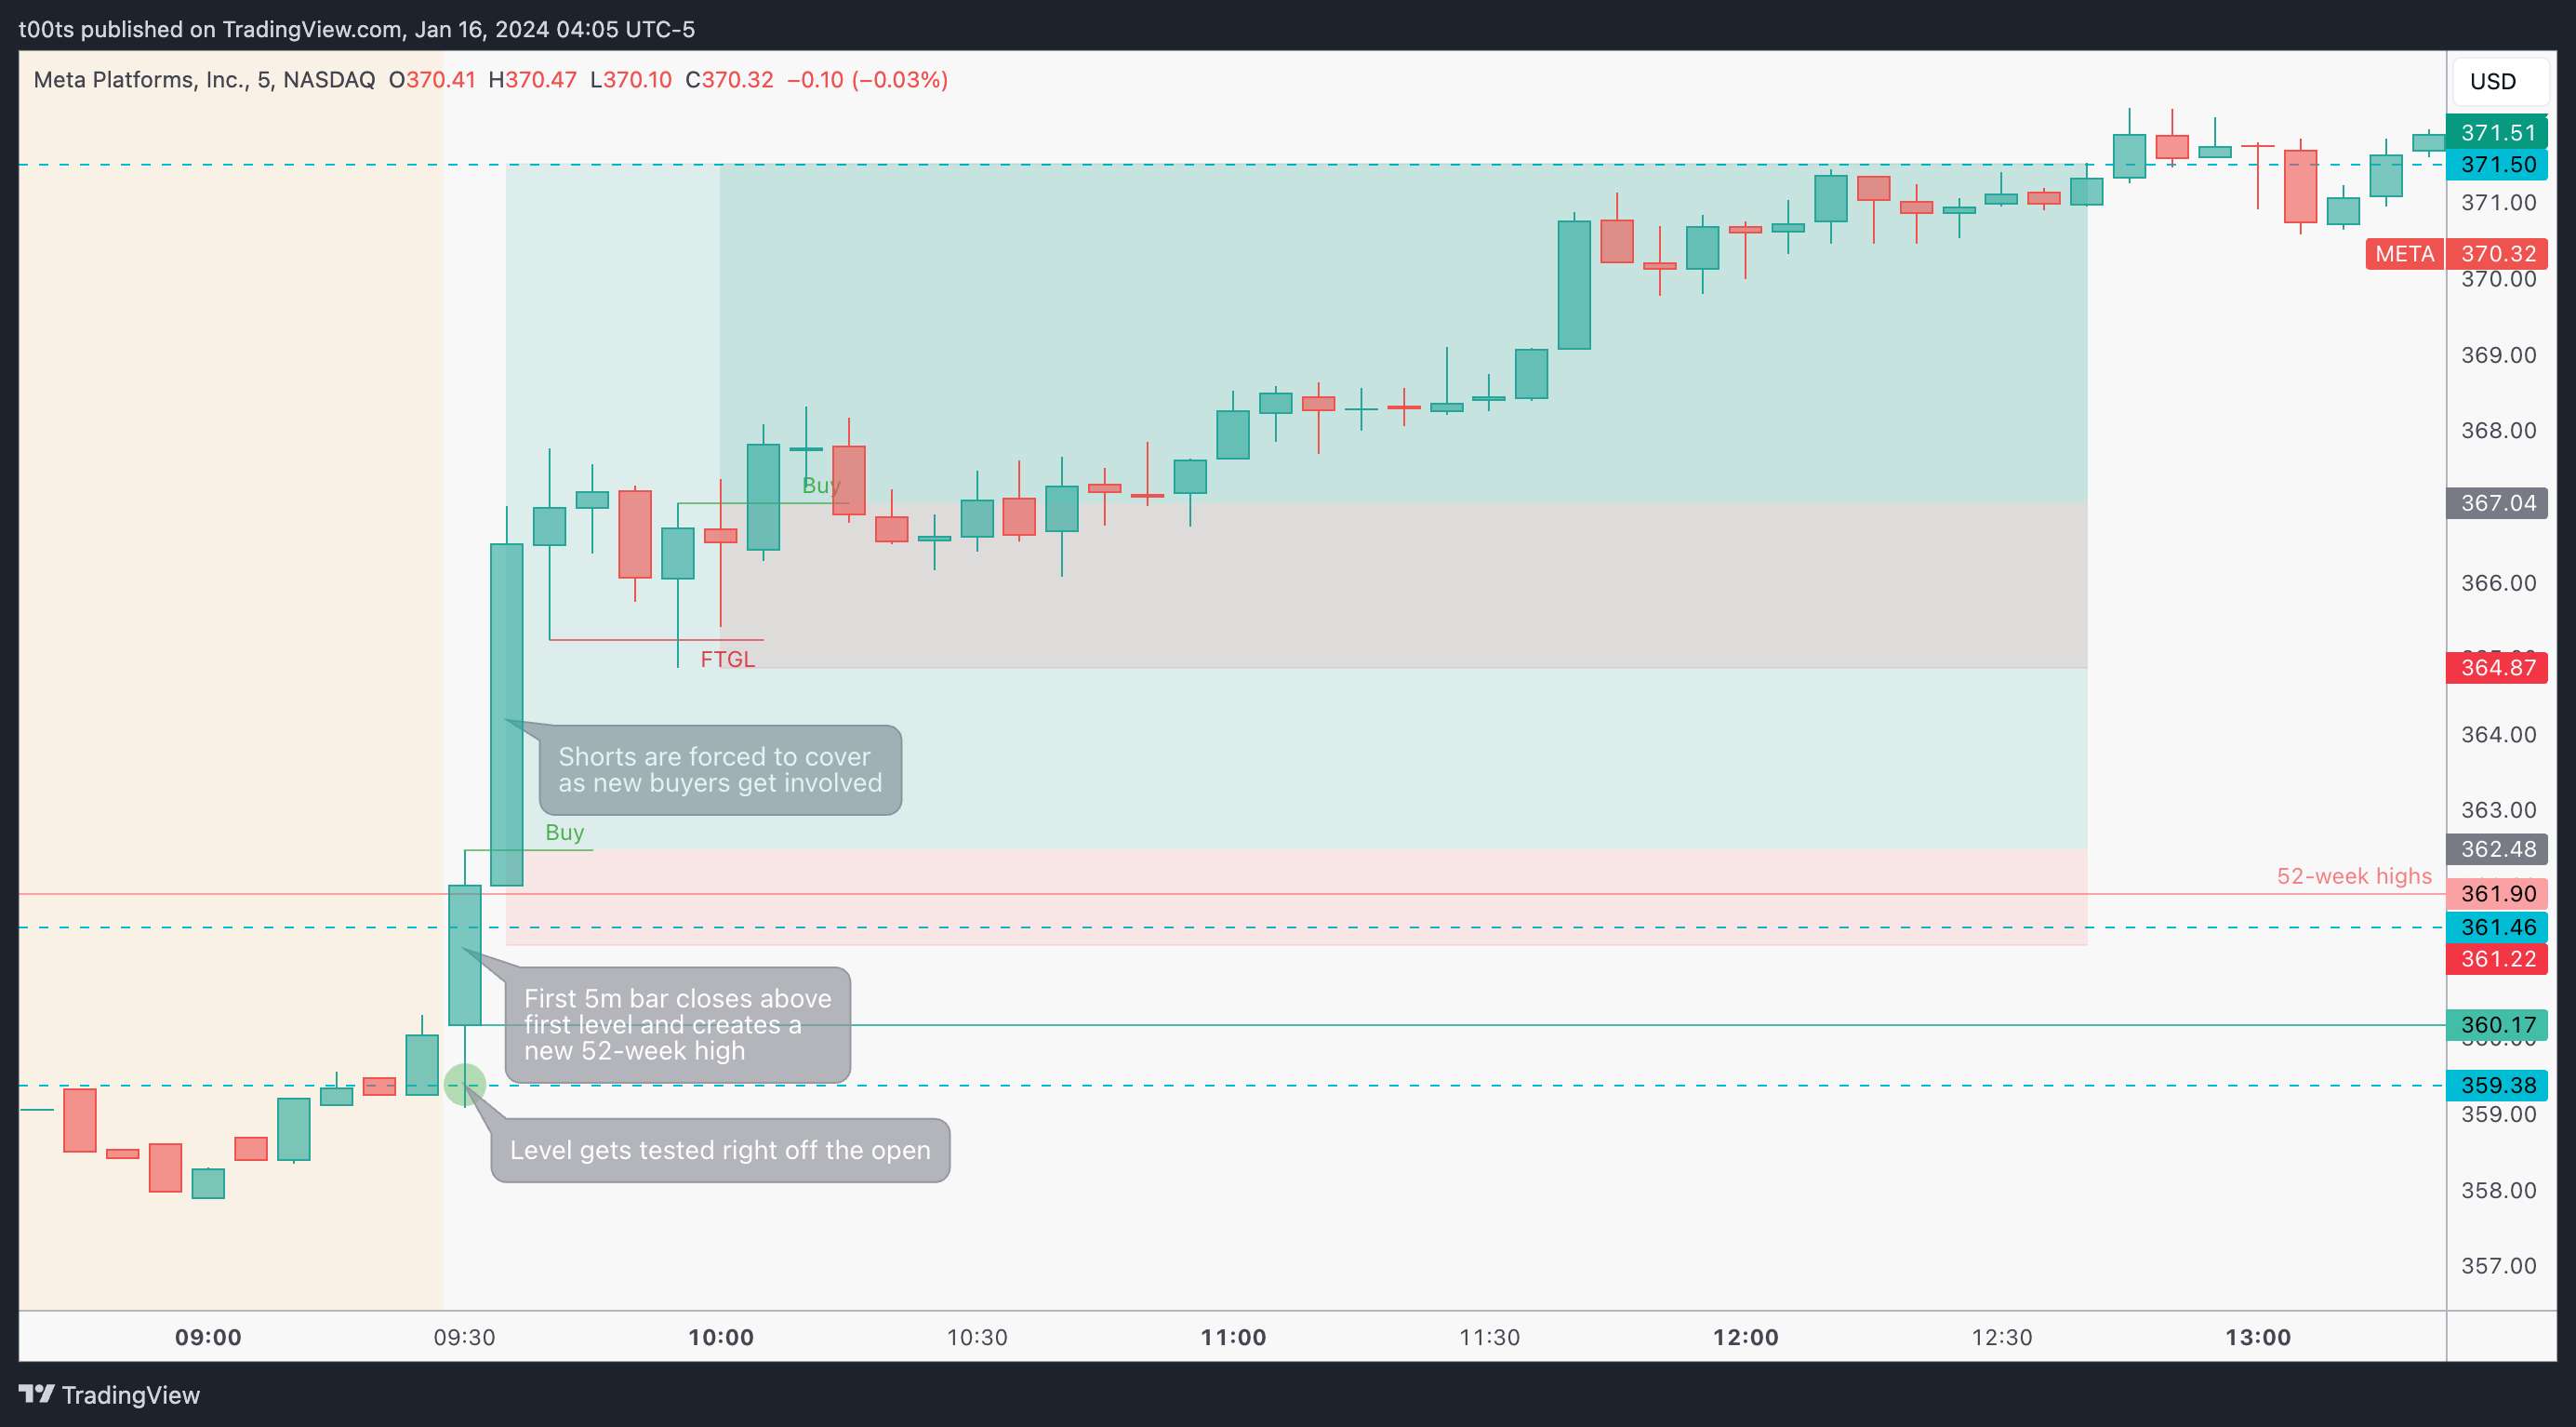
Things played out fast. Real fast. When we're looking for opening drive plays, or any sort of involvement around the open, we always use the 2m chart. But, for the sake of our review, let's go over the 5m chart first.
The first thing we notice is that price does indeed dip below the $360 mark and touch our $359.38 level. We outlined in the plan how we were looking for an entry off this level. But the action is so strong that, if we're strictly trading off this 5m chart, we have no other option but to use this first bar as signal bar and enter as soon as price trades above it's highs, using $361.46, the first level below it's close to set our risk. This still offers a solid +7R trade that, despite being slow, is pretty much stress-free.
The moment price breaches those 52-week highs, short sellers are forced to cover, pushing price even higher on strong momentum. You had no other choice here but to get involved and ride that momentum. If you waited for a pullback, you would've been a buyer on that second buy setup I outlined on a failure to go lower for a slow and frustrating +2R trade (but of course you don’t know at that time).
2m chart
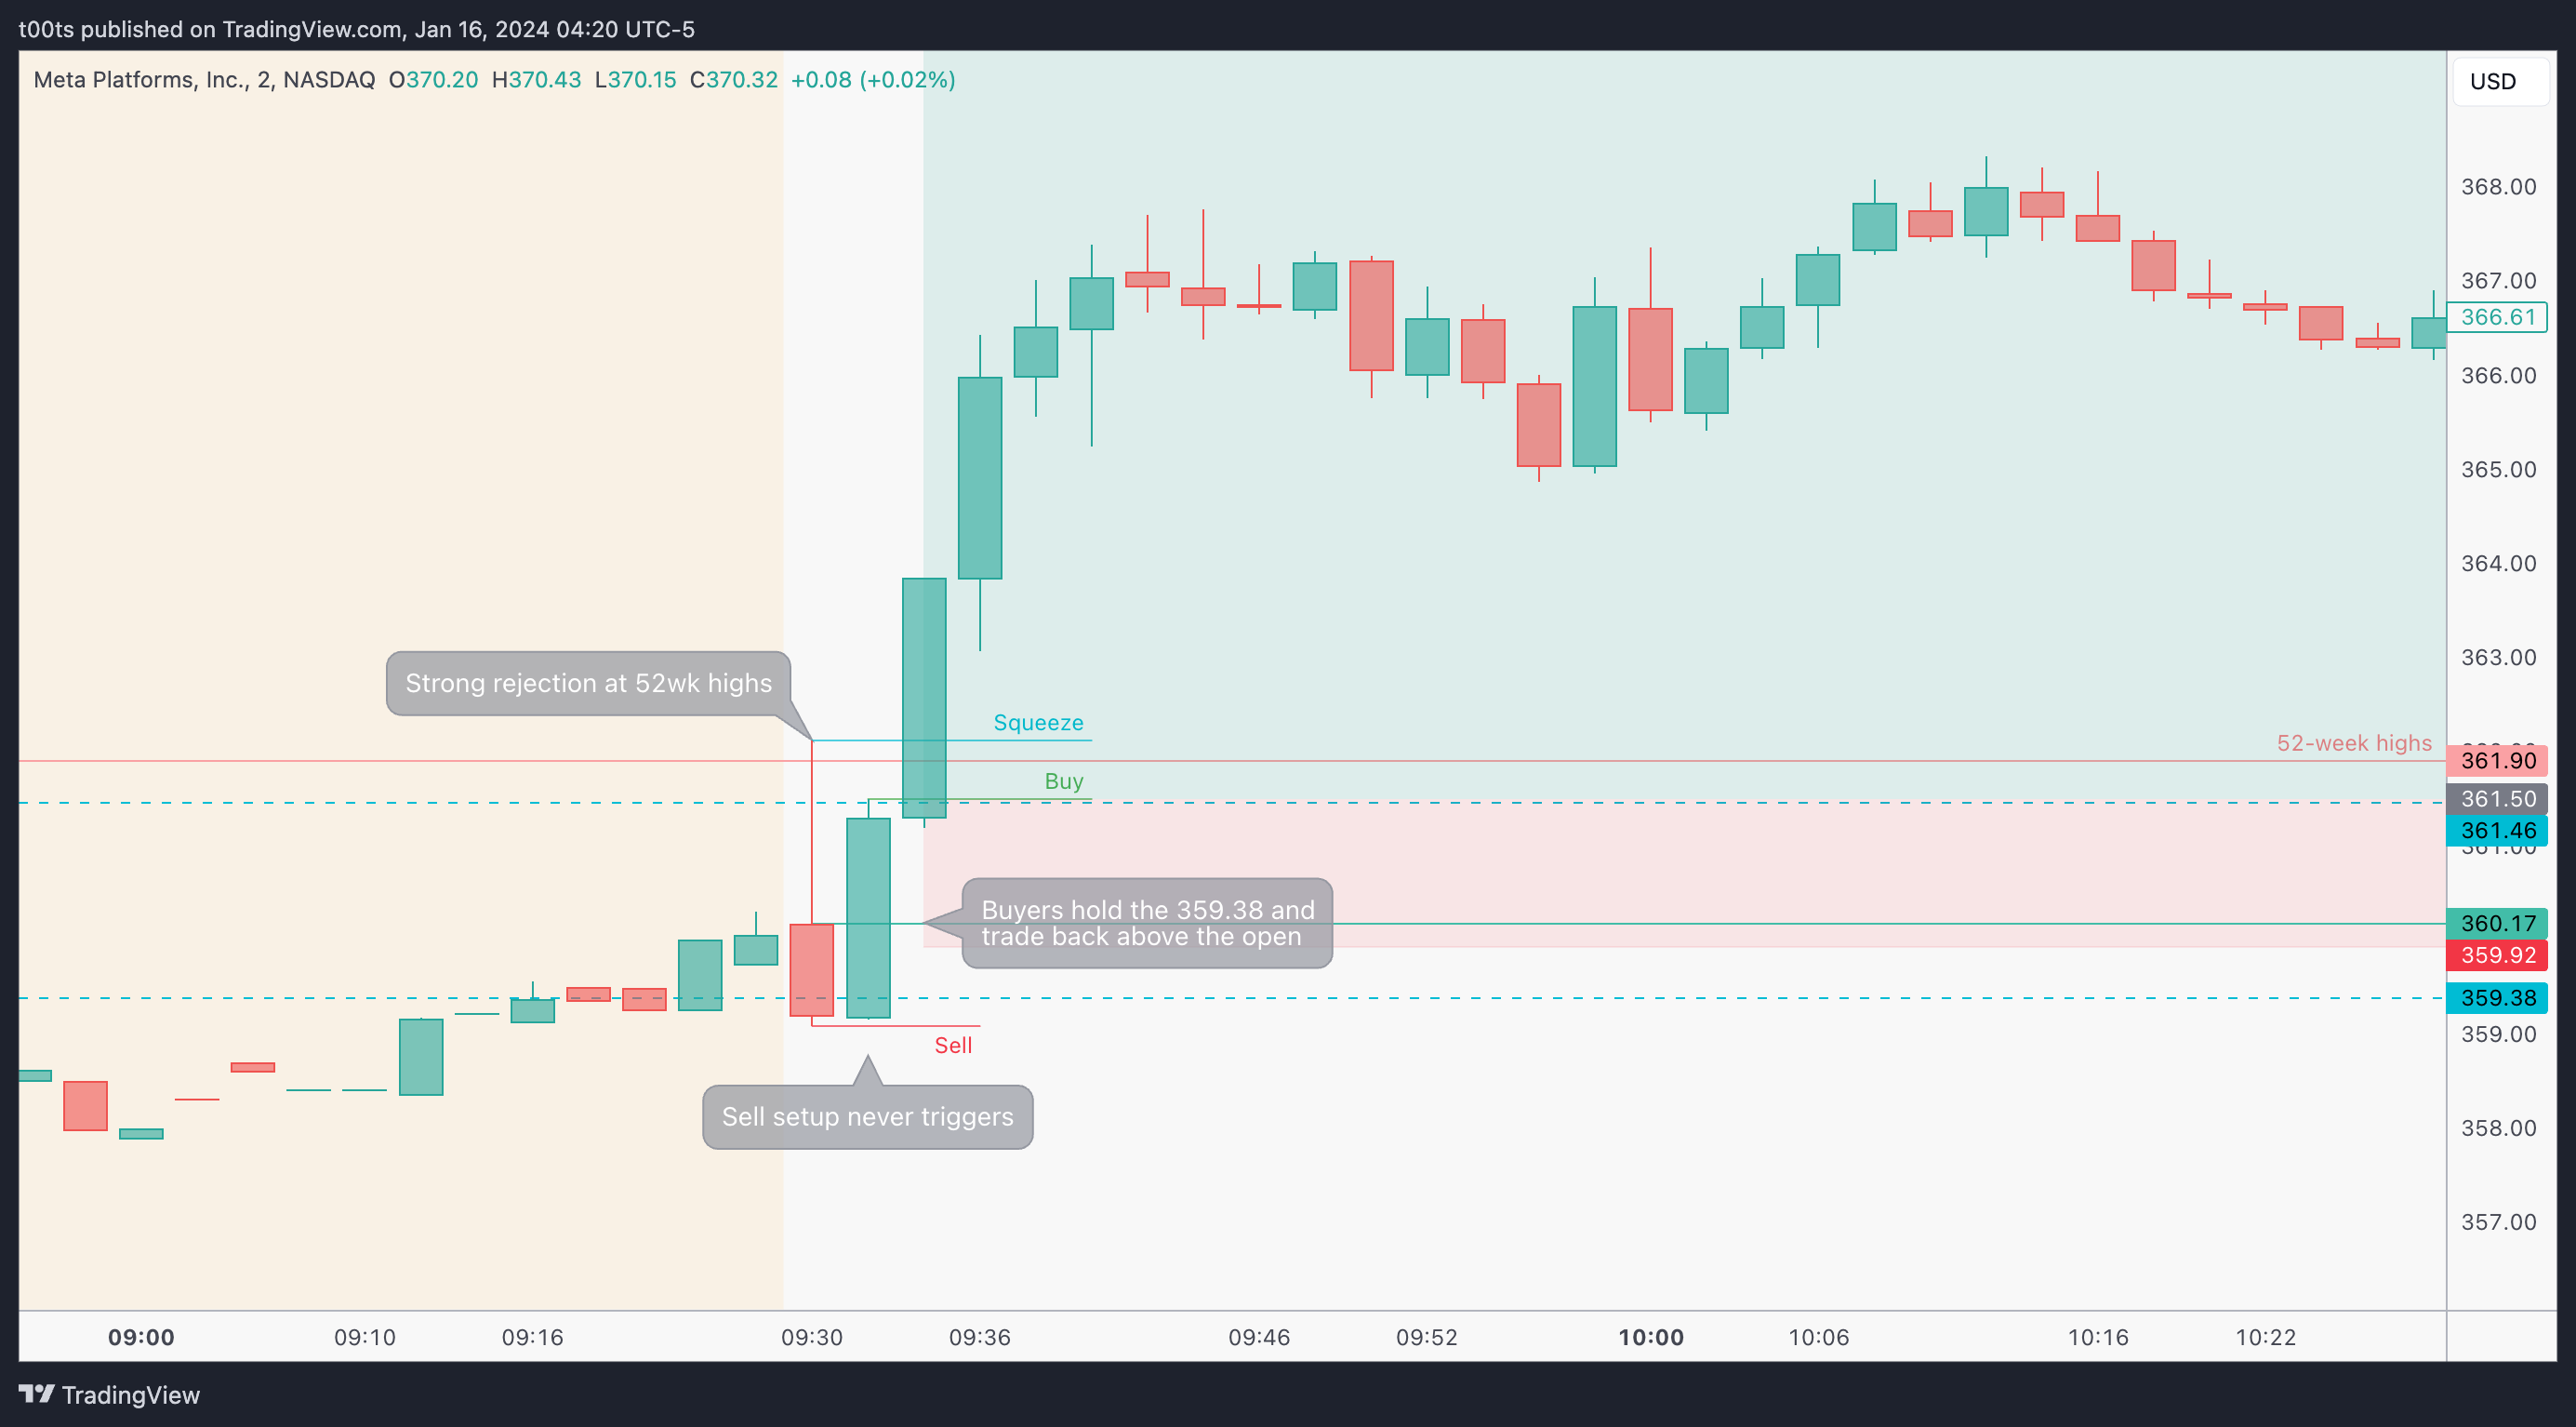
Now let's zoom into the open and let's go over exactly what happened in those first few minutes.
First thing we saw in real-time was the strong rejection of those 52 week highs we've been talking about. Sellers were ready to push her down and they did. That first 2m bar closed below our $359.38 level. For anyone who was short biased, price trading one tick below those lows was a short trigger with a nearby level to risk off of. But price never gave that trigger.
Buyers quickly picked up and got price back above the opening print. This second 2m trend bar closes a few ticks below our next level. Right now, most of the shorts who piled in on those first 2m are -at least- concerned. We know that the moment price makes new highs they'll be forced to cover at a loss. At this current point in time, we have a mix between scenarios 1 and 2. We have a buy setup off the $359.38 level (sort of), and we're about to break the $361.46 which we can use to risk off of.
We're essentially getting the best of both scenarios. We have confirmation that buyers are still there and our lower level held, and we have our next level so close to our entry trigger that we can use it to risk off of, offering us much tighter risk.
To be fair, I placed the stop below the opening print which would not be uncommon and still offers a great risk to reward opportunity.
Closing notes
Honestly, I have been missing out on a lot of good plays on this name due to an underlying bias issue I have -which I can't seem to fix- where I can't get my head around this unstoppable run. I find myself struggling to understand and justify why I'd long something that's up 300% in such a short timespan. I can't see what has changed so much for the company to triple its value and still keep pushing. I barely use (nor like) any of their products, so I guess that may cause part of the issue.
Don't get me wrong, I'm not a lunatic trying to short this on every pop, not at all. But still, I have real trouble taking longs on META. I bring this up to point out how the existence of underlying biases not only poses risks in terms of potential losses, but also in opportunity cost of overlooking lucrative trading opportunities which may not align with your preconceived opinions.
I am posting one trade writeup every day throughout 2024. I focus on large caps using levels and price action. The subscription is absolutely free and will always be. I will strive to provide value by offering clues and ideas for you to enhance your edge. Let’s grow together!