

Higher timeframe context
Google is one of those high-beta names that hasn't been performing as well as its peers. It's not getting that much attention lately and seems to react slower to the overall mood swings we've seen in tech.
Investors may be slightly concerned about the whole rise of LLM's and how late Google came into the party. Looks like the demo of Gemini -their newest multimodal LLM- was staged. Regardless, the stock has shown resilience so far.
Weekly chart
Google is in its second attempt to break out of a huge area of resistance. This area has shown clear rejections in at least 8-10 occasions throughout the past few months. Although I only trade off hourly levels, if you notice something like this, it is always -always- wise to plot it on your chart as reference.

Daily chart
The daily chart shows a clear ascending wedge. After a leg up from the bottom lower support, price is currently sitting at the top of this wedge and has failed to go higher twice. You know the drill by now: Anytime we're attempting a counter-trend trade we always wait for a second entry.
To be honest, there was nothing really setting up yesterday. This is the only play that stood out after scanning my whole watchlist. (I usually find something in the main focus list)

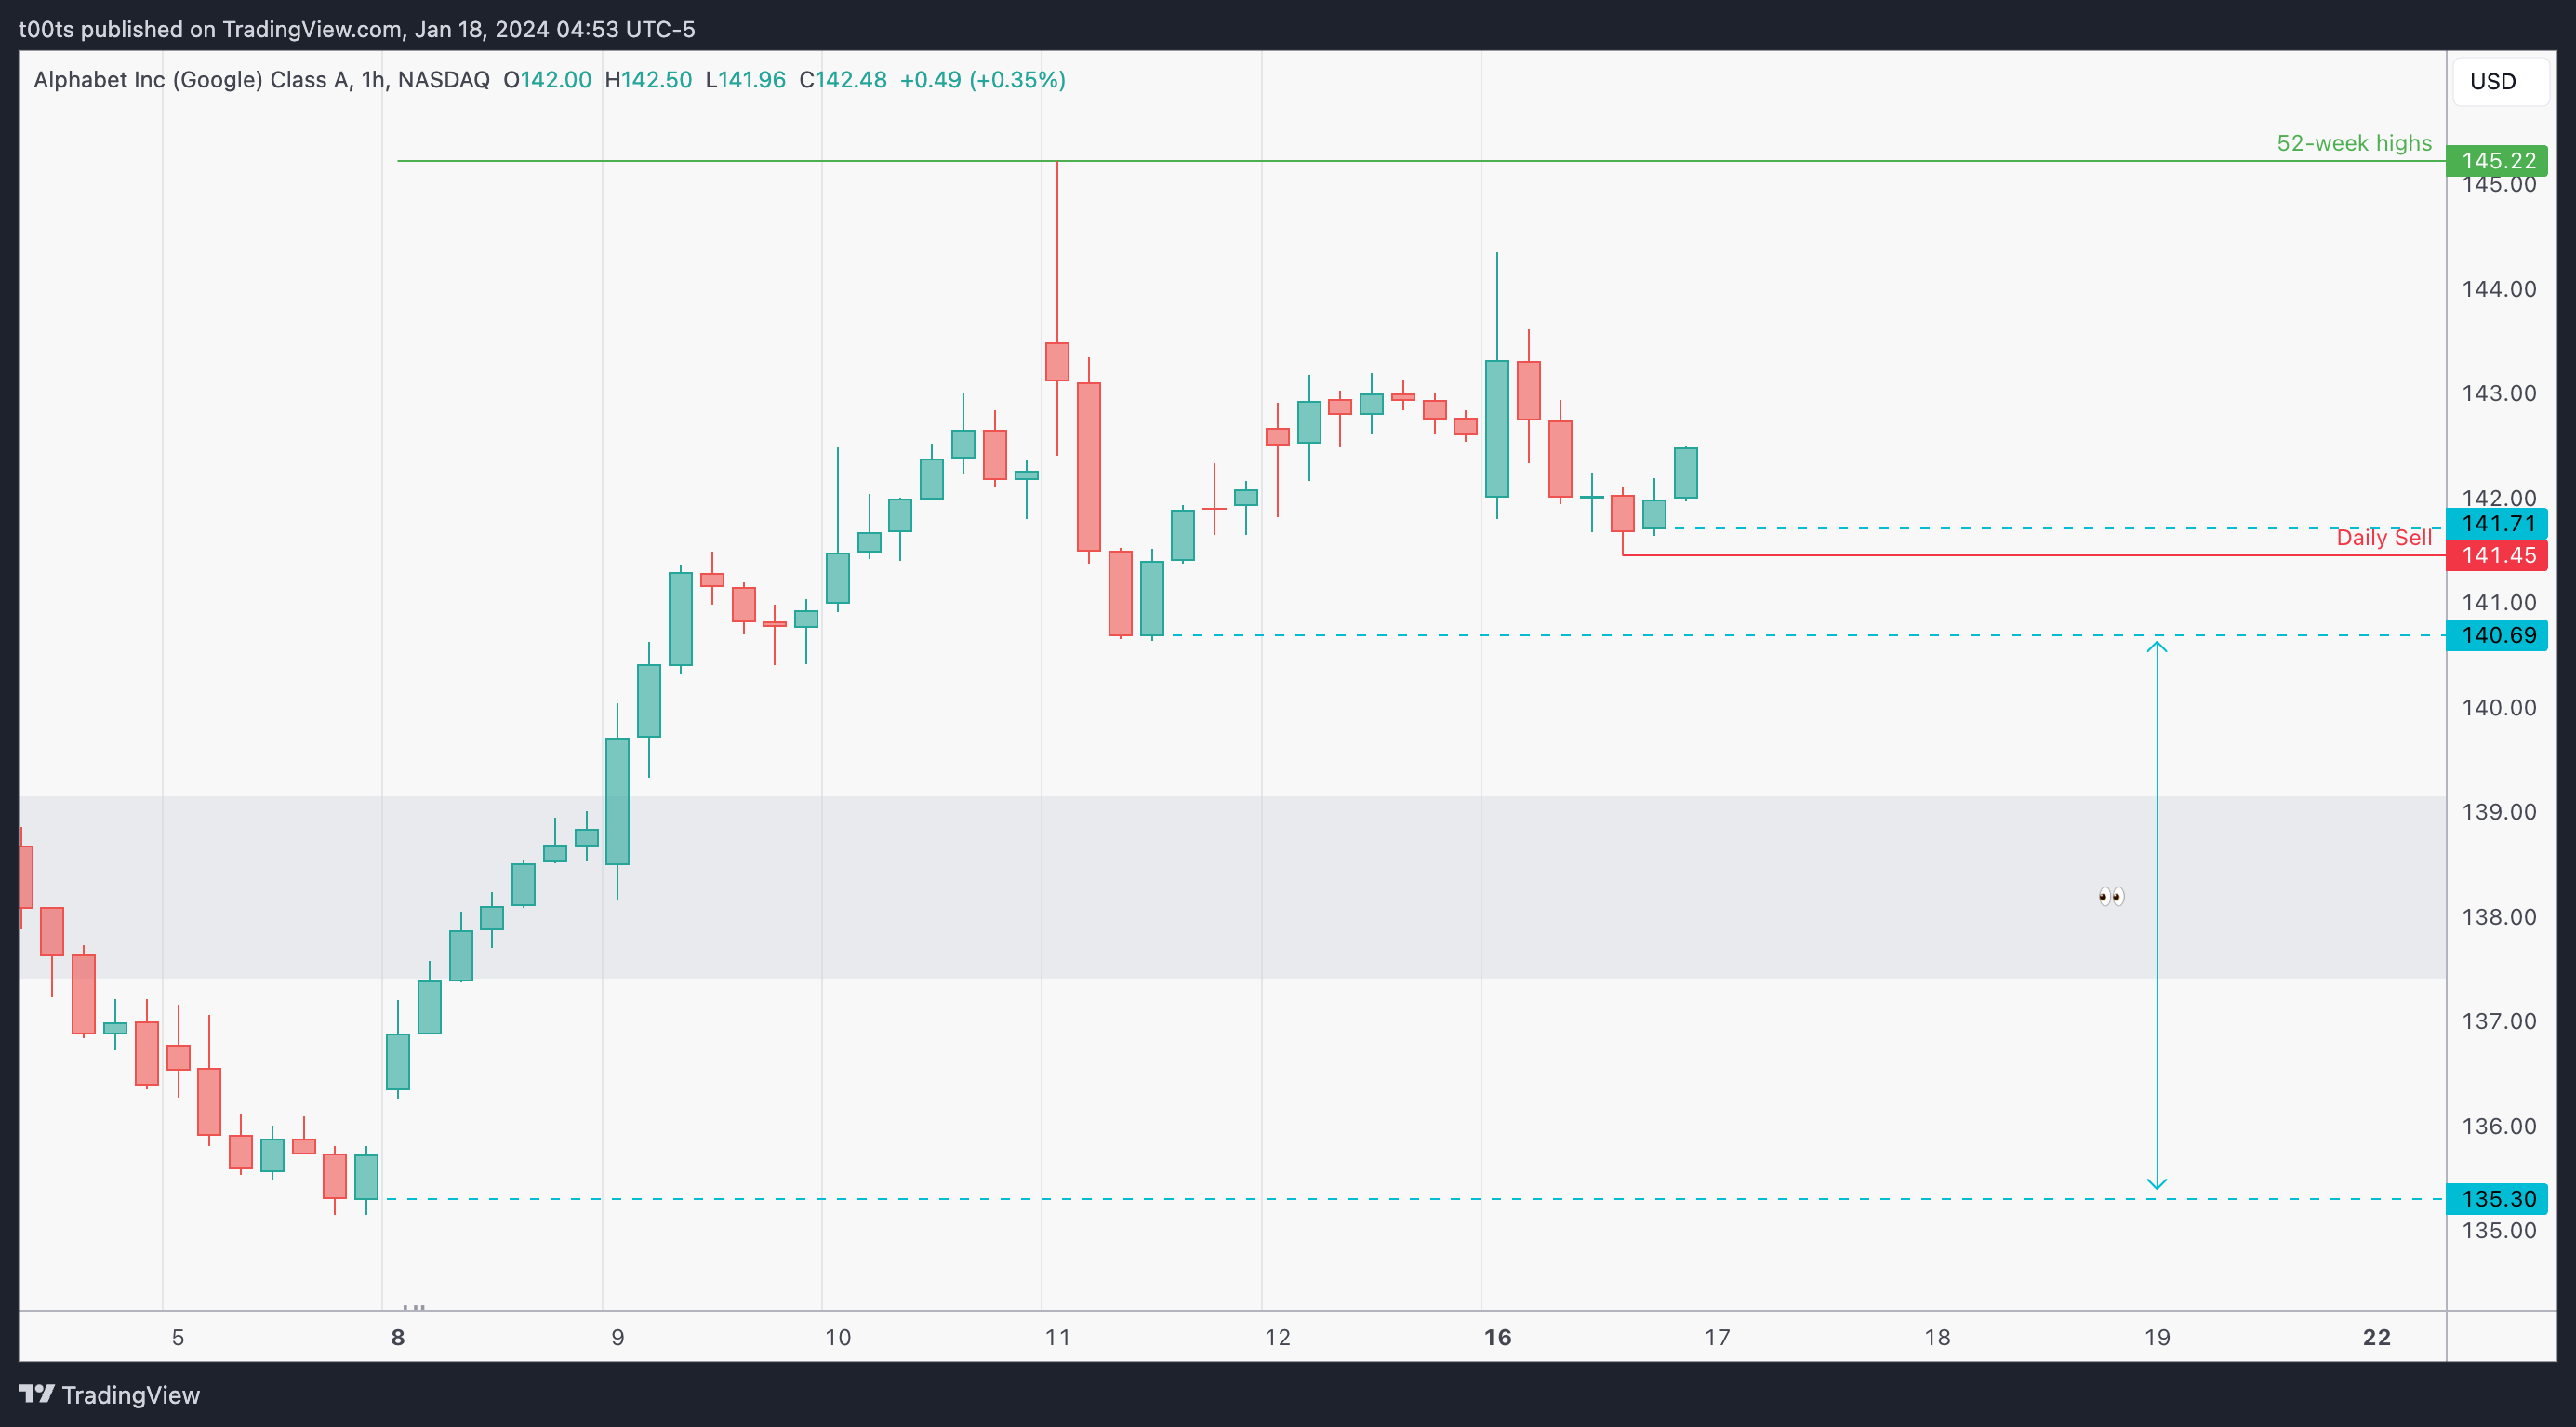
Hourly chart
While there are no levels between the 140s and the 135s, we still have that weekly S/R area marked, which I again strongly suggest you always have when it's that obvious. There's not much going on this hourly chart. The whole focus for this trade is in the daily chart I'd say. The daily sell trigger is marked in red. Notice, however, that there's a level conveniently right above it, which we can use for shorts...
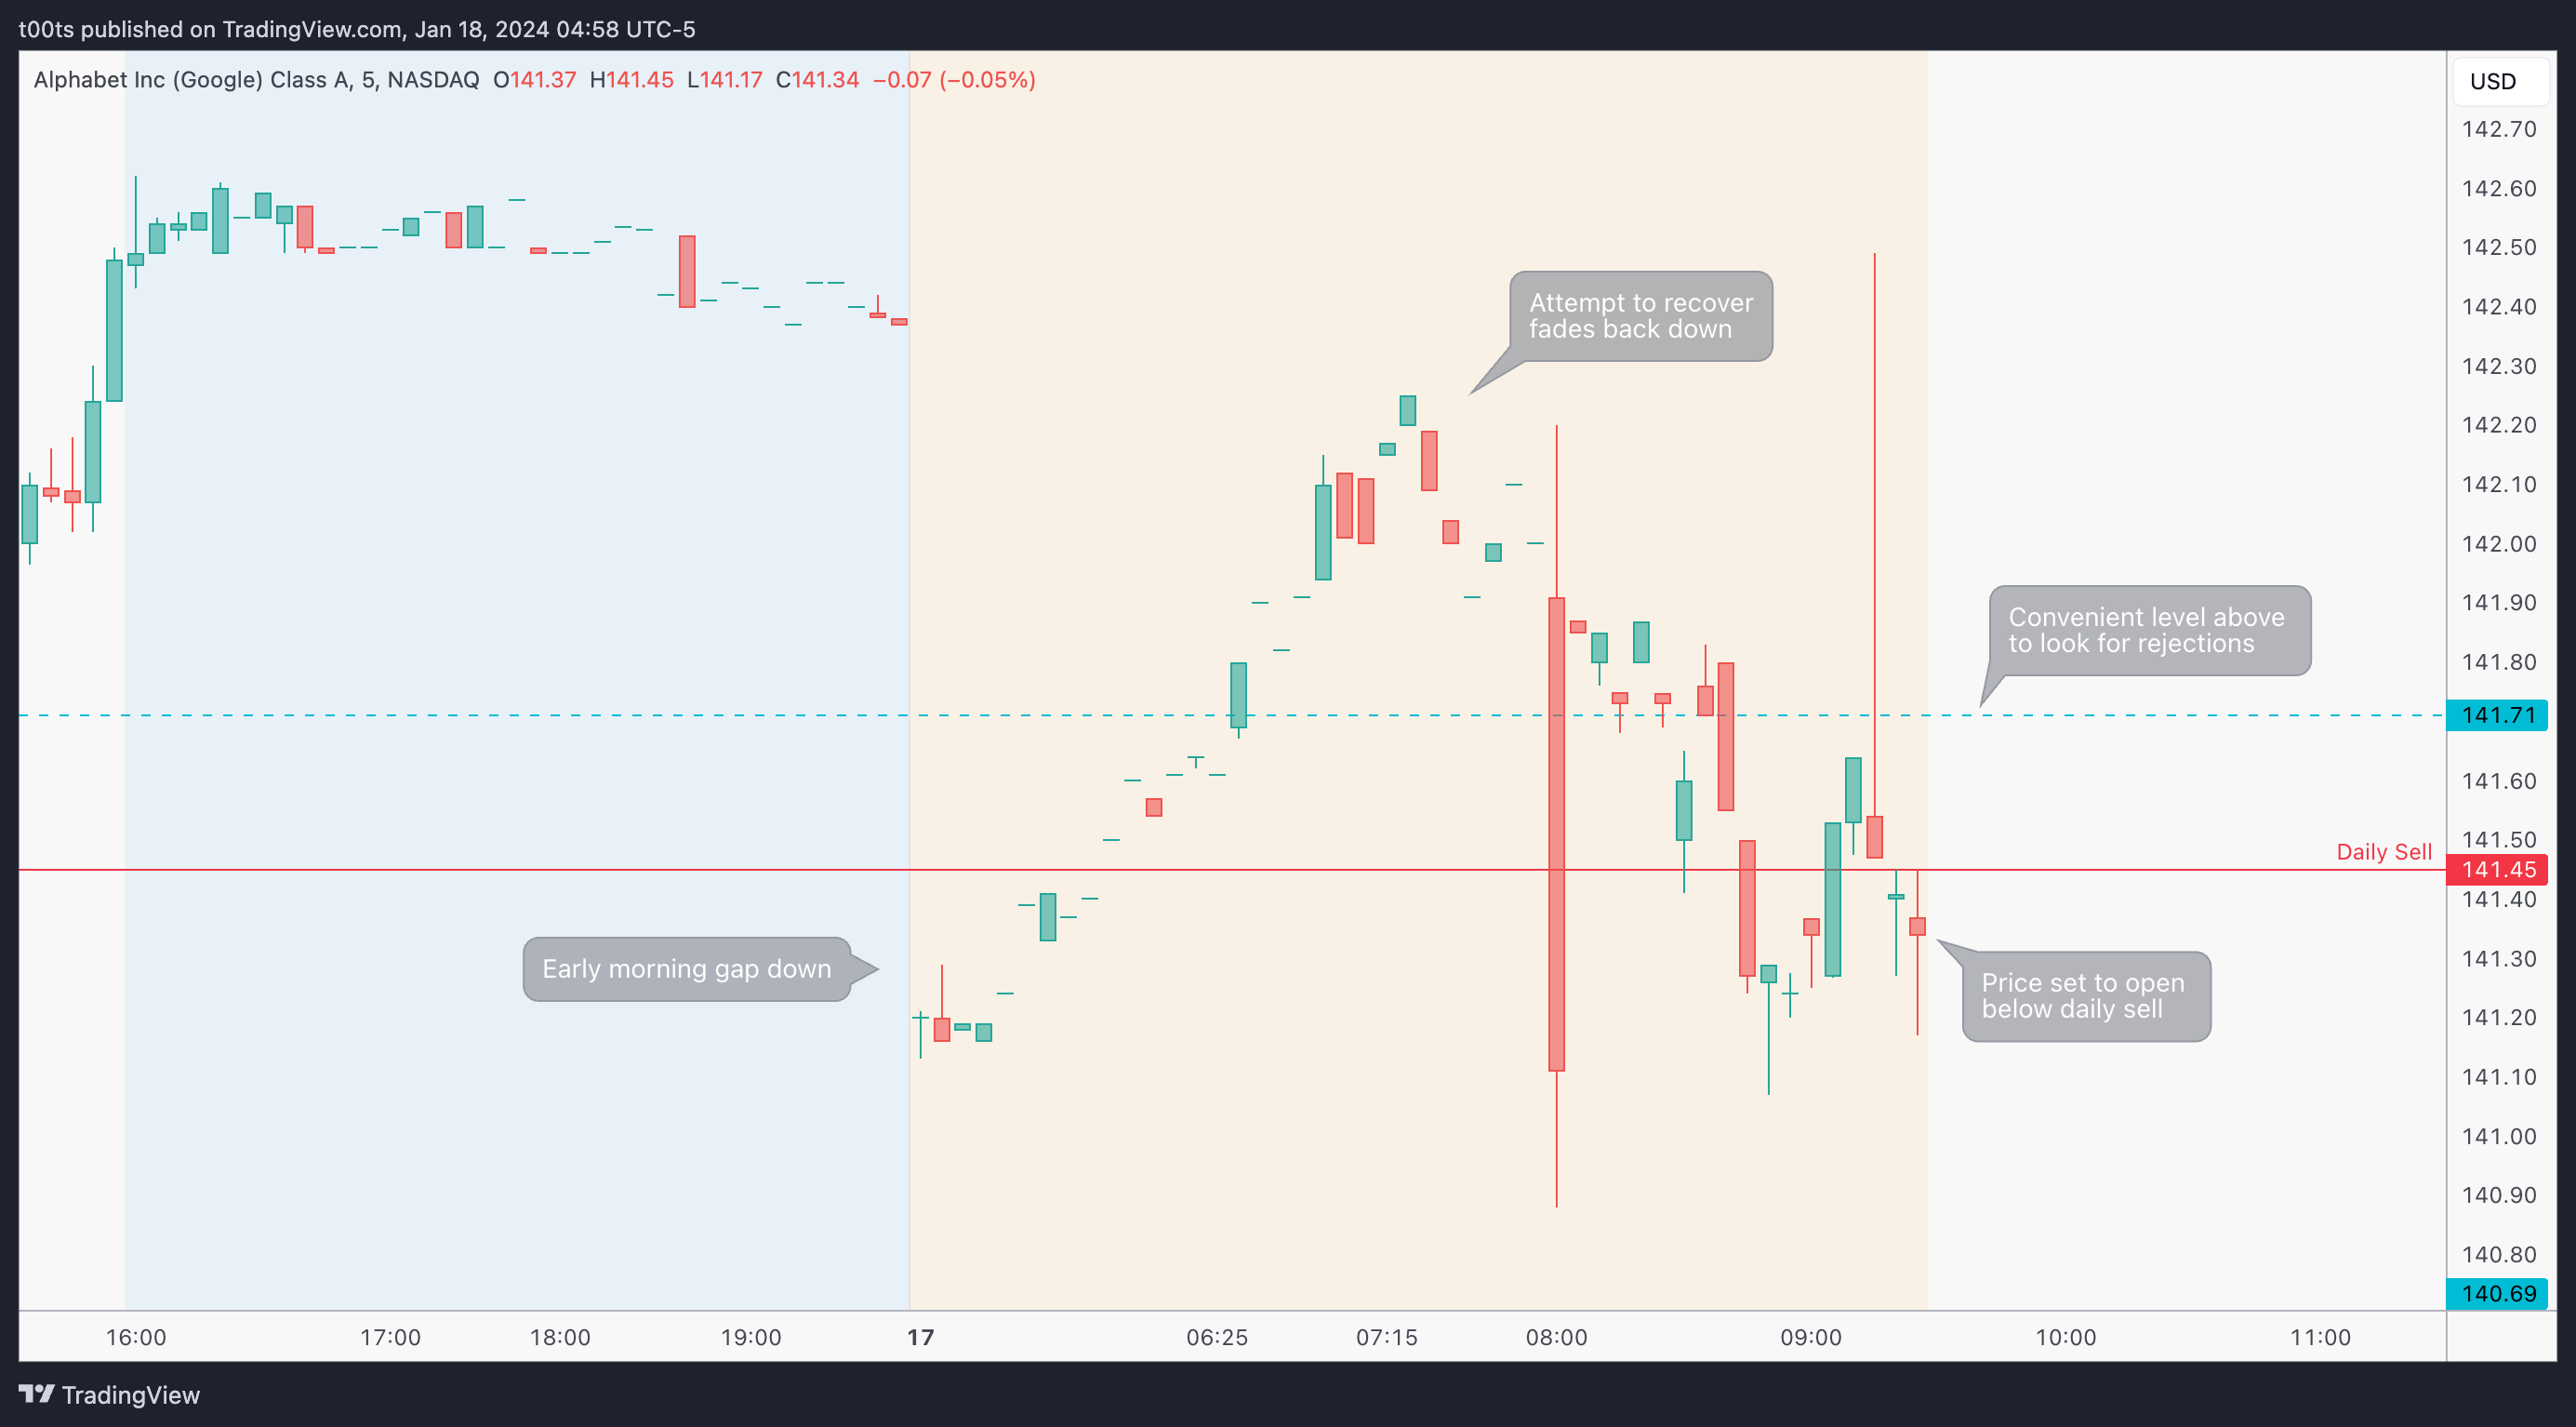
Pre-market action
Google gaps down and immediately gets pushed back up. Unfortunately for bulls, their attempt to recover quickly fades and price is set to open right below our daily sell threshold level. This is what really brought this name to my top watch for the open. It wasn't even in my original plan, but it deserved attention.
As previously mentioned, we have a level right above that we can use to trade off of. We also have our daily sell level, and we'll have our opening print right under this sell trigger. The avid reader can probably already devise the plan.
The trade
This looks like an opening drive play to the downside. It has all the elements. Let's go through them using our CPT Framework:
Cue(s)
Daily sell on counter-trend second entry
Gap down below a level
Gap down below the daily sell trigger
Intraday cue: Price rejecting the $141.71 level
Plan
Our plan resembles the typical plan for an opening drive play, but with focus on the downside.
We want to see a test and strong rejection of $141.71 level. That's our first intraday cue that we're looking for. If we get that and price comes back down below the daily sell, we can effectively use the opening print as our entry level, risking against the highs or even a few cents above the daily sell.
Trigger
Price getting back below the opening print after rejecting the $141.71 level.
5m chart
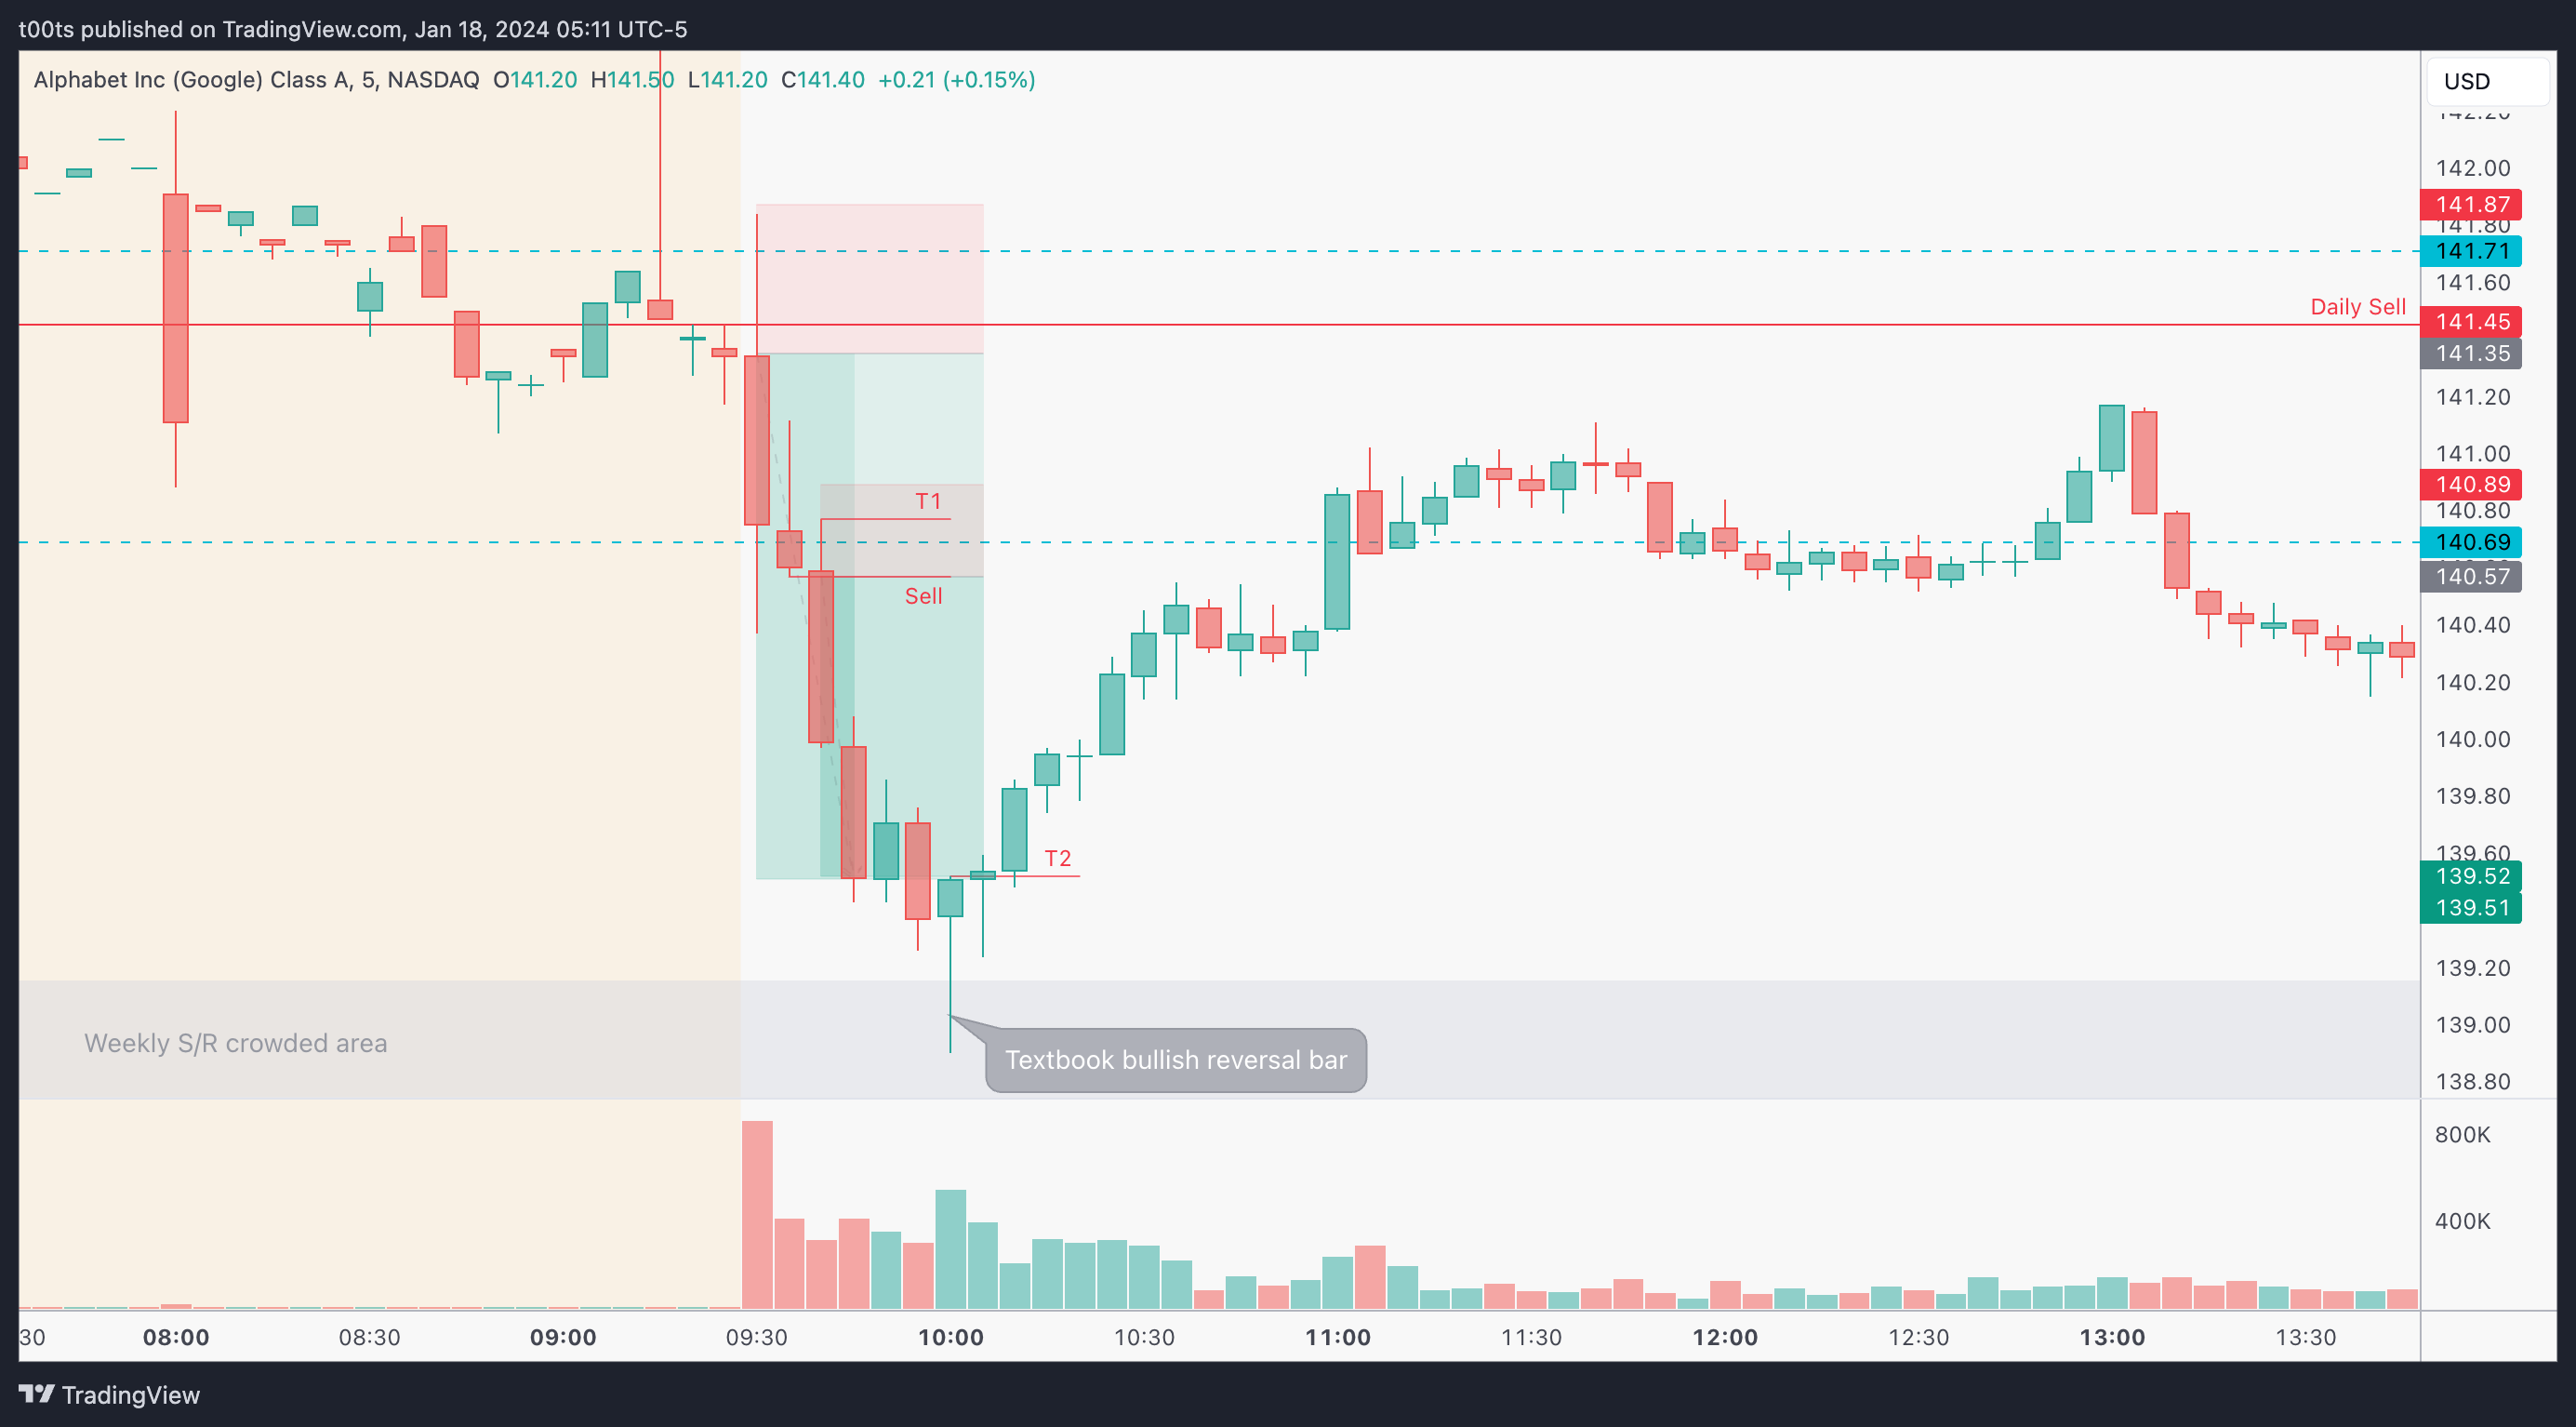
The rejection was quick. But again, we had all the ingredients to focus on this name straight off the open, so as long as it's part of your playbook there's really no excuses for missing something like this.
The moment price bounces on the $140.69 level you should ratchet your stop to the daily sell level (breakeven). From then on, it's a matter of holding until we have a reason not to.
We even got another textbook entry on that breakdown of a clear 3-bar play right under the $140.69 level. This was a great chance to add or to get involved for the second leg down if you missed the opening print or had taken some off on the $140.69 hold. Notice I trailed my stop here to the high of that breakdown candle as it makes total sense to get out of the way if price were to recover and reclaim that level.
As price comes down and reaches the weekly area we plotted earlier, it starts losing momentum. We get a very clear and aggressive 5m reversal bar right at that area. If we weren't short I'd probably be looking for longs here. So with that psychology in mind, it's time to trail our stop again to the highs of that bar, which indeed triggers almost immediately after. Both of our entries offered over 3R with little to no stress.
Personally, I love trading the open when an opportunity is present. Price moves faster and you know you're right or wrong almost immediately. Which is arguably often a good thing.
Closing notes
There was nothing interesting that day. A lot of people went on to trade TSLA (I’m guilty as well) and were caught in a choppy range. A name like Tesla always has eyes on it, hence the intraday volatility it has us accustomed to. It's interesting to be aware of this phenomenon and use it to your advantage, but don’t abuse it if there’s no setup.
While this Google trade was a little unconventional and maybe less sexy, it ticked all the boxes and the plan ended up working out.
I am posting one trade writeup every day throughout 2024. I focus on large caps using levels and price action. The subscription is absolutely free and will always be. I will strive to provide value by offering clues and ideas for you to enhance your edge. Let’s grow together!