
Coinbase (COIN) - Jan 11th 2024
Spot Bitcoin ETFs ready to start trading following SEC approval

Higher timeframe context
After a decade-long struggle with the Crypto industry, the green light from the U.S. Securities and Exchange Commission finally came. Investors can now have direct Bitcoin exposure through regulated U.S.-listed securities.
This raises a few questions. What does this mean for Bitcoin? Is it bullish? Is it bearish? Will the overall volatility decrease?
Also, what does it mean for names like $COIN, $MARA, $RIOT, etc. Will we see money flow out of these proxy names now that there's a better vehicle?
Today I’ll use Coinbase, arguably most significant crypto name in the U.S. market, to dive into one of the many opportunities the market offered yesterday to capitalize on the first trading day of the new Bitcoin ETFs.
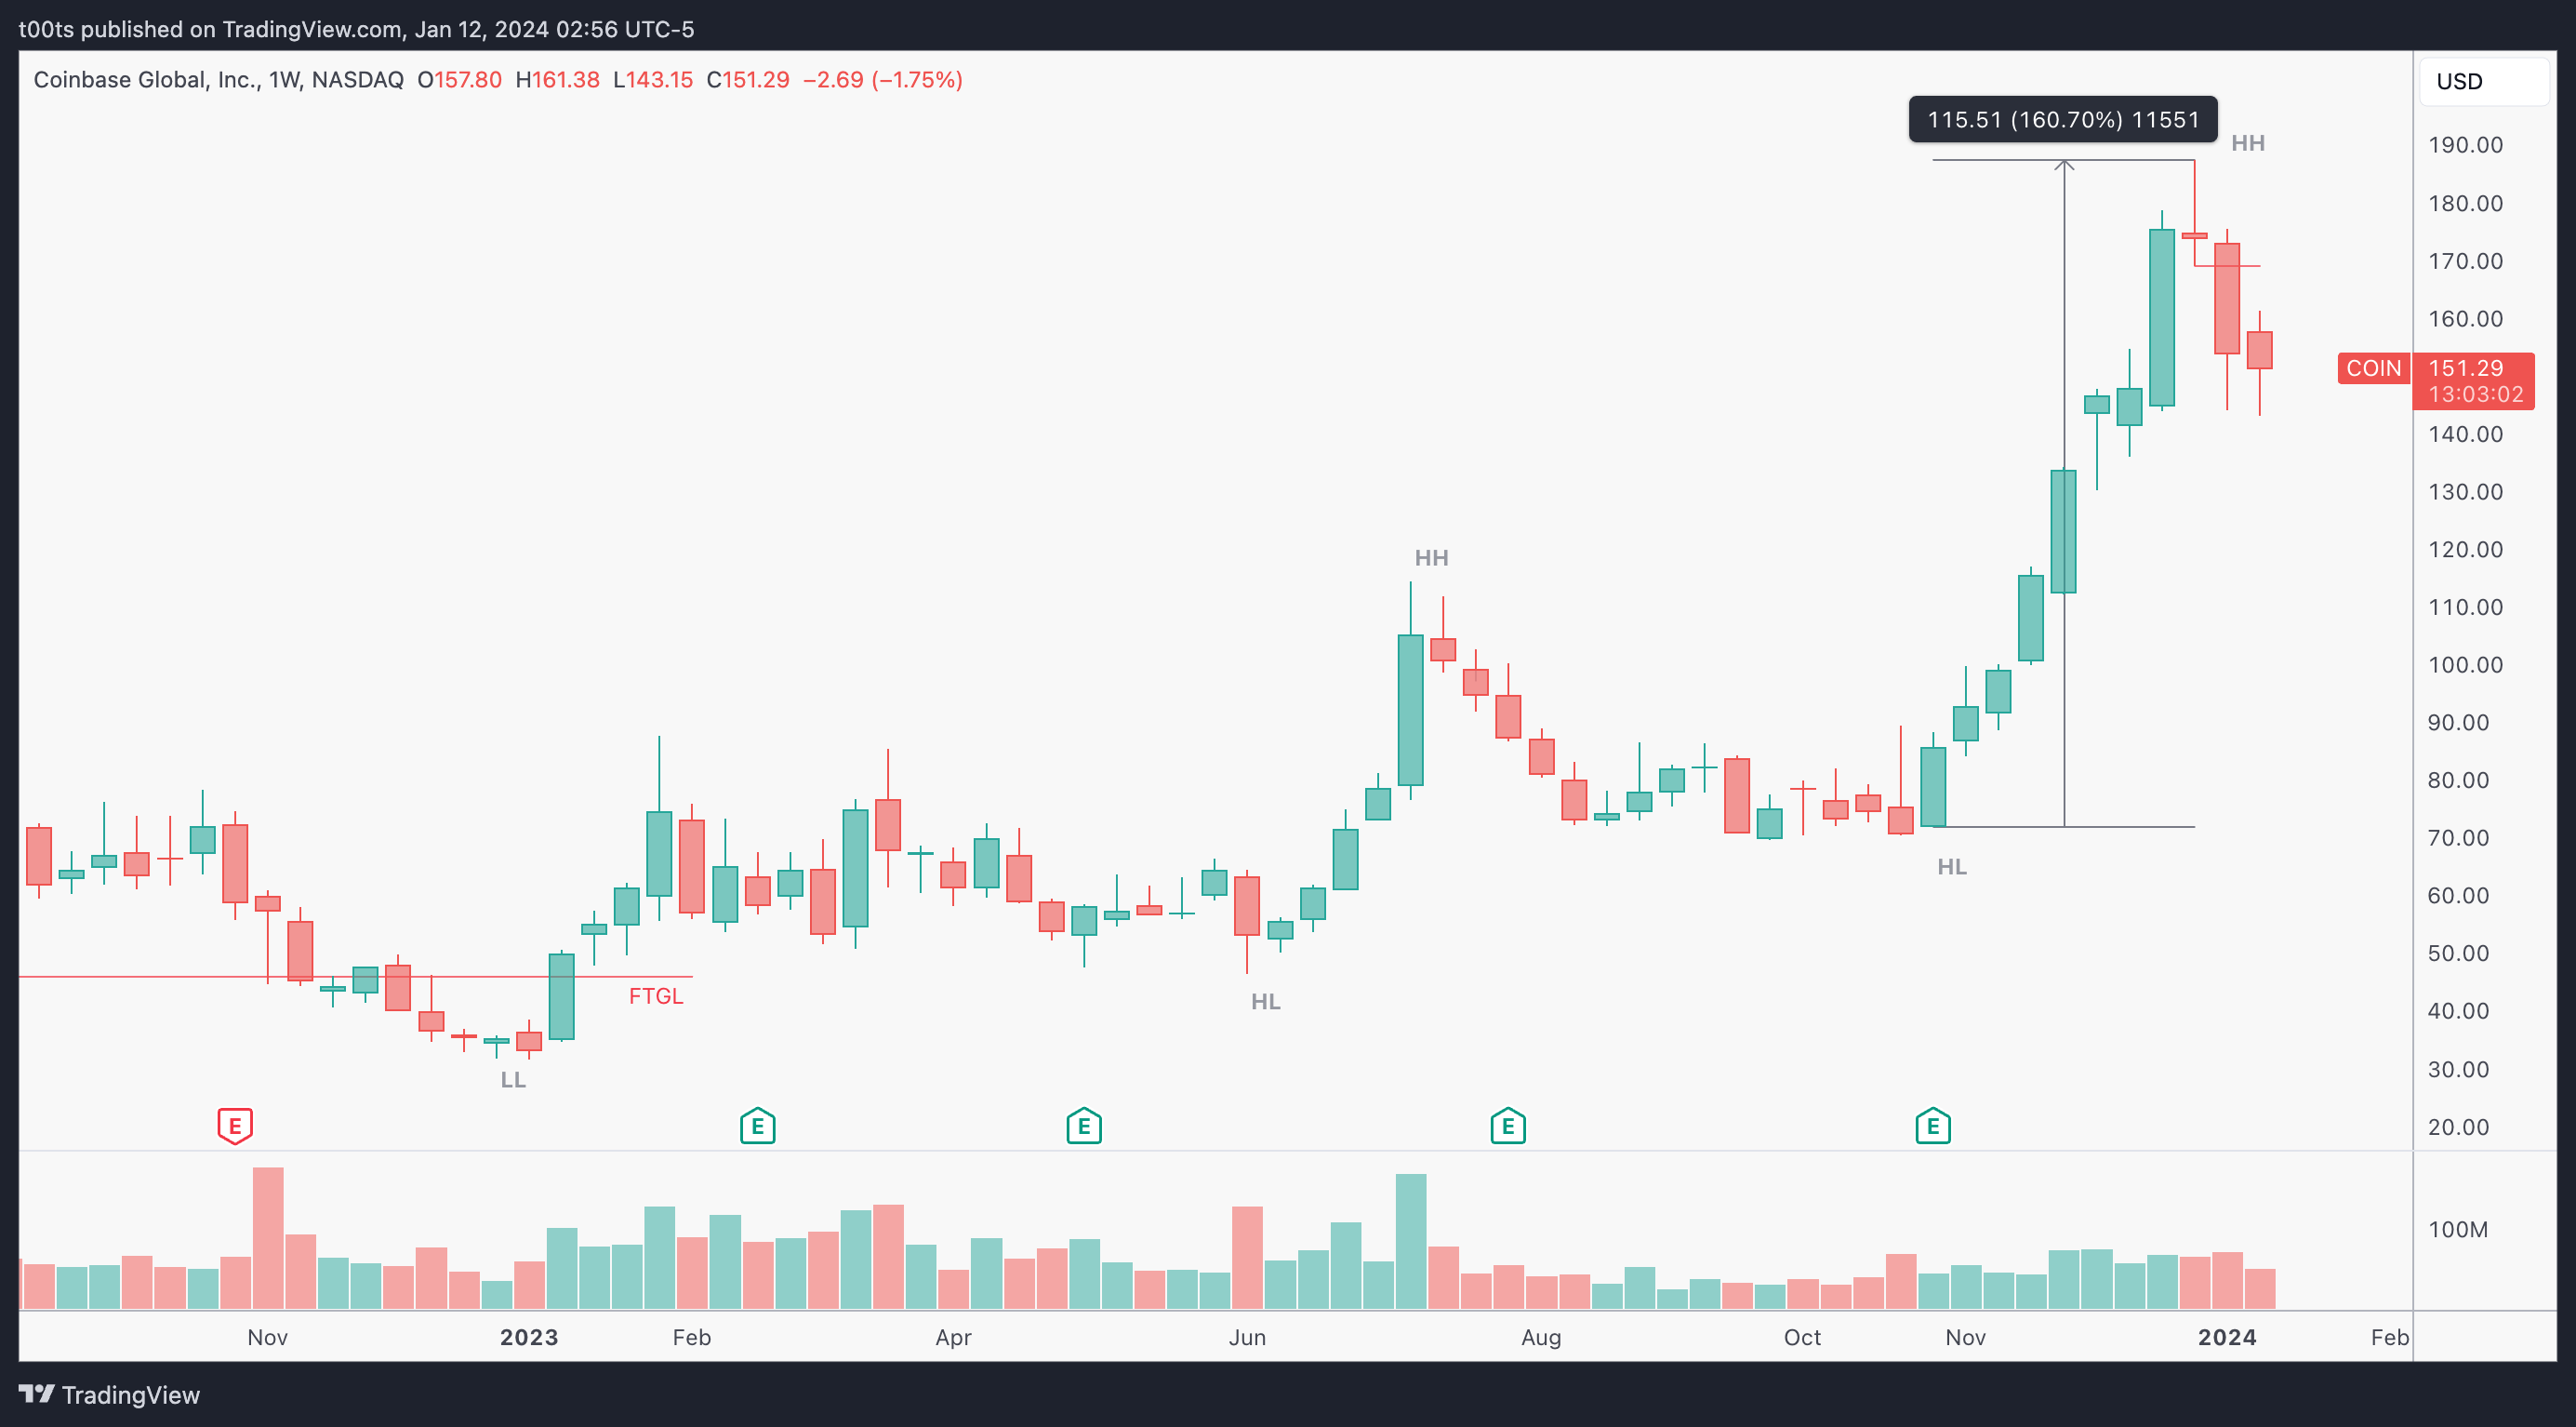
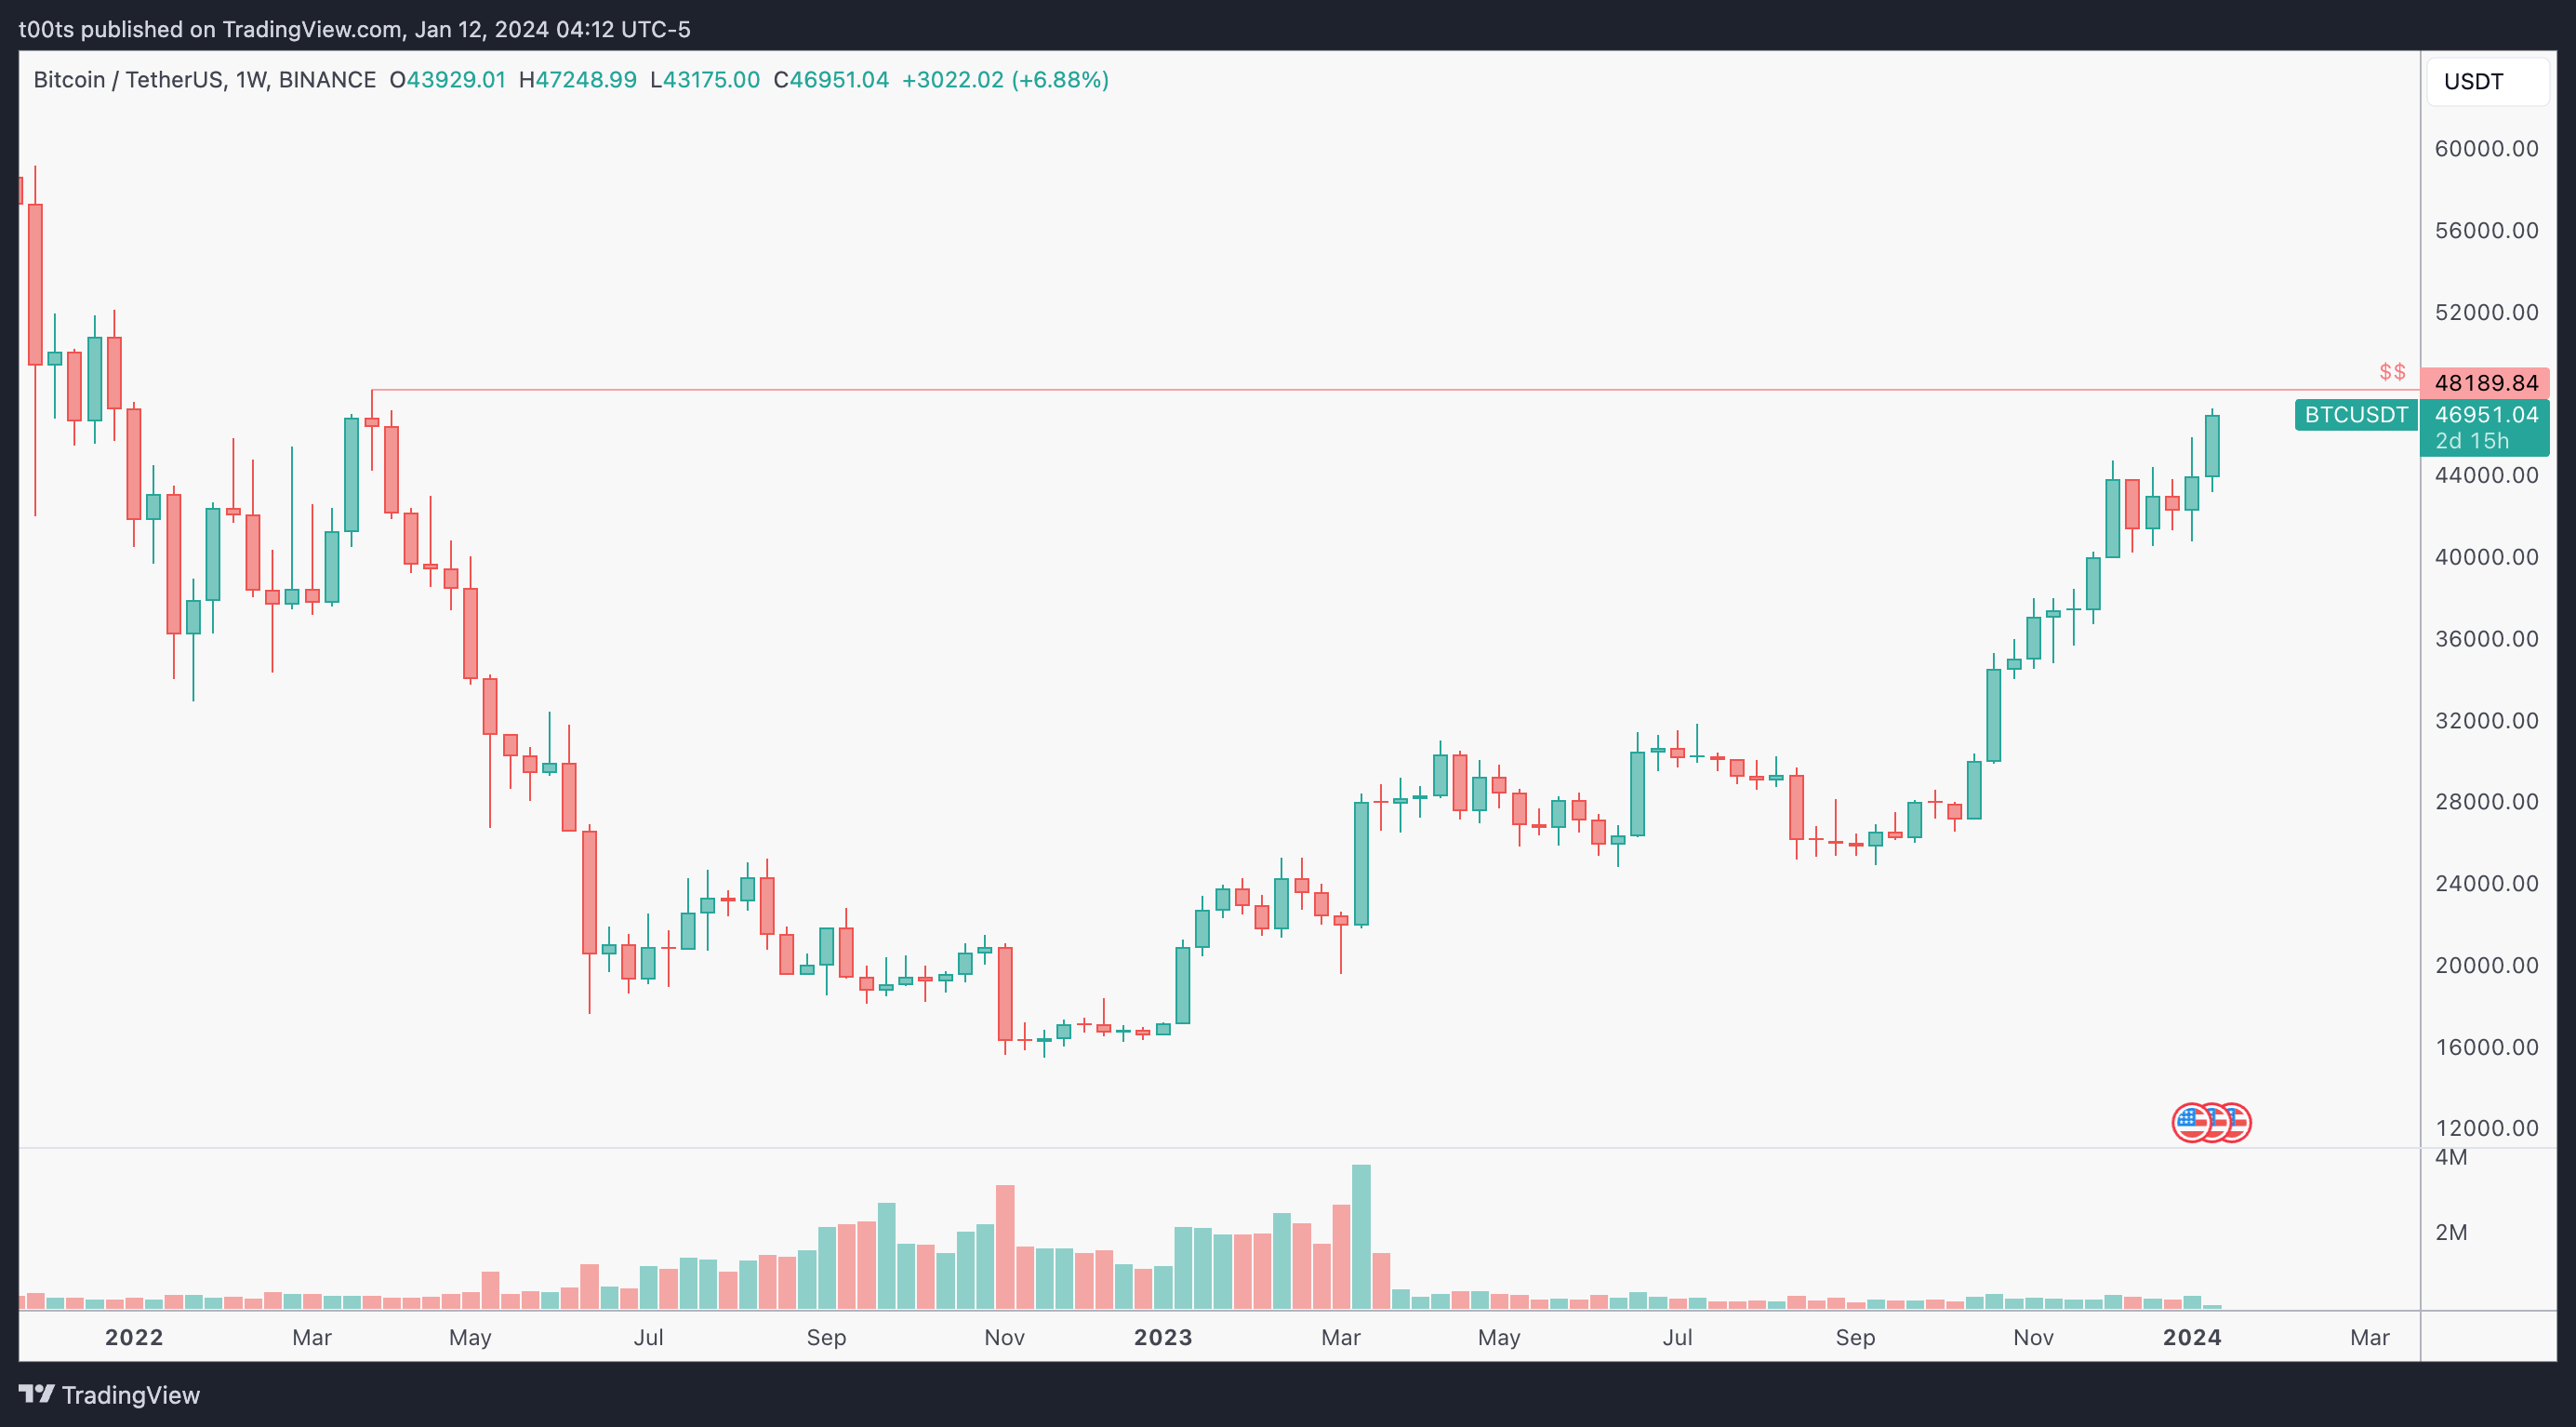
Weekly chart
Price fails to go lower when bulls reclaim previous lows back in early 2023. After that, price accumulates for 6 months before starting its first leg up. A positive Q3 earnings surprise turns an ugly bearish hammer into the ignition of a massive 160% leg up. Not surprisingly, Bitcoin itself had also started to climb aggressively at this time, but we do find some relative strength in this name vs. Bitcoin especially during that last push.
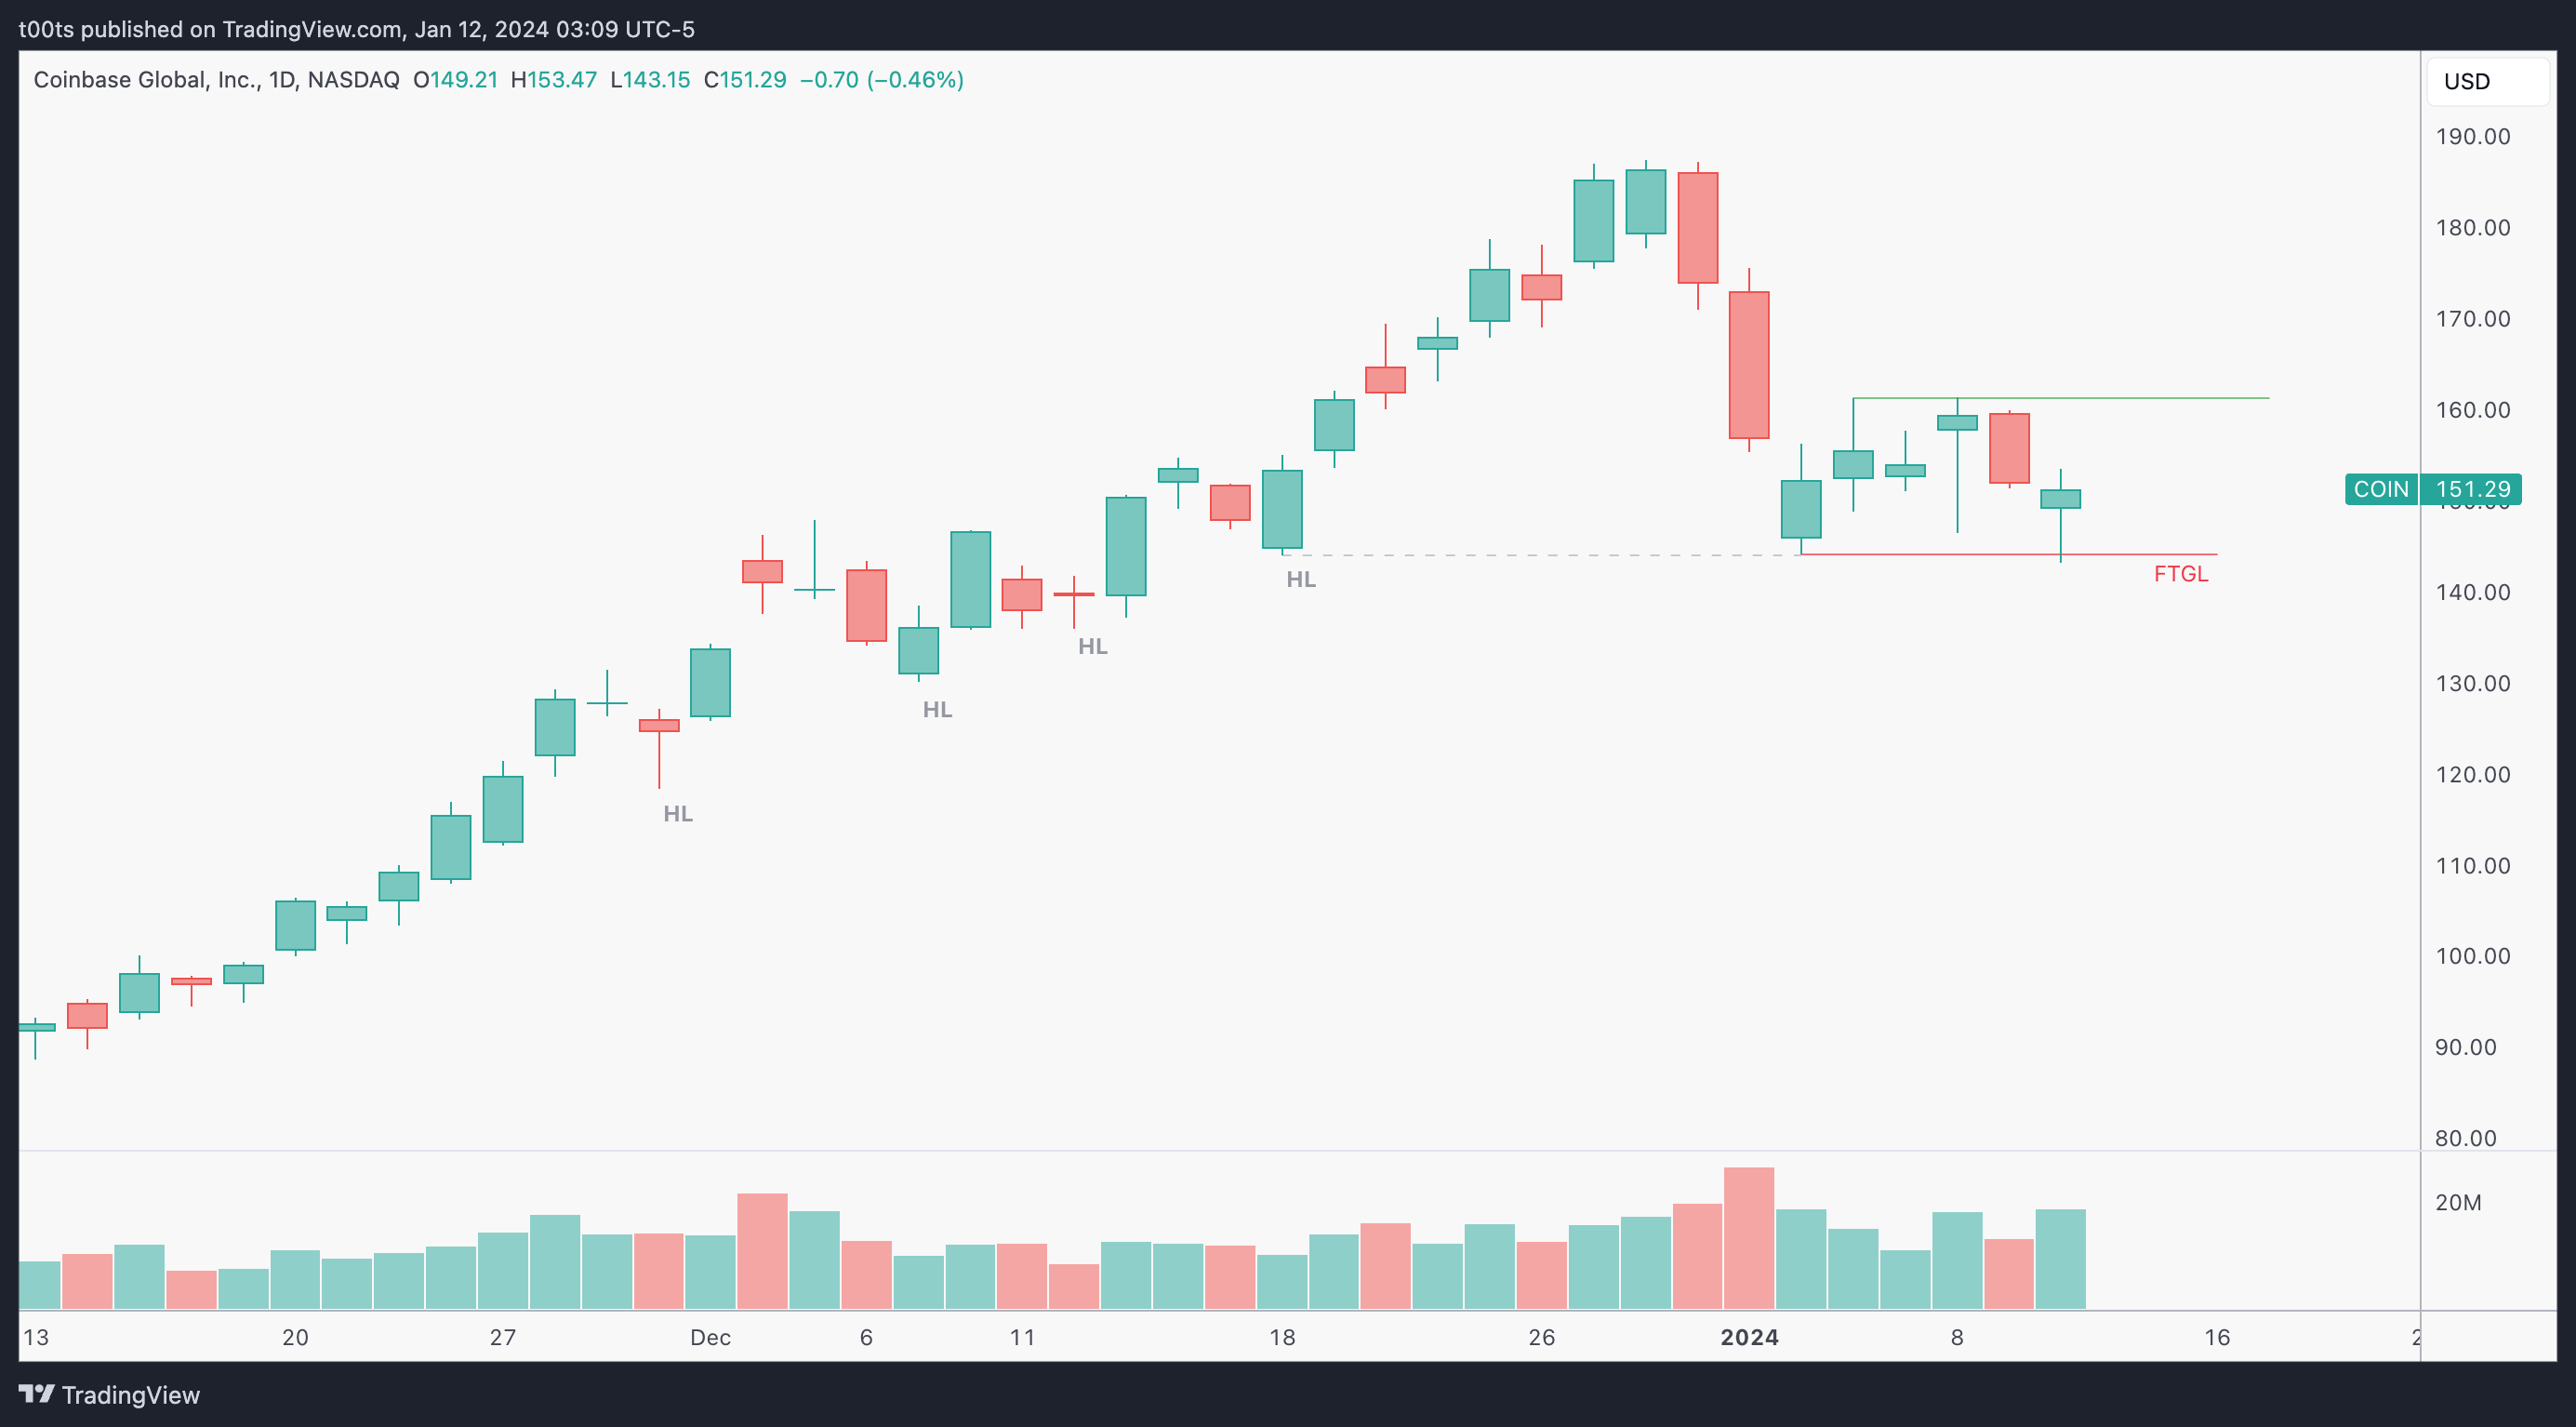
Daily chart
The daily chart has a few things worth pointing out. First off, we now have better detail of the weekly pullback we just saw. Turns out price is technically still in an uptrend, even in the daily chart. The last higher low we have from Dec 28th is actually holding really well. Yesterday we even failed to break it down, resulting in a rather bullish hammer candle with high volume. If we had no news coming up, this is a great chart to look for longs in my opinion.
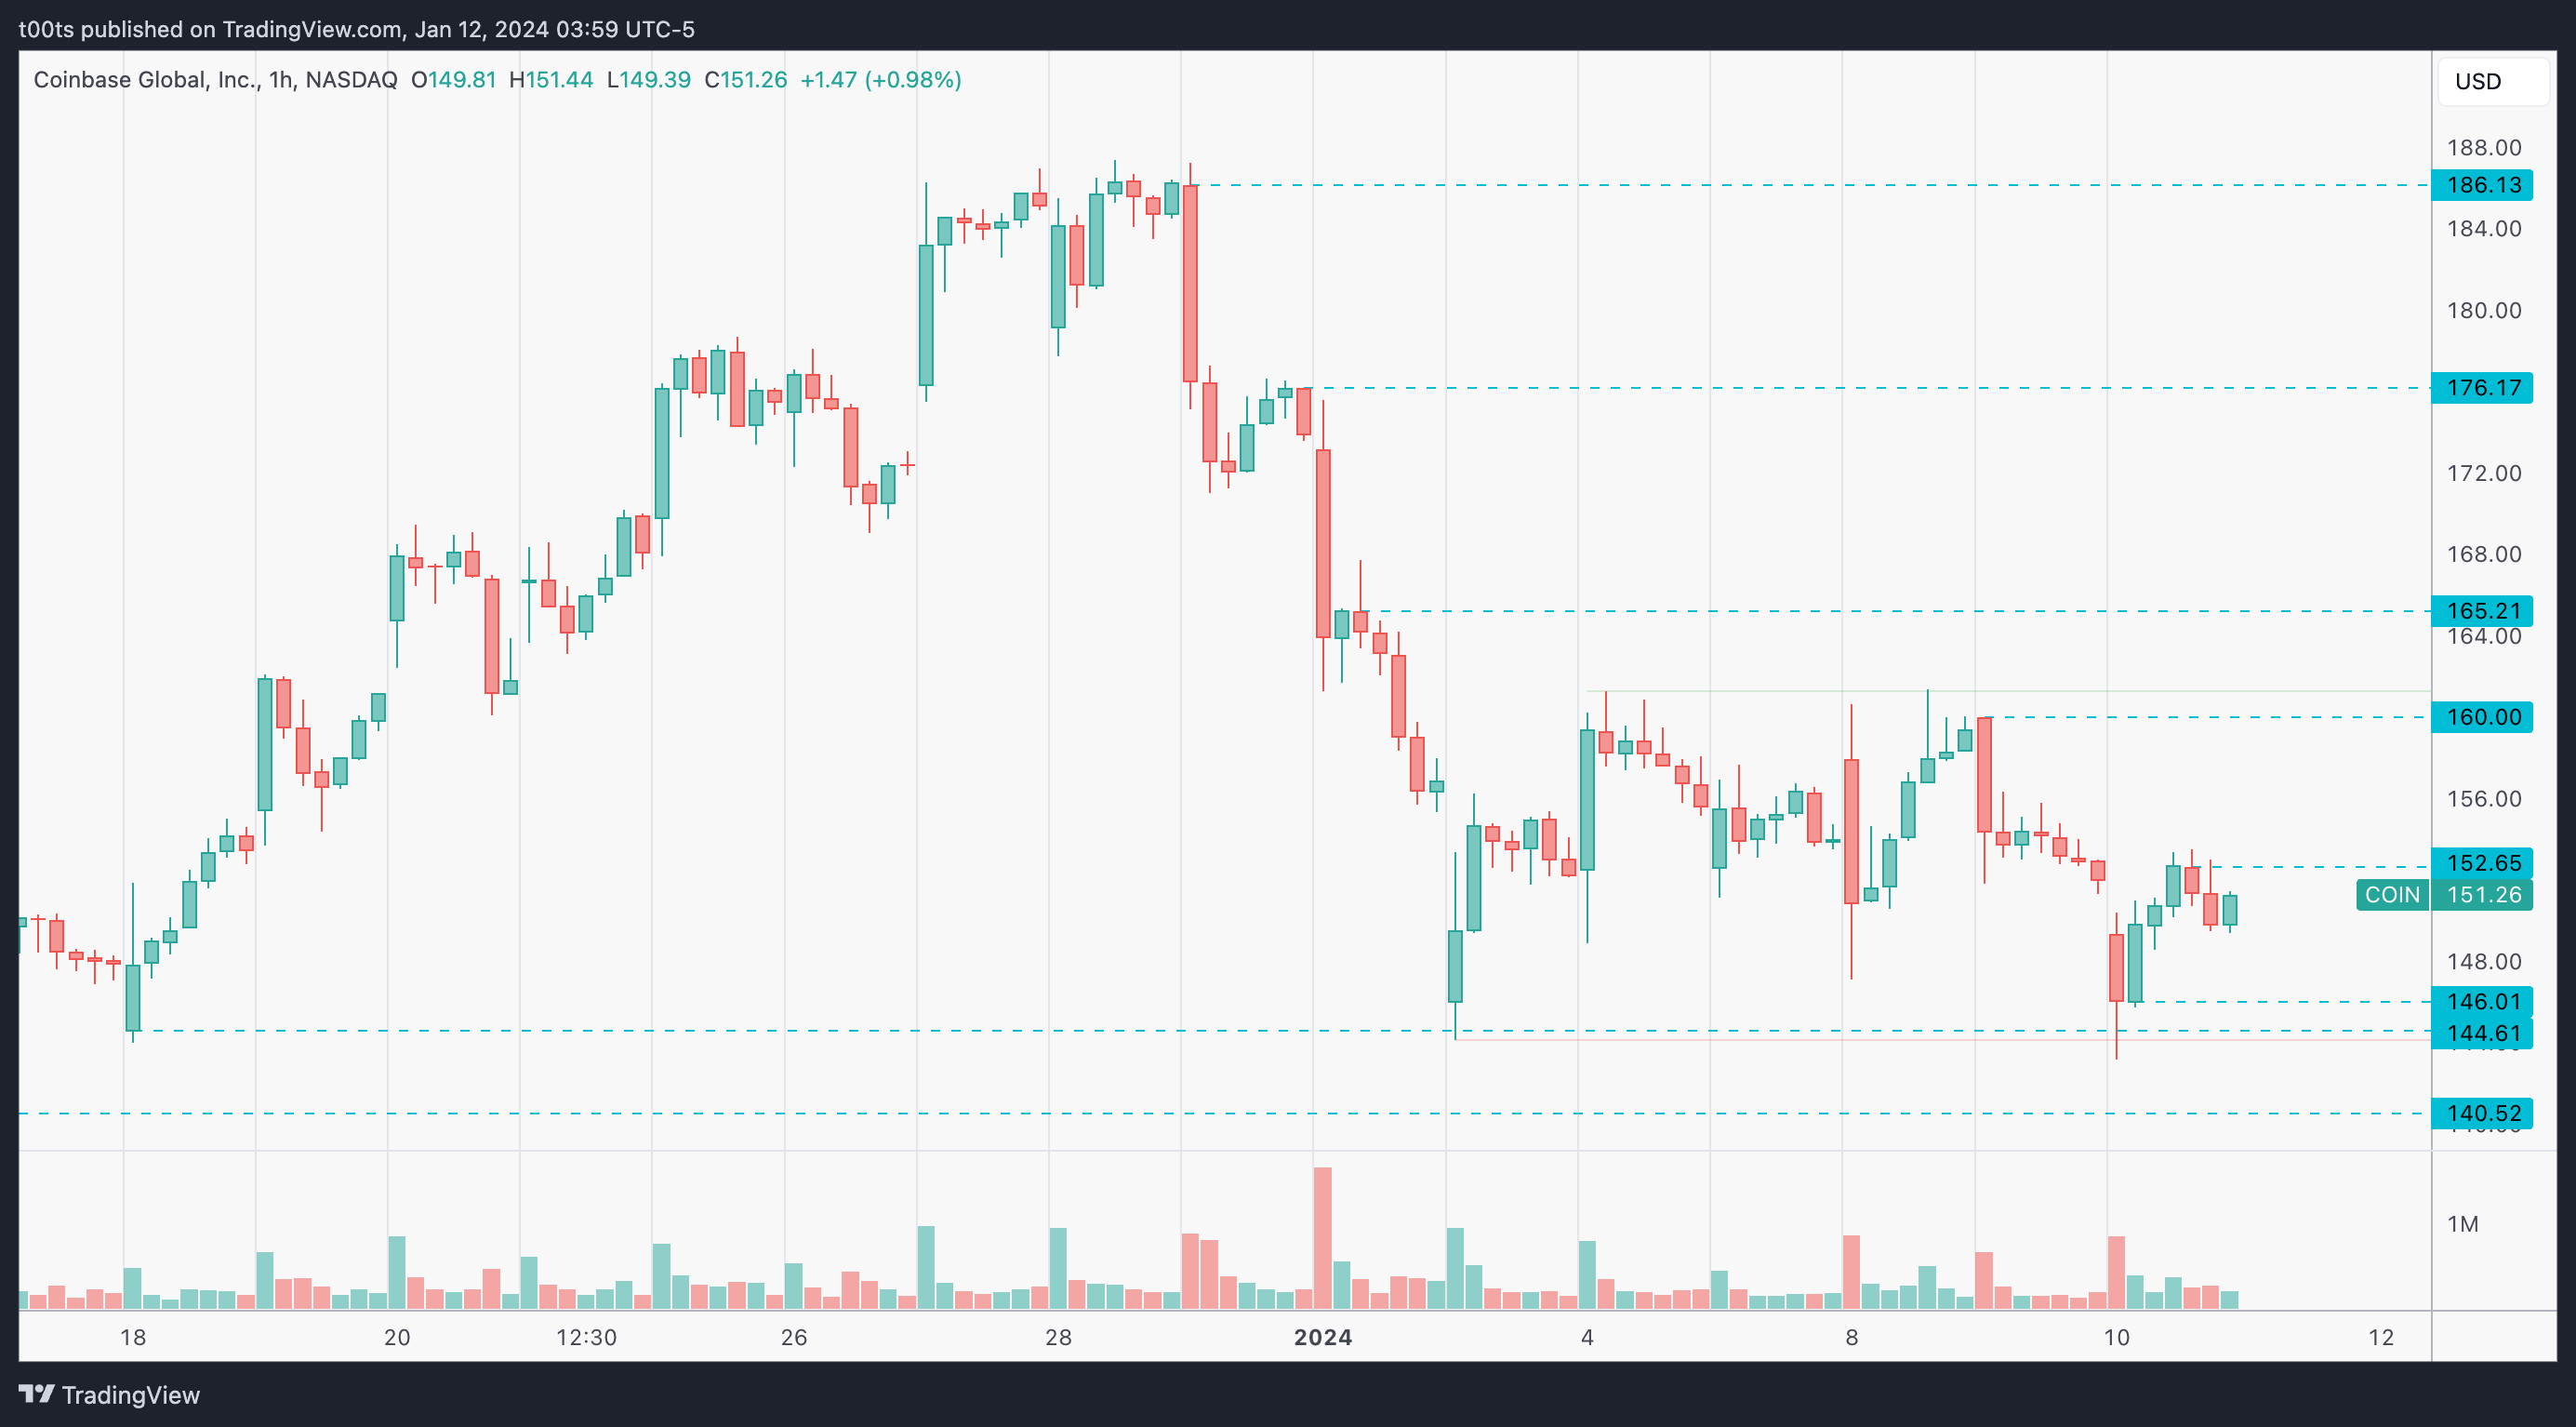
Hourly chart
As we just saw on the daily chart, price is range bound. We get a little bit more detail on that failed breakdown from yesterday and again, longs above $152.65 are on the table. The $160 level is the strongest resistance we have nearby. In terms of support, $144.61 looks pretty strong as well.
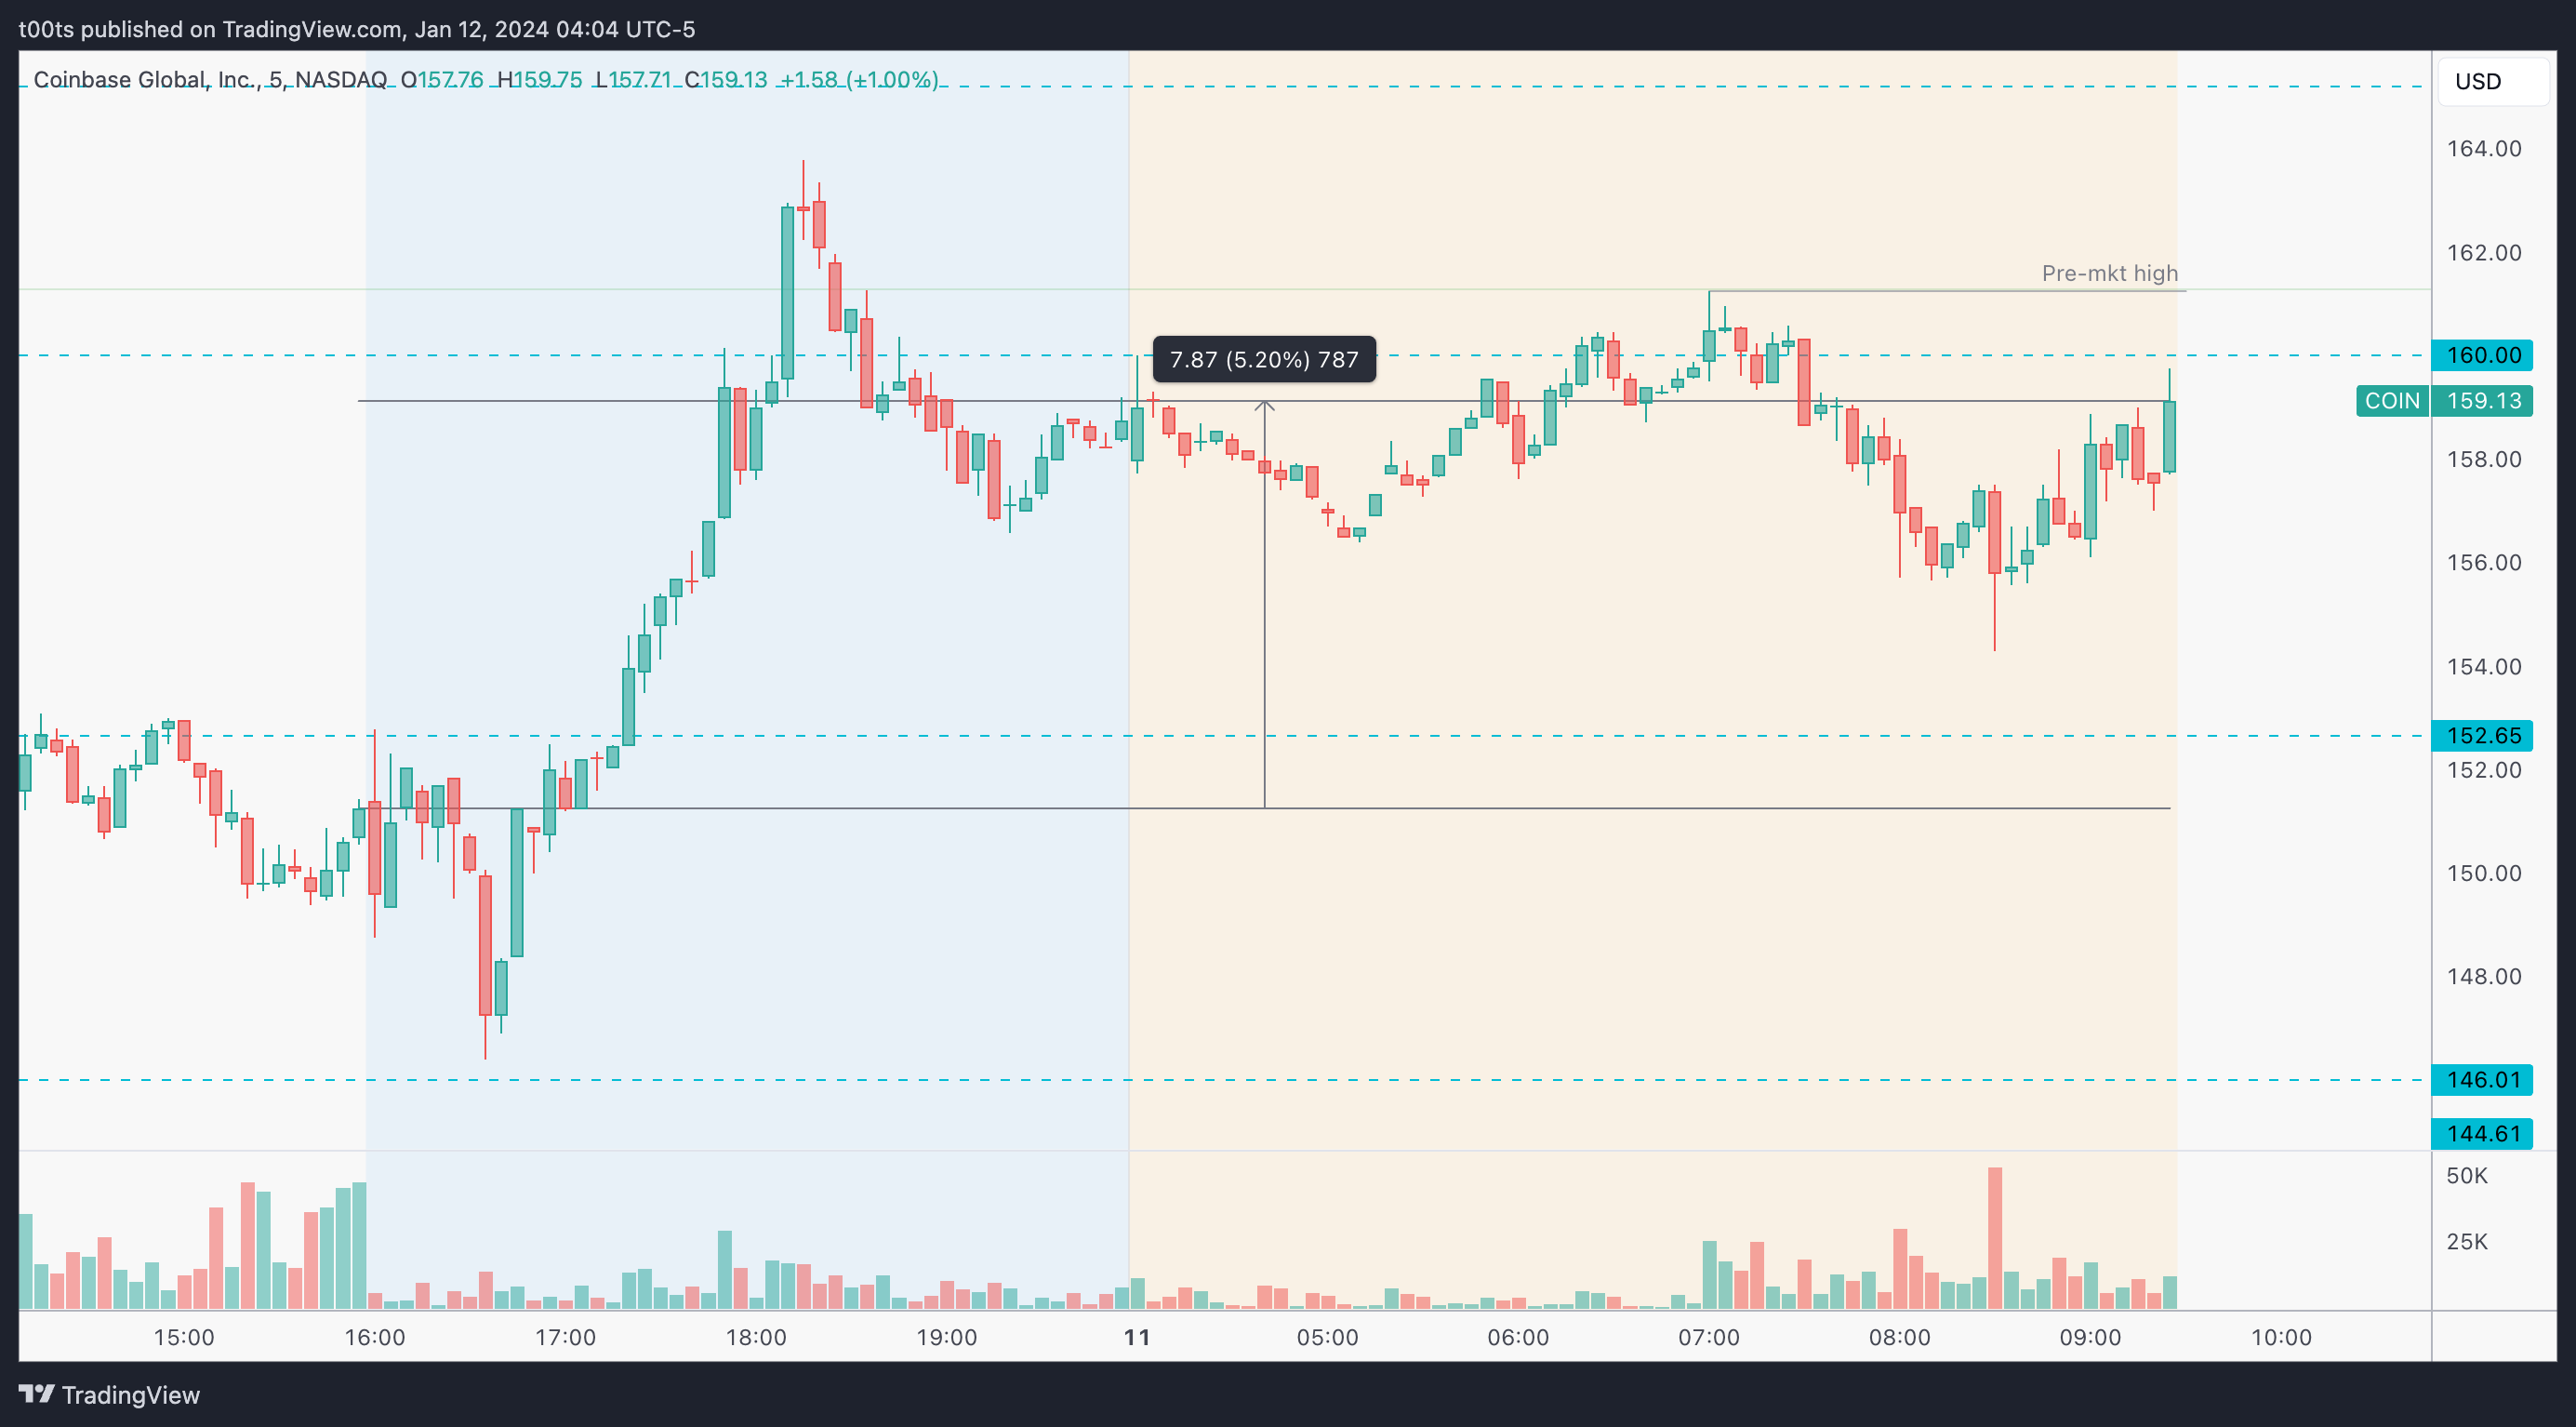
Pre-market action
Price is gapping up a whopping 5%. The $160 level was tested a couple times and we're set to open right below it. Price is in a range but it does look like we could break out of this level. The pre-market high is exactly the top of the range we marked on our daily chart.
What's up with Bitcoin?
Here's what the two charts look like side-by-side right before the bell. Both are 5m charts with price action containing the exact same time span.
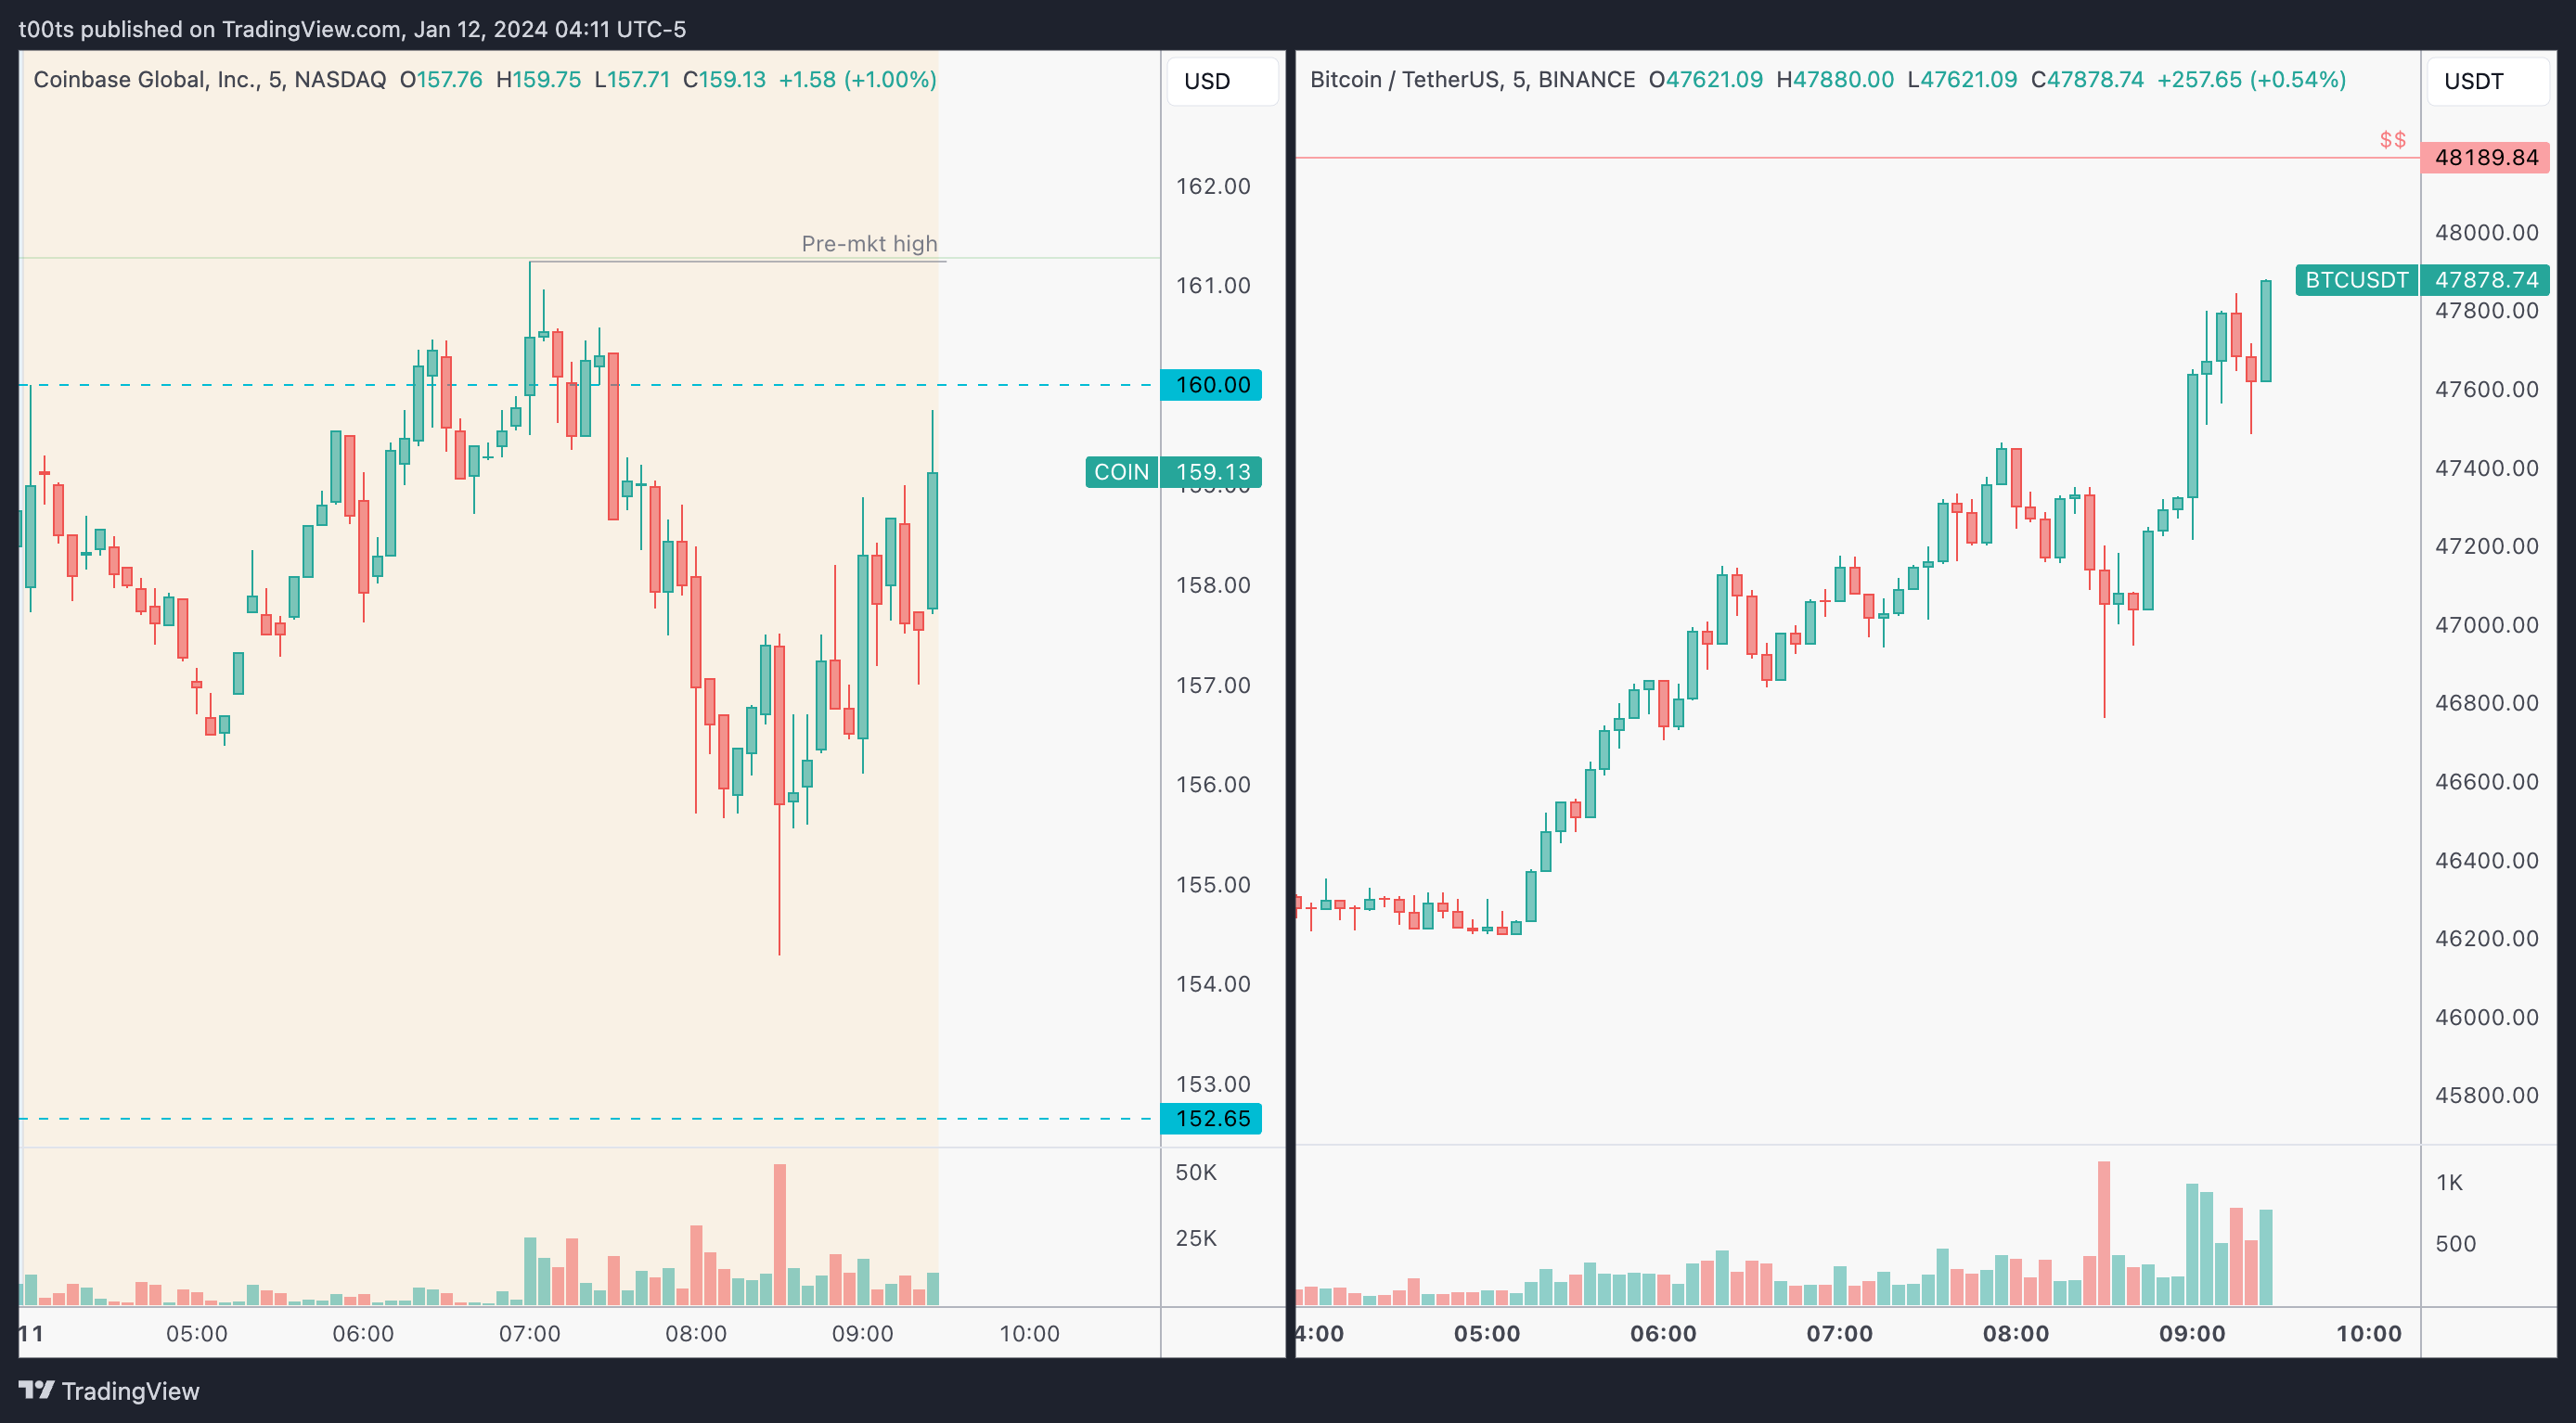
Now, let's zoom out on Bitcoin for a second. Pulling up a weekly chart, this is what we get. The exact pivot that led to the last huge meltdown is right above us. These pivots act as liquidity levels. If the market wants to turn, it's going to need liquidity. I personally was eyeing this level and posted this chart on 𝕏 as soon as price took the liquidity and broke back down. As we'll see, this liquidity grab, together with the sell the news phenomenon, led to a massive short opportunity which, spoiler alert, I failed to capitalize on.
The trade
This is my hindsight analysis on this monster opportunity we had yesterday. I didn't catch it. I failed to plan for it. I was naively watching the Bitcoin short trade while most of these U.S.-listed crypto names I could actually trade offered these great trades.
I'll use this as an accountability review to make sure I'm prepared for the next one.
Using our CPT Framework:
Cue(s)
Potential “sell the news” scenario on crypto-related names
Bitcoin itself approaching the largest liquidity level in 2 years
Potential of capital flowing out from these proxy names into the actual ETFs
Intraday cue: Bitcoin breaches the liquidity level and fails to hold it
Intraday cue: Price rejecting the $160 strong level
Intraday cue: Price failing to hold the opening print
Plan
You had to be onto this play to catch it. You had to plan for this scenario and, in my opinion, somewhat biased in favor of the “sell the news” scenario.
On the first 5m chart, I annotate the trade that even an algo could've taken just using the basics we trade off of every day:
Strong resistance rejects 3 times (matching the top of a trading range)
Failure to go above the open and the $160 level
Opening print rejection
Trigger
Break below the signal bar low
5m chart
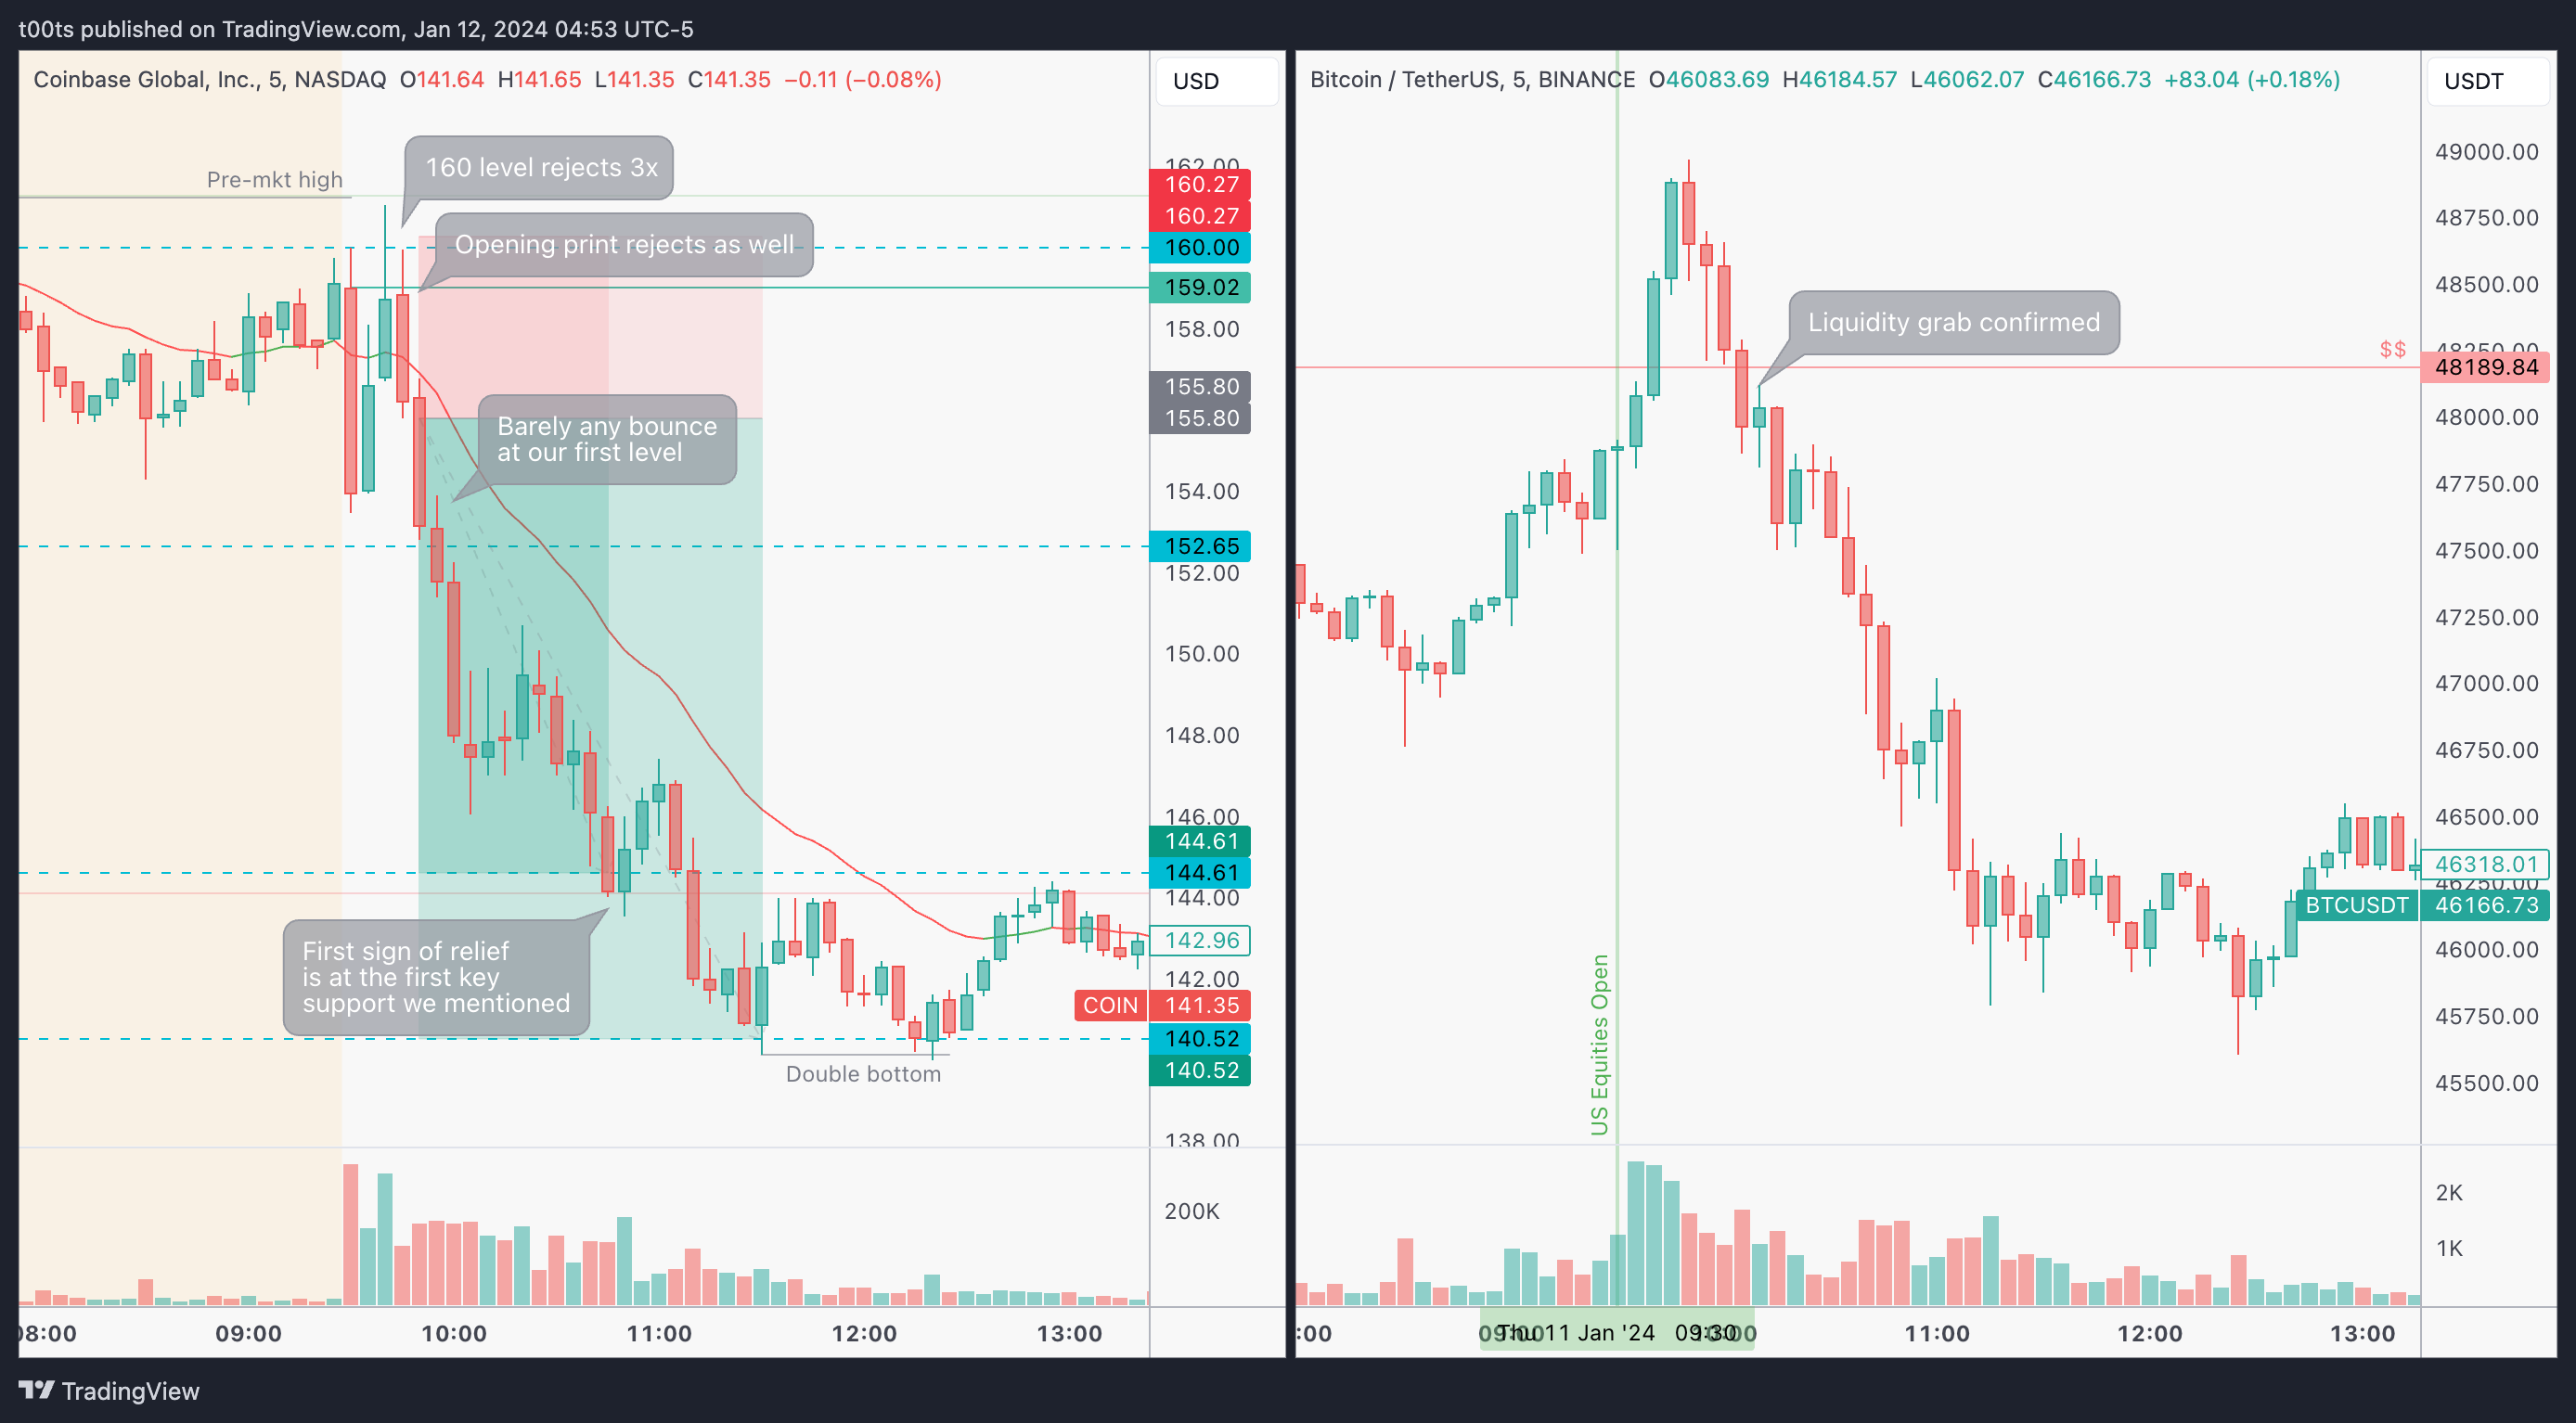
If you consider this trade without the whole catalyst behind it, it's actually a setup we've seen before. Stock is gapping up into the top of the trading range. It tries to break out of the range 3 times and fails. Normally, when price tries to do something twice and fails, it will try to go the opposite way. And this is exactly what happened. Add the “sell the news” catalyst and the Bitcoin liquidity grab and you have enough cues to put risk on. Once again, this had to be part of your plan.
2m chart
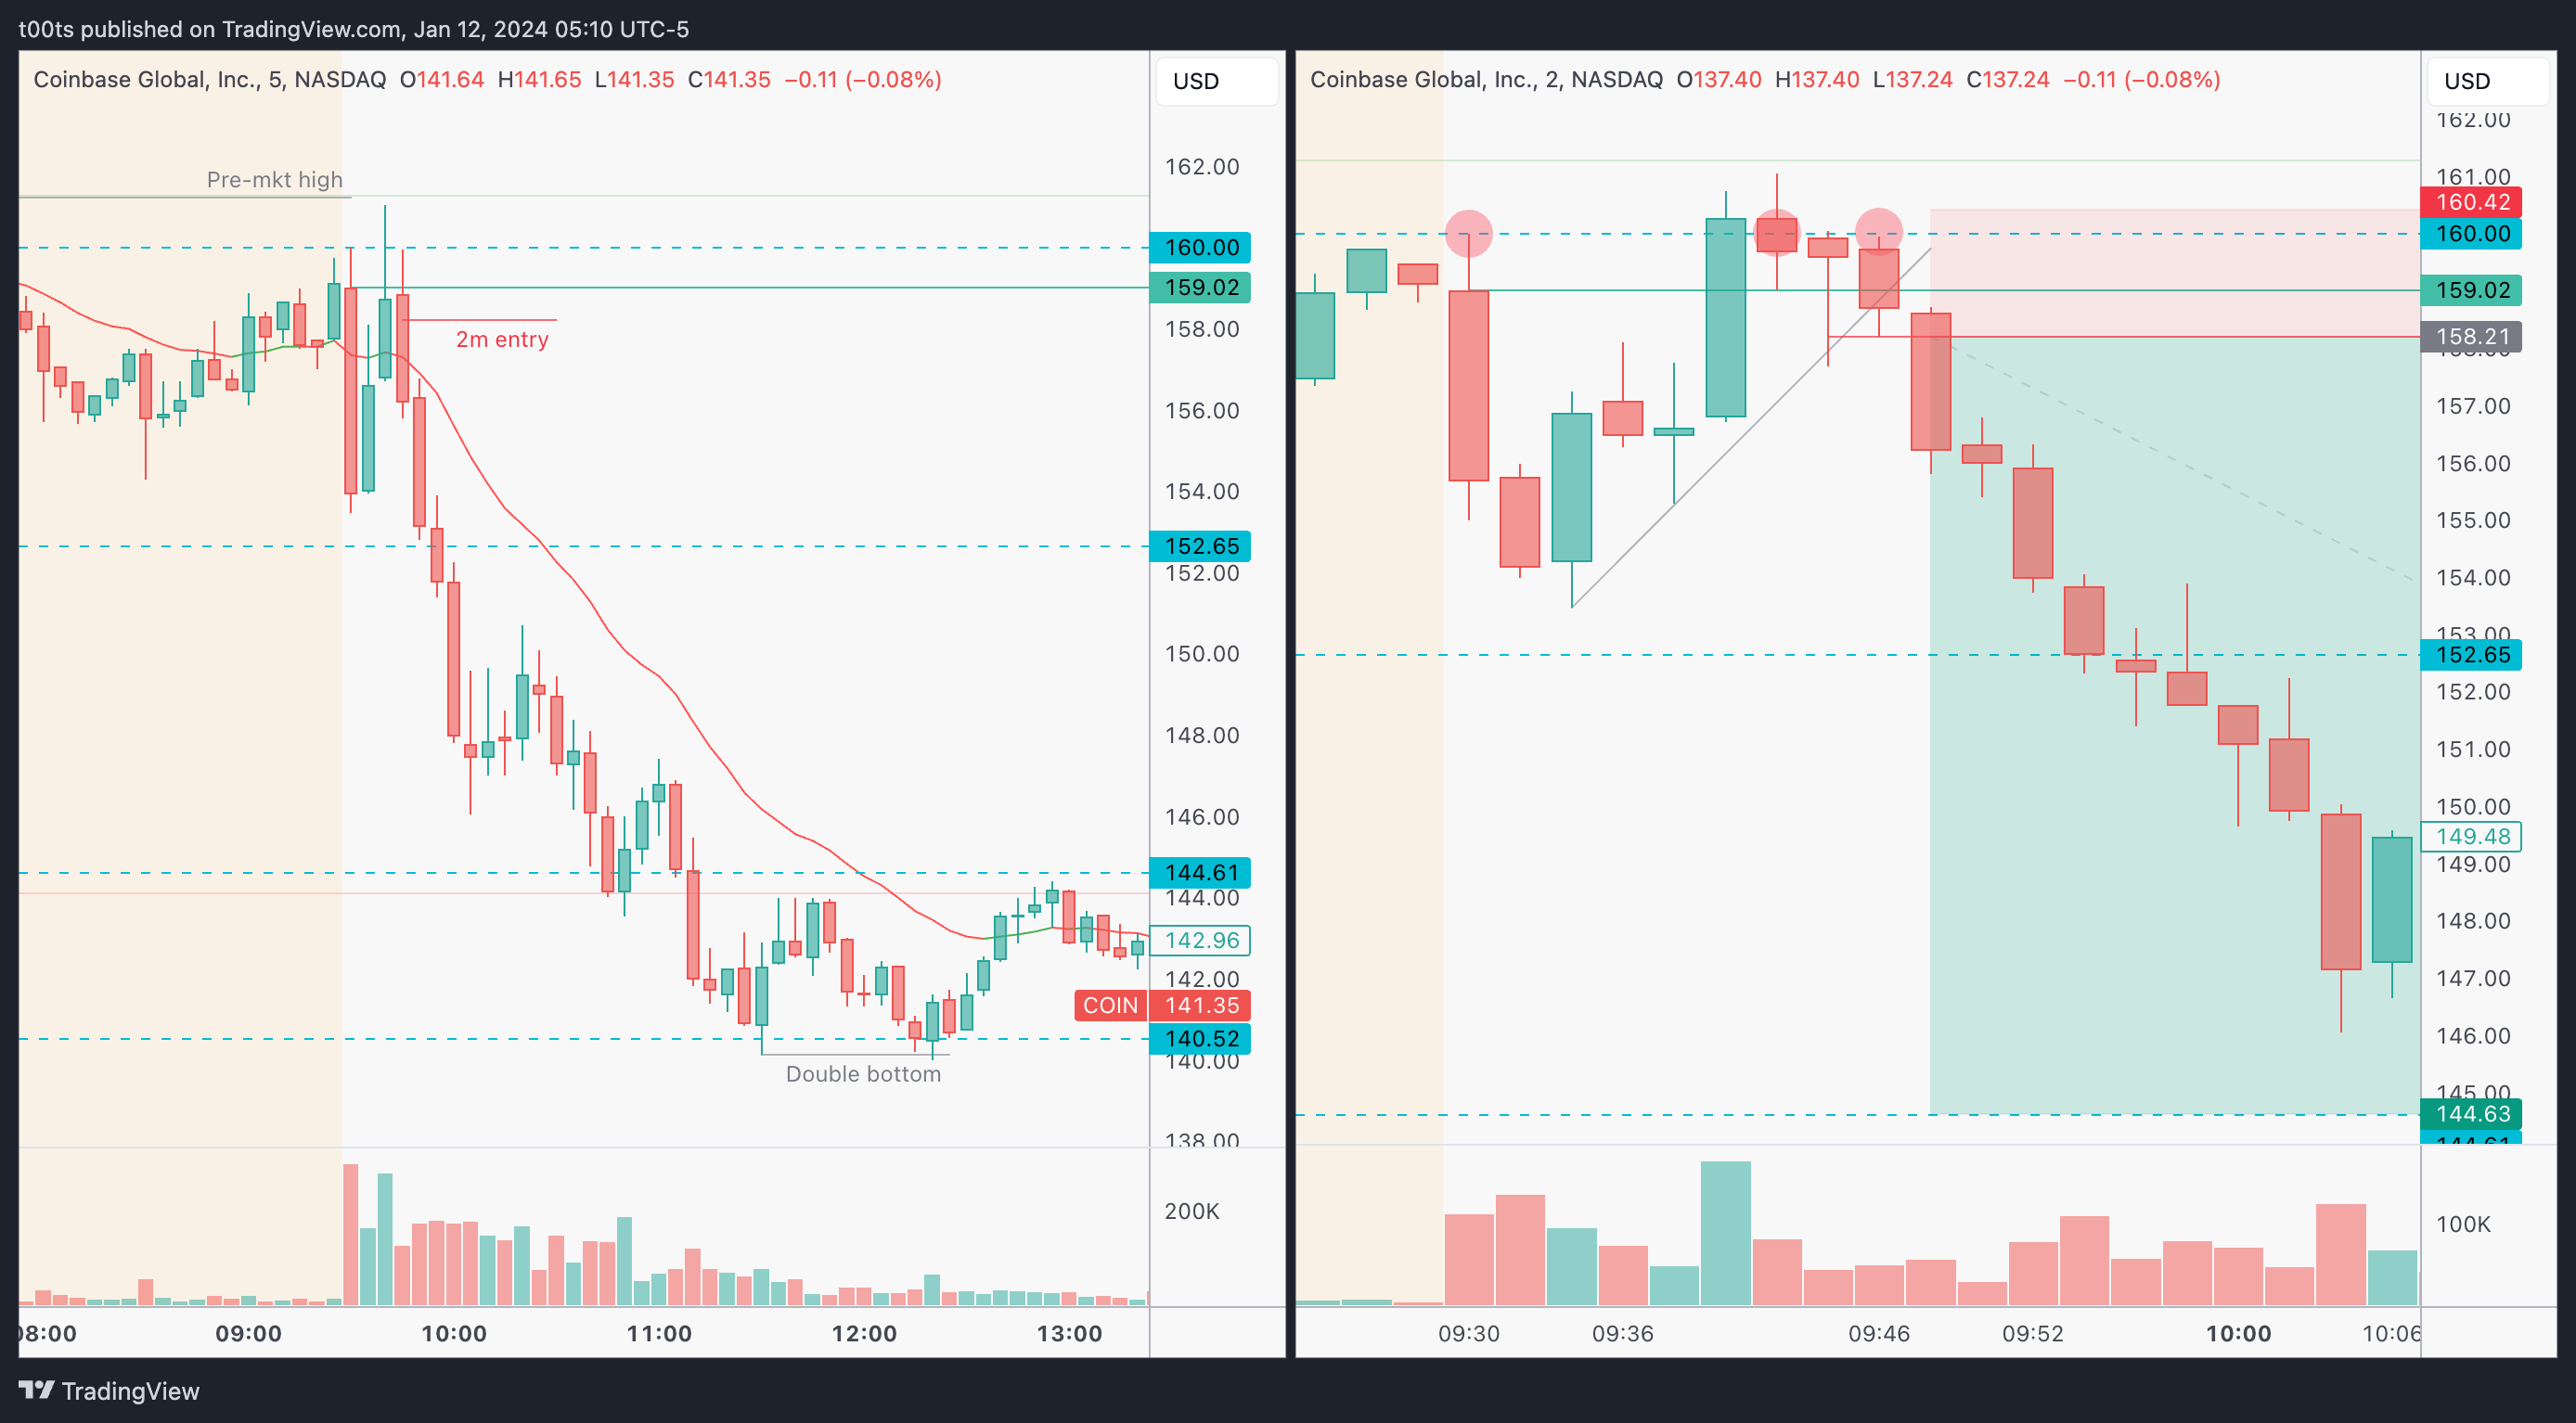
I'd like to go deeper into it for those who were actually watching and waiting for this opportunity. I always use the 2m chart when a trade is near the open. In this case, we could've increased our R multiple by getting a better entry.
The chart on the right is a 2m chart. Notice that after the 3rd rejection, we get a close below the opening print. We've seen this enough times by now. One could get an entry right below that bar, risking against the opening print itself (too tight probably), the $160 level above, or the high of the day. All three of these entries gave better risk-to-reward opportunities than our previously outlined 5m entry, which is more systematic due to the hindsight nature of this review. I added that trendline for further visual confirmation of the breakdown.
Closing notes
“If you fail to plan, you are planning to fail” - Benjamin Franklin
Planning for these events is fundamental in your success as a trader. Sitting and watching is not enough. You absolutely have to make an effort to set up potential scenarios on paper and then see what happens. Just watching it unfold without doing the work previously won't help you learn.
I'm upset I missed this one, but I'm sure it will never happen again. Congratulations to those who caught a piece of the pie. For those who didn't, I hope this shed some light for next time.
I am posting one trade writeup every day throughout 2024. I focus on large caps using levels and price action. The subscription is absolutely free and will always be. I will strive to provide value by offering clues and ideas for you to enhance your edge. Let’s grow together!