

Higher timeframe context
Apple is the market leader by excellence, although it hasn't been getting too much attention lately as most of the action is revolving around the AI theme, where investors have been mainly targeting the semiconductor sector.
Apple is yet to make a move in the AI domain. They are usually late to a lot of these ultra-hyped technologies. They're not a company that rushes into anything, as the brand is known for flawlessly executed products that provide seamless experiences to their users. The day will certainly come where they enter this space, and when they do, they will be relevant.
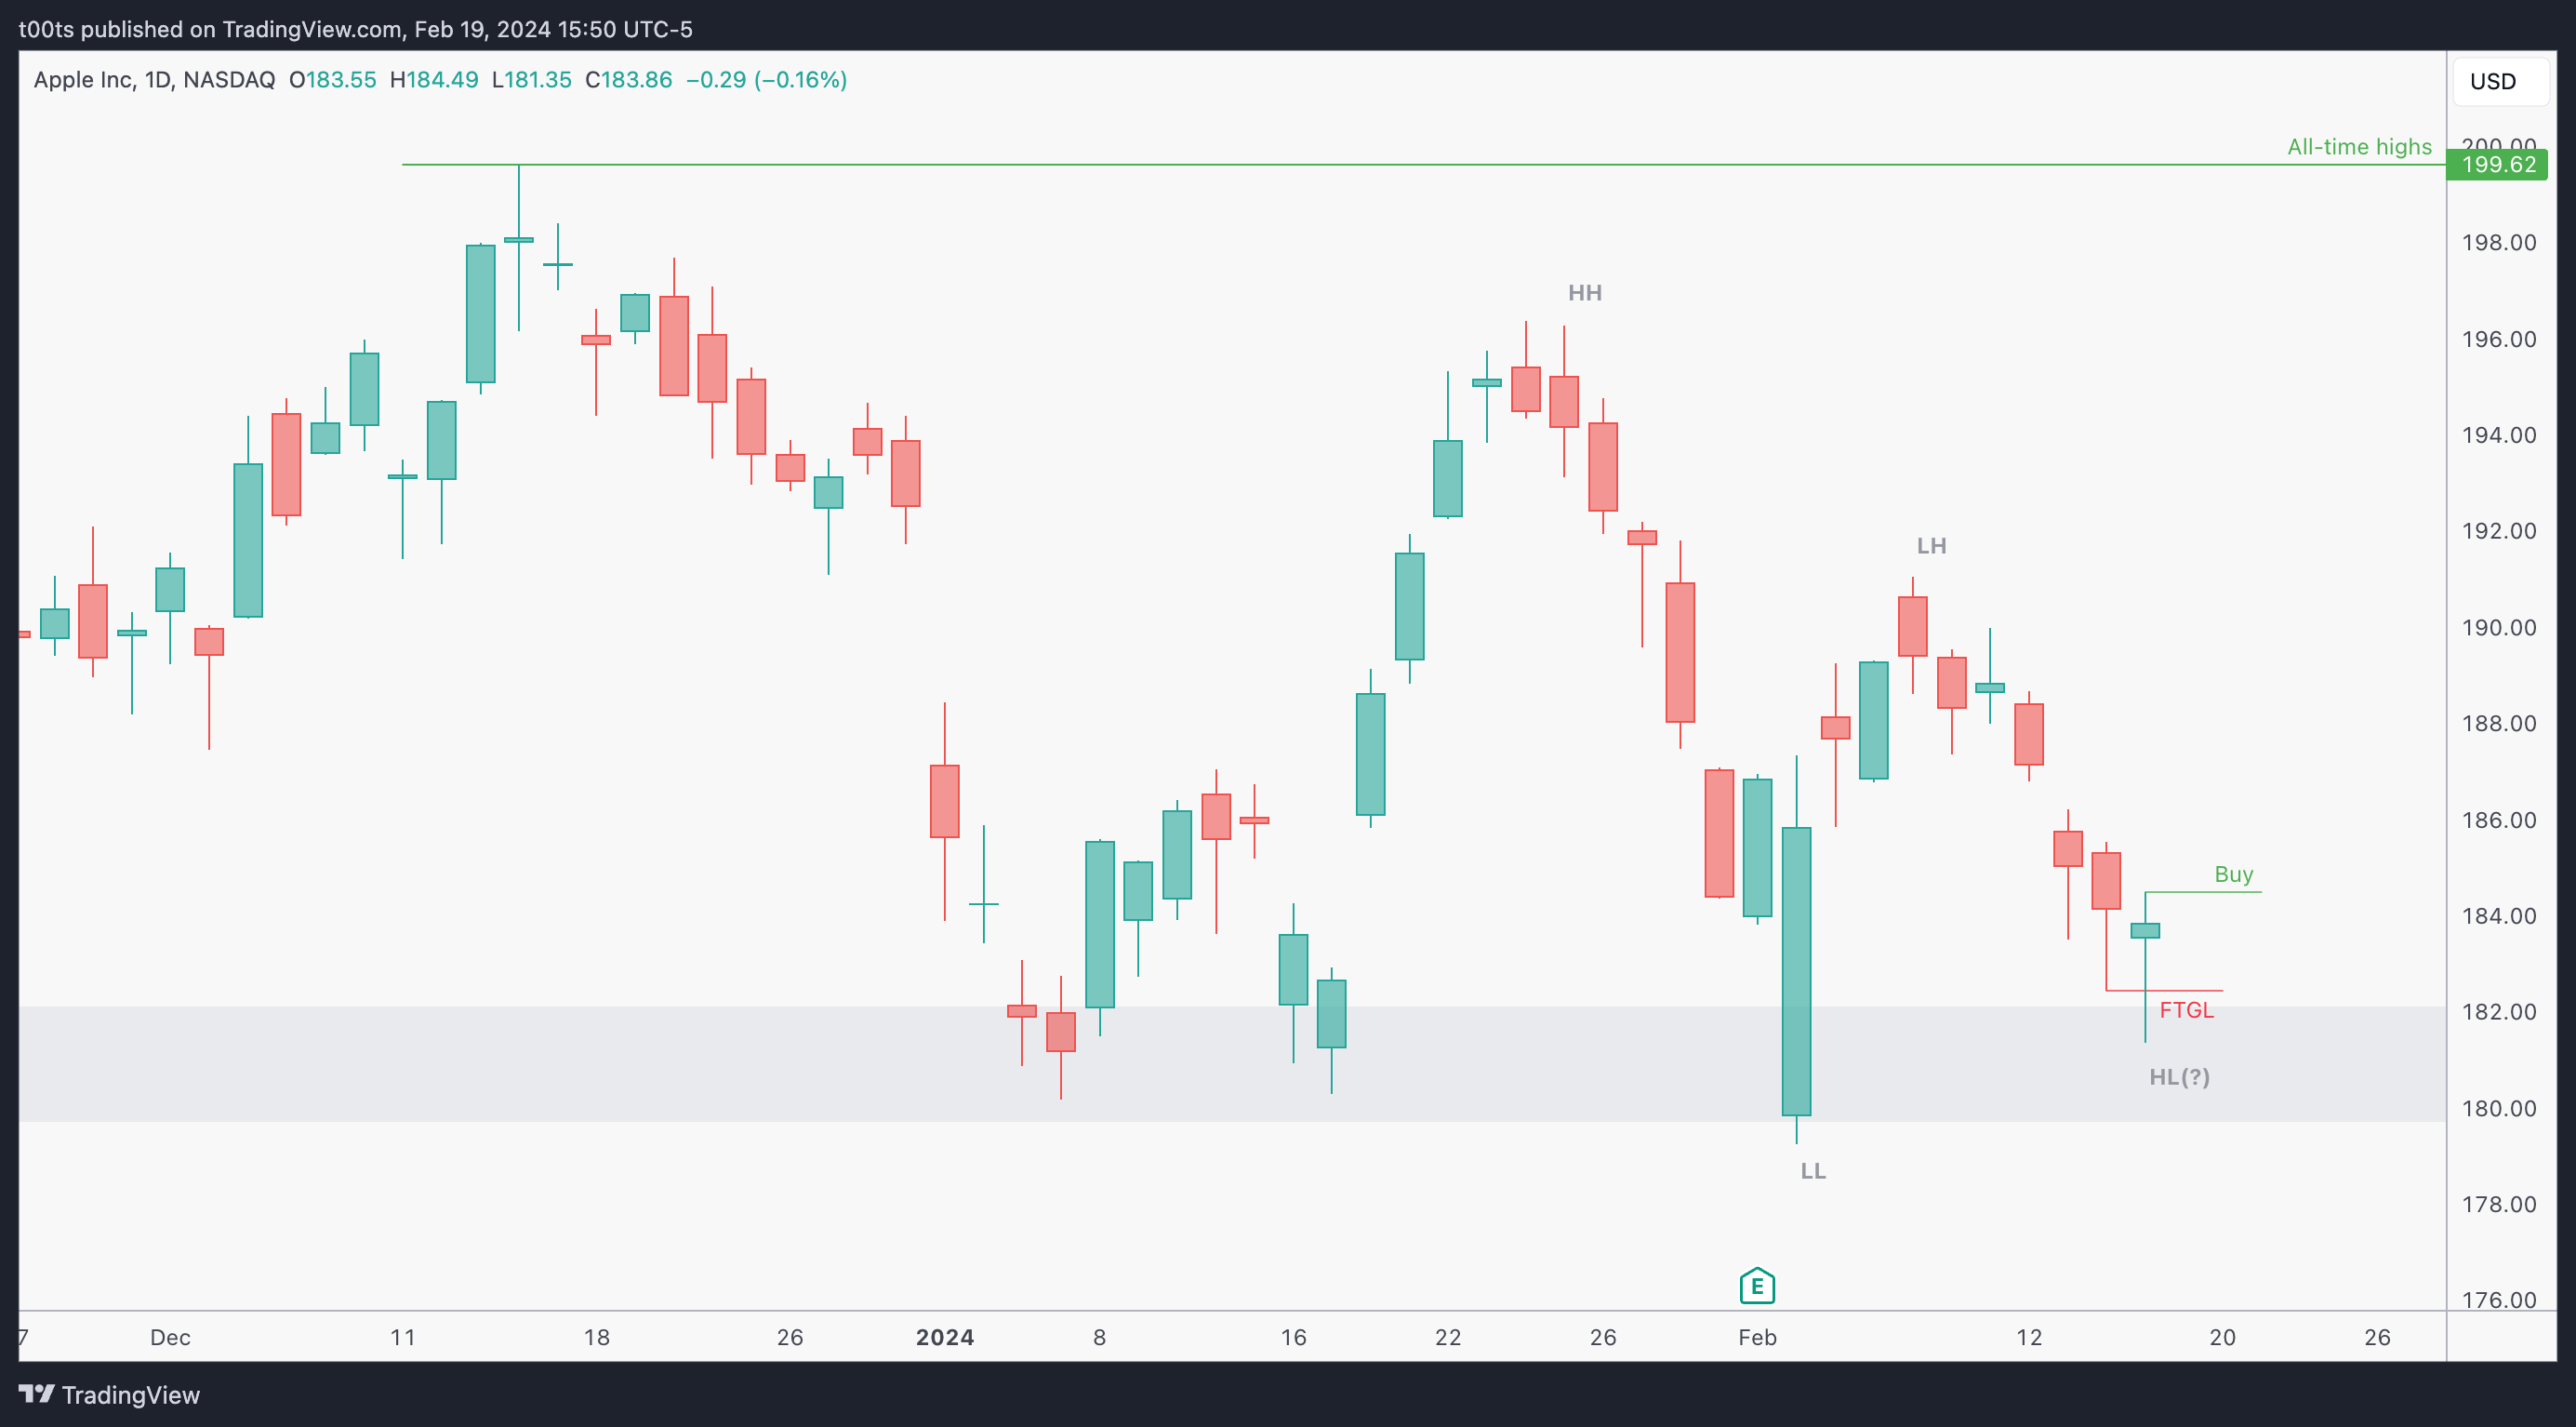
Weekly chart
As we can observe on this weekly chart, Apple stock has been consolidating for months in a 30pt range. It recently approached the psychological $200 level as it briefly made fresh all-time highs, but was rejected and price dropped all the way to the $180 area, where it found support. I've marked this area in gray as it's not only the previous all-time high from 2021, but it looks quite relevant judging by how many times price has reacted to it recently.

Daily chart
This daily chart is what brought this stock to my attention in the first place. Note how that last daily bar bounces at our $180 area and closes slightly green, leaving us with a failure to go lower and setting the stage for a potential bounce play. There's an unfilled gap above. We know these gaps act as magnets for price. So far things look interesting.
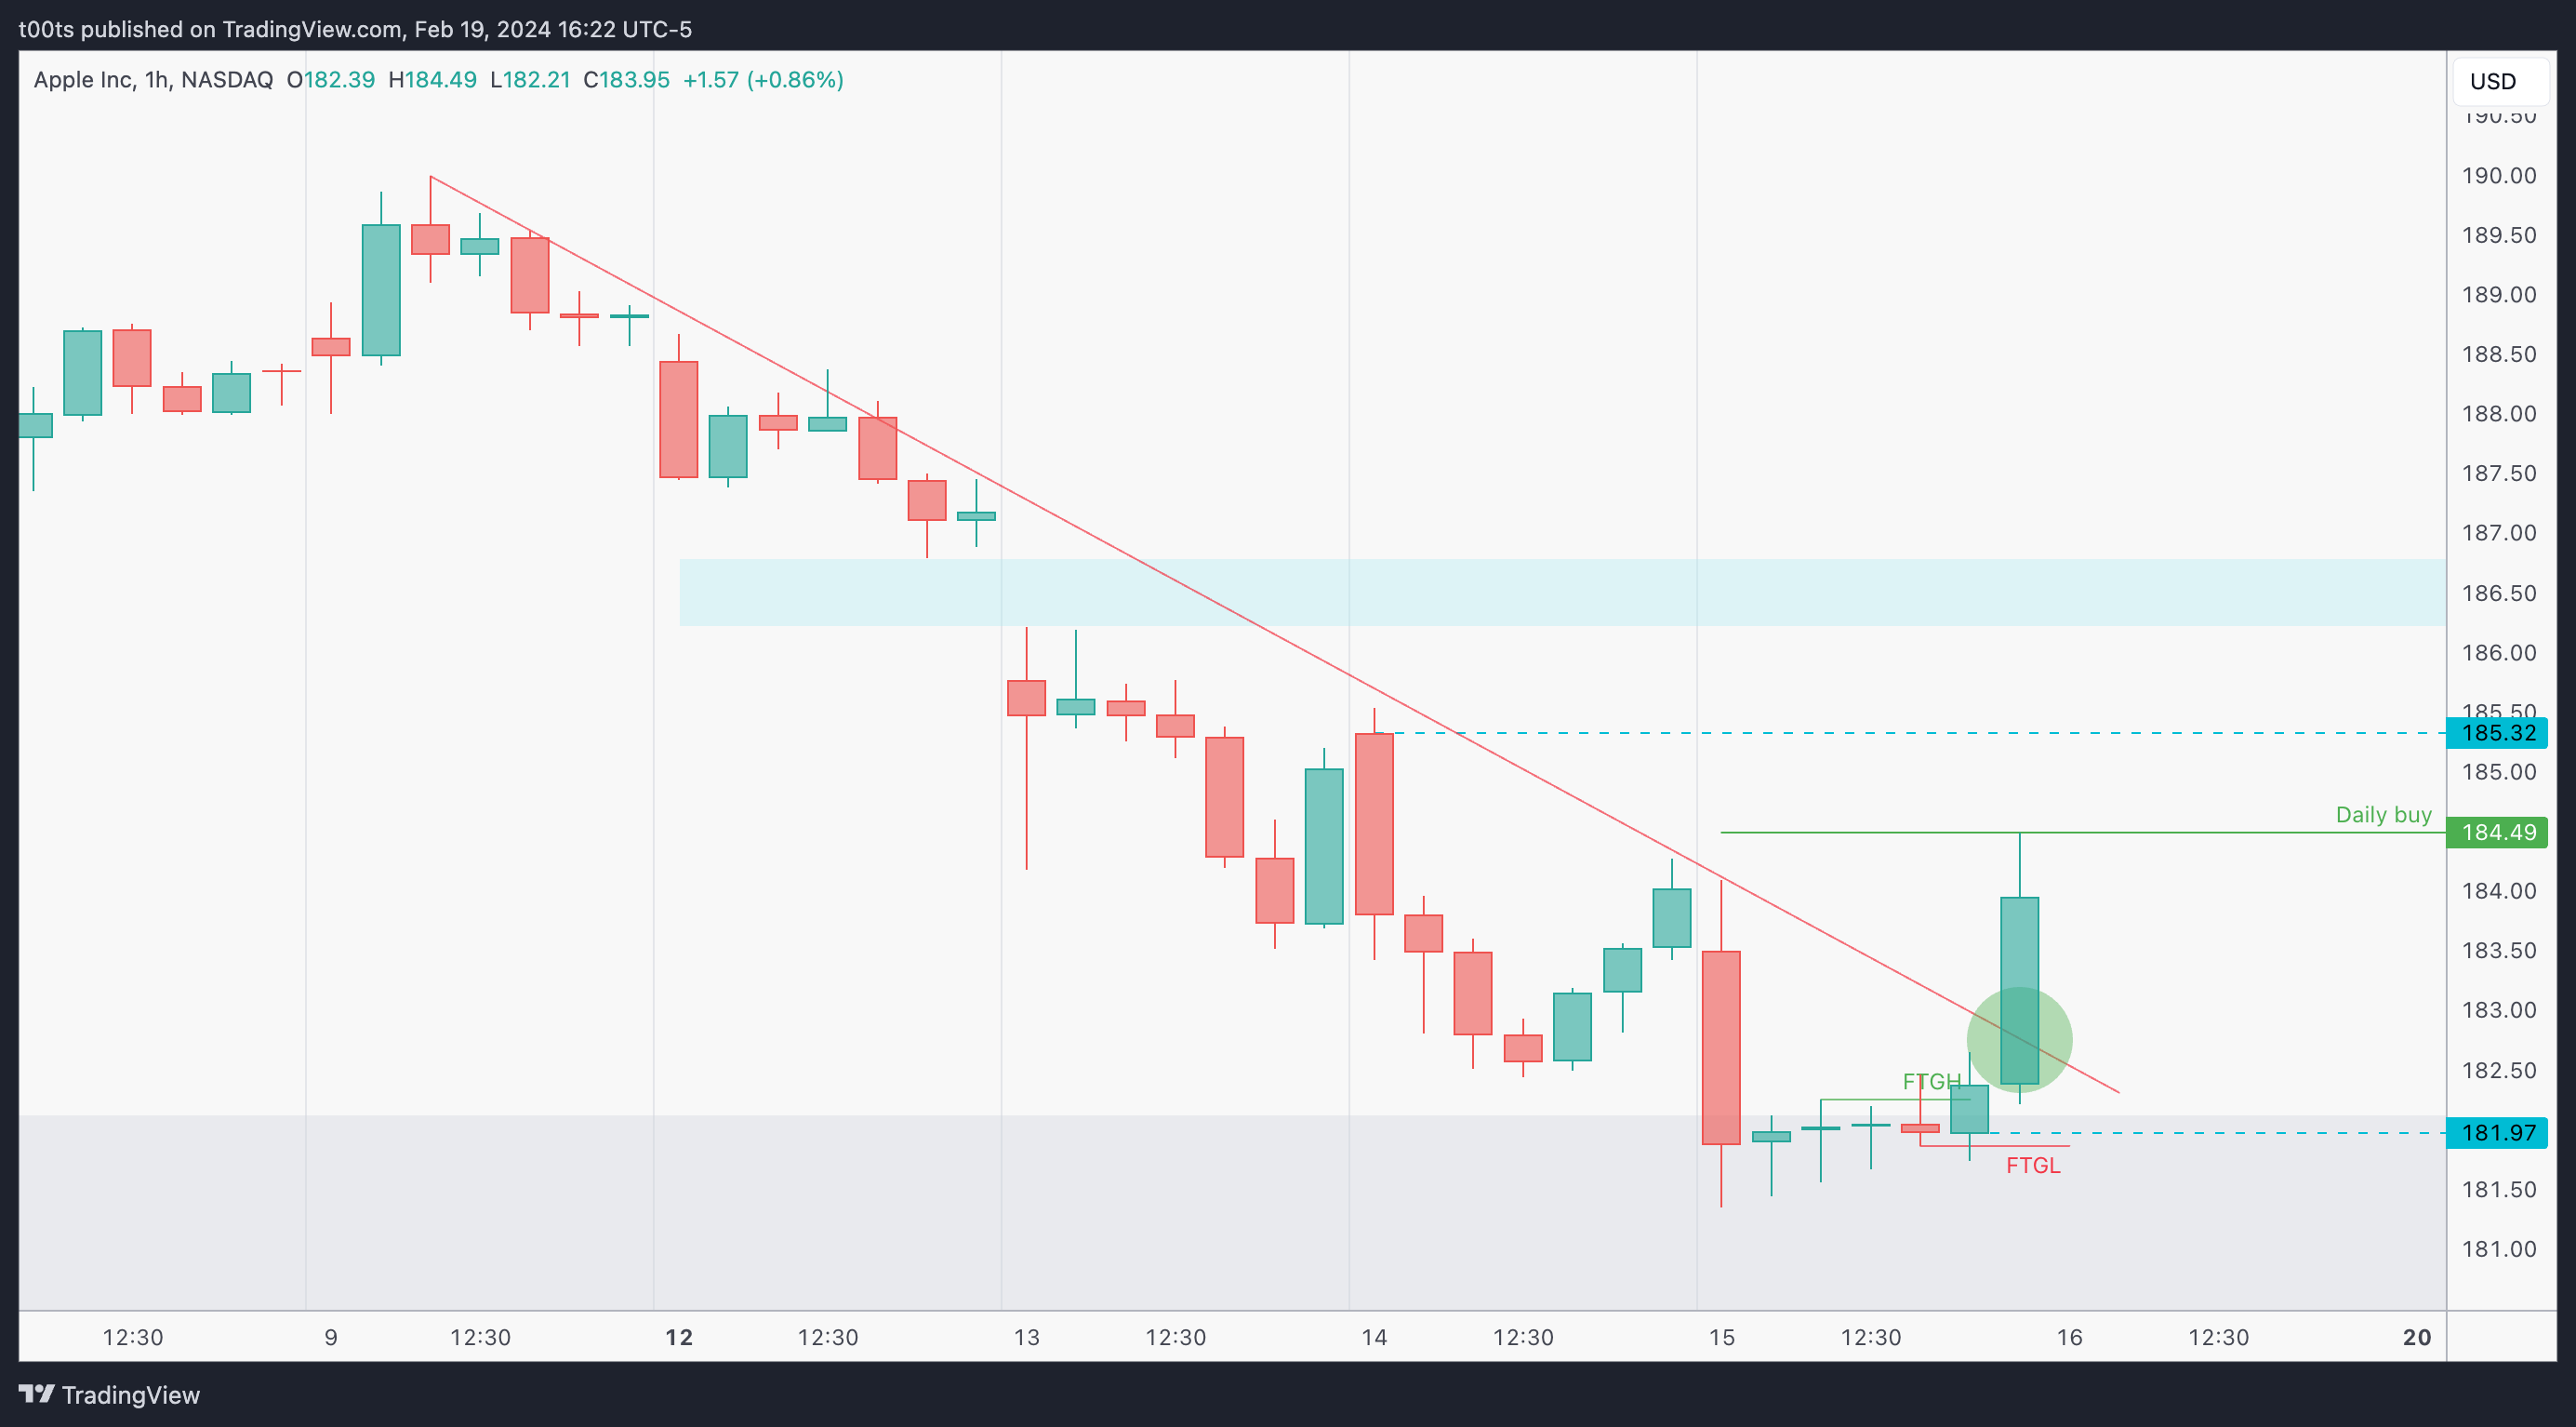
Hourly chart
There's no question this chart is in a clear downtrend. Now give that last session a thorough look for a second.
Notice how price had an impulse move down straight off the open, then [bear] flagged pretty much all day, and when everything pointed to a continuation move lower, buyers take over and create a failed failure pattern, which results in a strong push into the close.
This is a great example of why we mark these important supply and demand areas from our higher timeframes. Although we may not directly take trades off them, having that gray area in our charts may have saved us from taking that failed short.
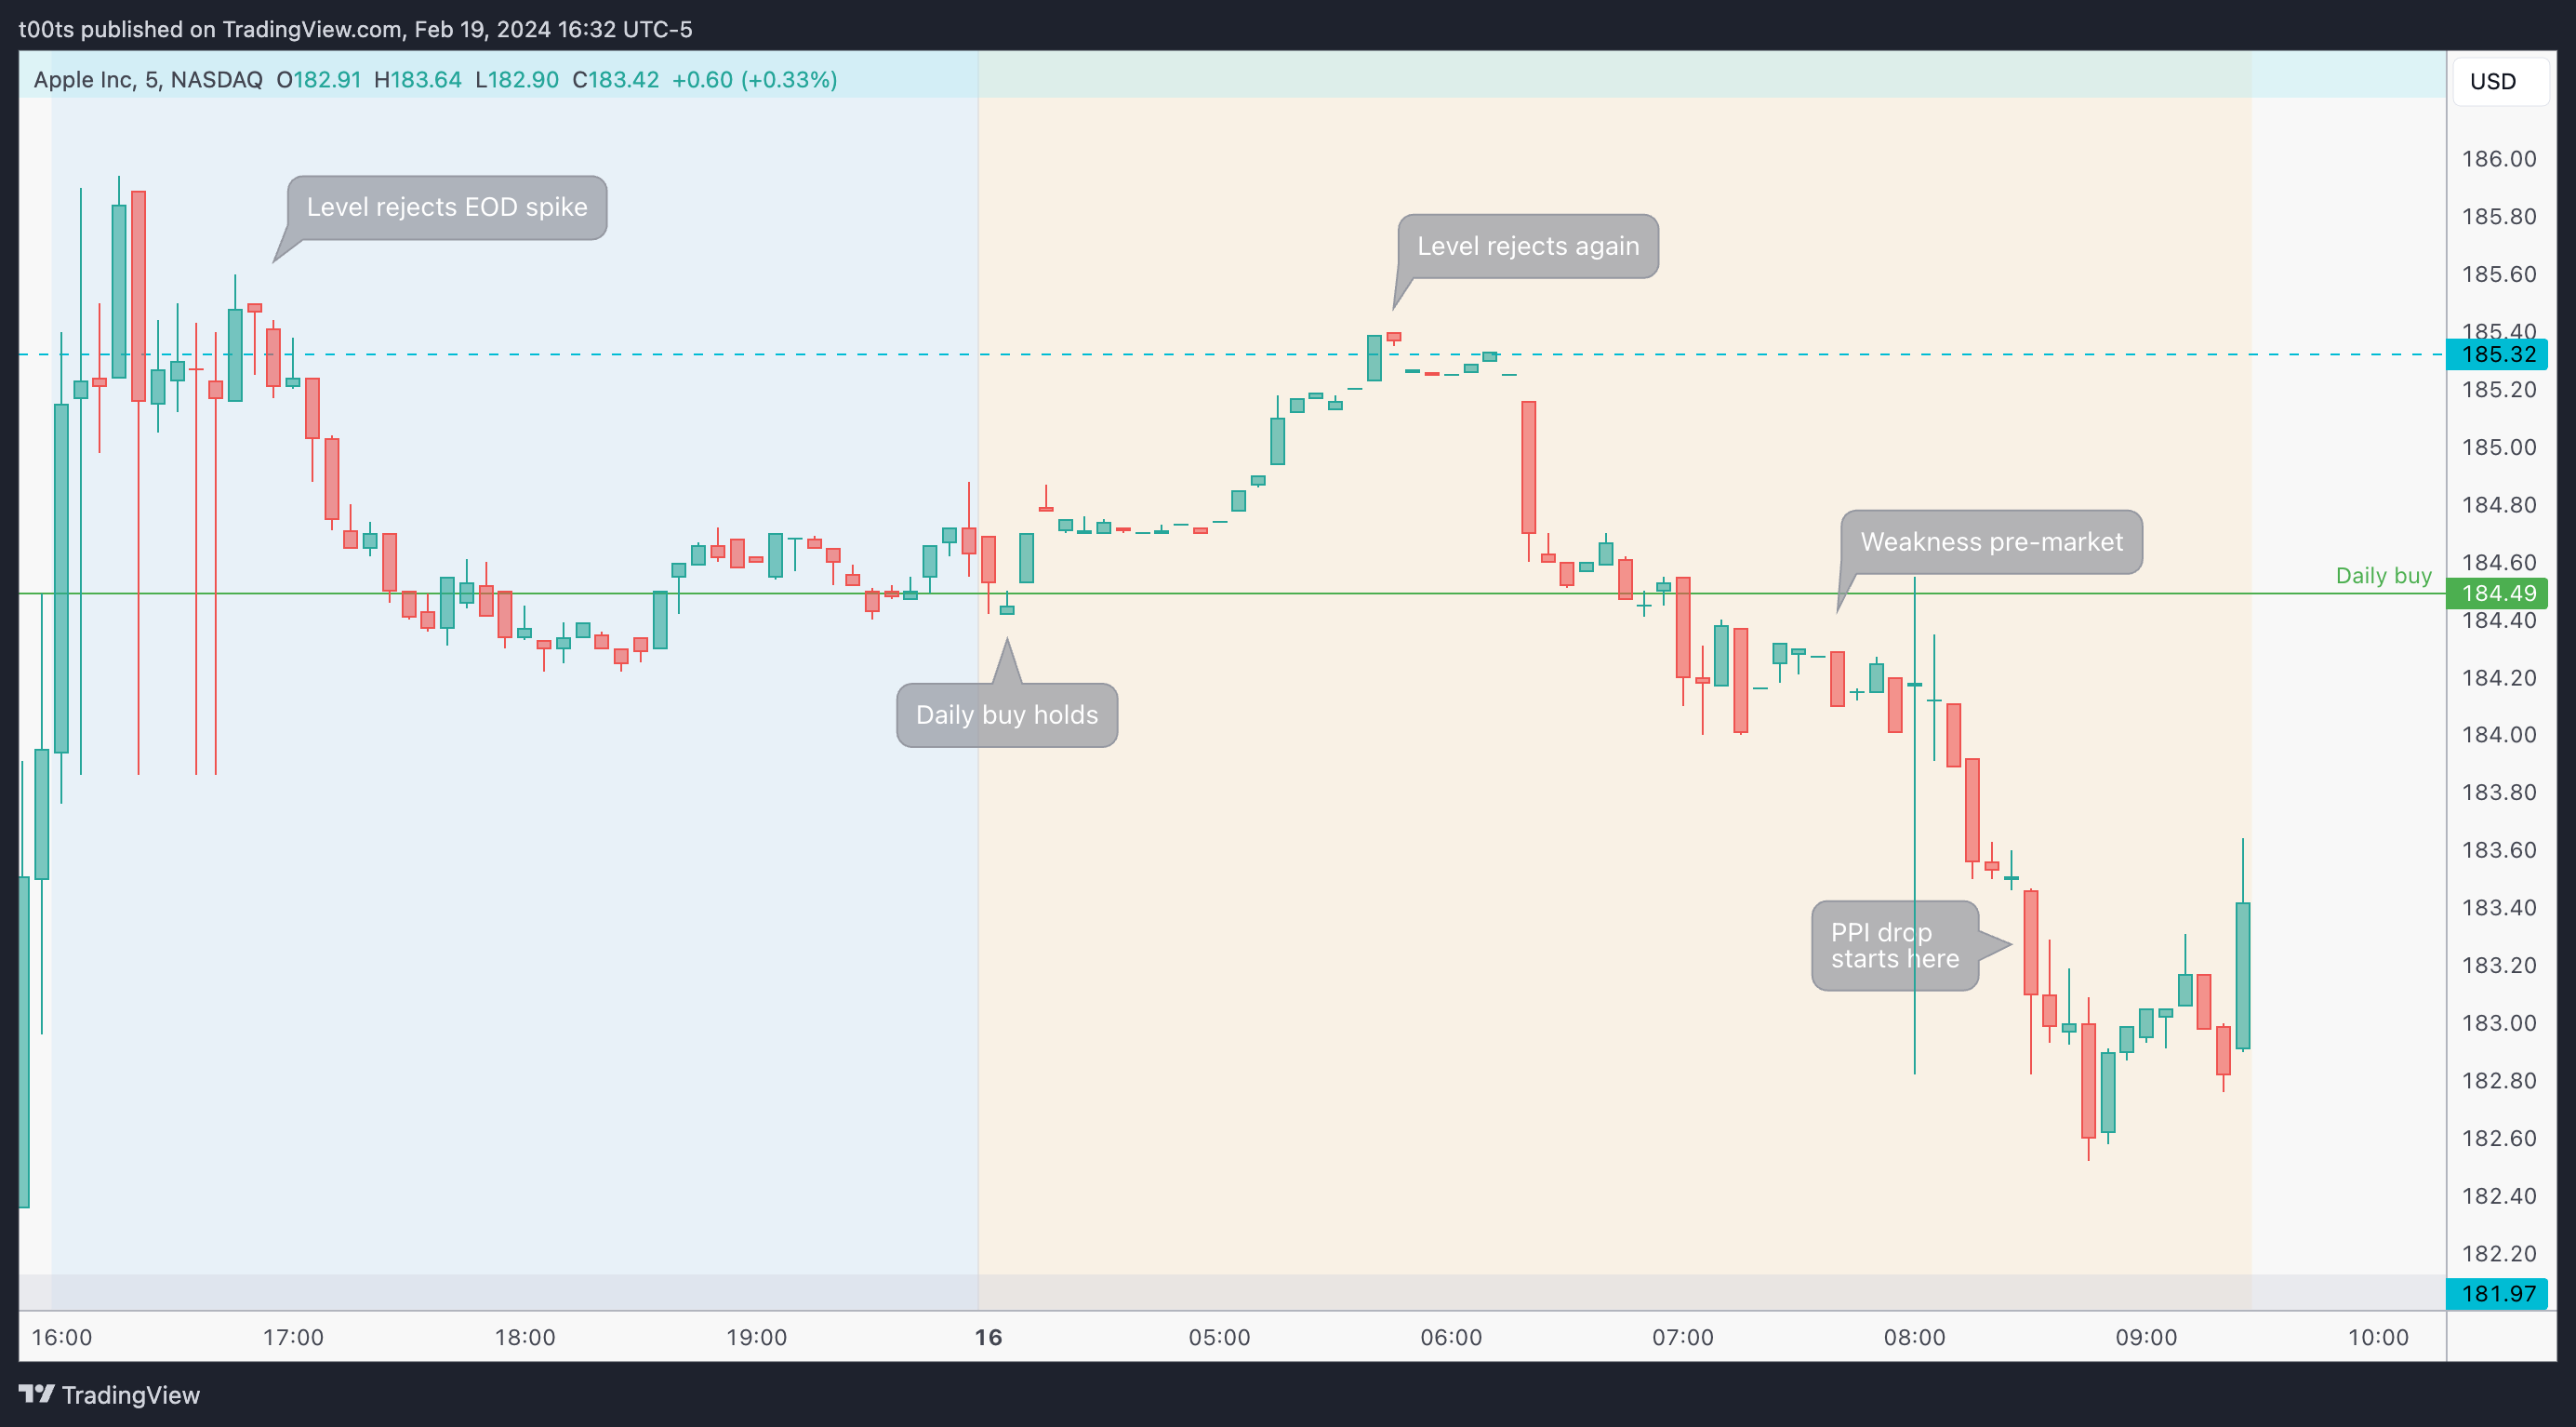
Pre-market action
This is not exactly the pre-market action we want to see if we're anticipating a bullish trend day. The weakness throughout the whole pre-market session is palpable. Notice how the stock is weak even before the overall PPI drop. The $185.32 level rejected the after-hours spike on the previous day and rejects again during the pre-market. Very little enthusiasm from buyers so far, we'll have to be careful on this one.
The trade
Our trade is essentially based on the stock bouncing off the $180 demand area. We're expecting the daily buy setup to trigger and hopefully a nice intraday trend that leaves us with a solid bullish trend bar. This means we're interested in entries above the daily buy trigger at $184.50s (corresponding to prev. day highs).
Here's what our CPT would look like:
Cue(s)
Stock bouncing near the lower bound of the weekly range
Recent daily candles have lower wicks showcasing buying
Clear bullish reaction at a strong demand area
Price potentially putting in a higher low
Intraday cue: Notable weakness throughout the pre-market
Intraday cue: Daily buy fails aggressively leaving longs trapped
Intraday cue: 3-bar play sets up a potential 4.5R trade
Plan
Once again, this pre-market action is not really convincing. So we want to see a strong break of the daily buy trigger and -only then- find intraday higher lows to trade off of. Ideally risking that daily buy, or if we get a strong open maybe use the $185.32.
Trigger
Intraday higher low after breaking the daily buy.
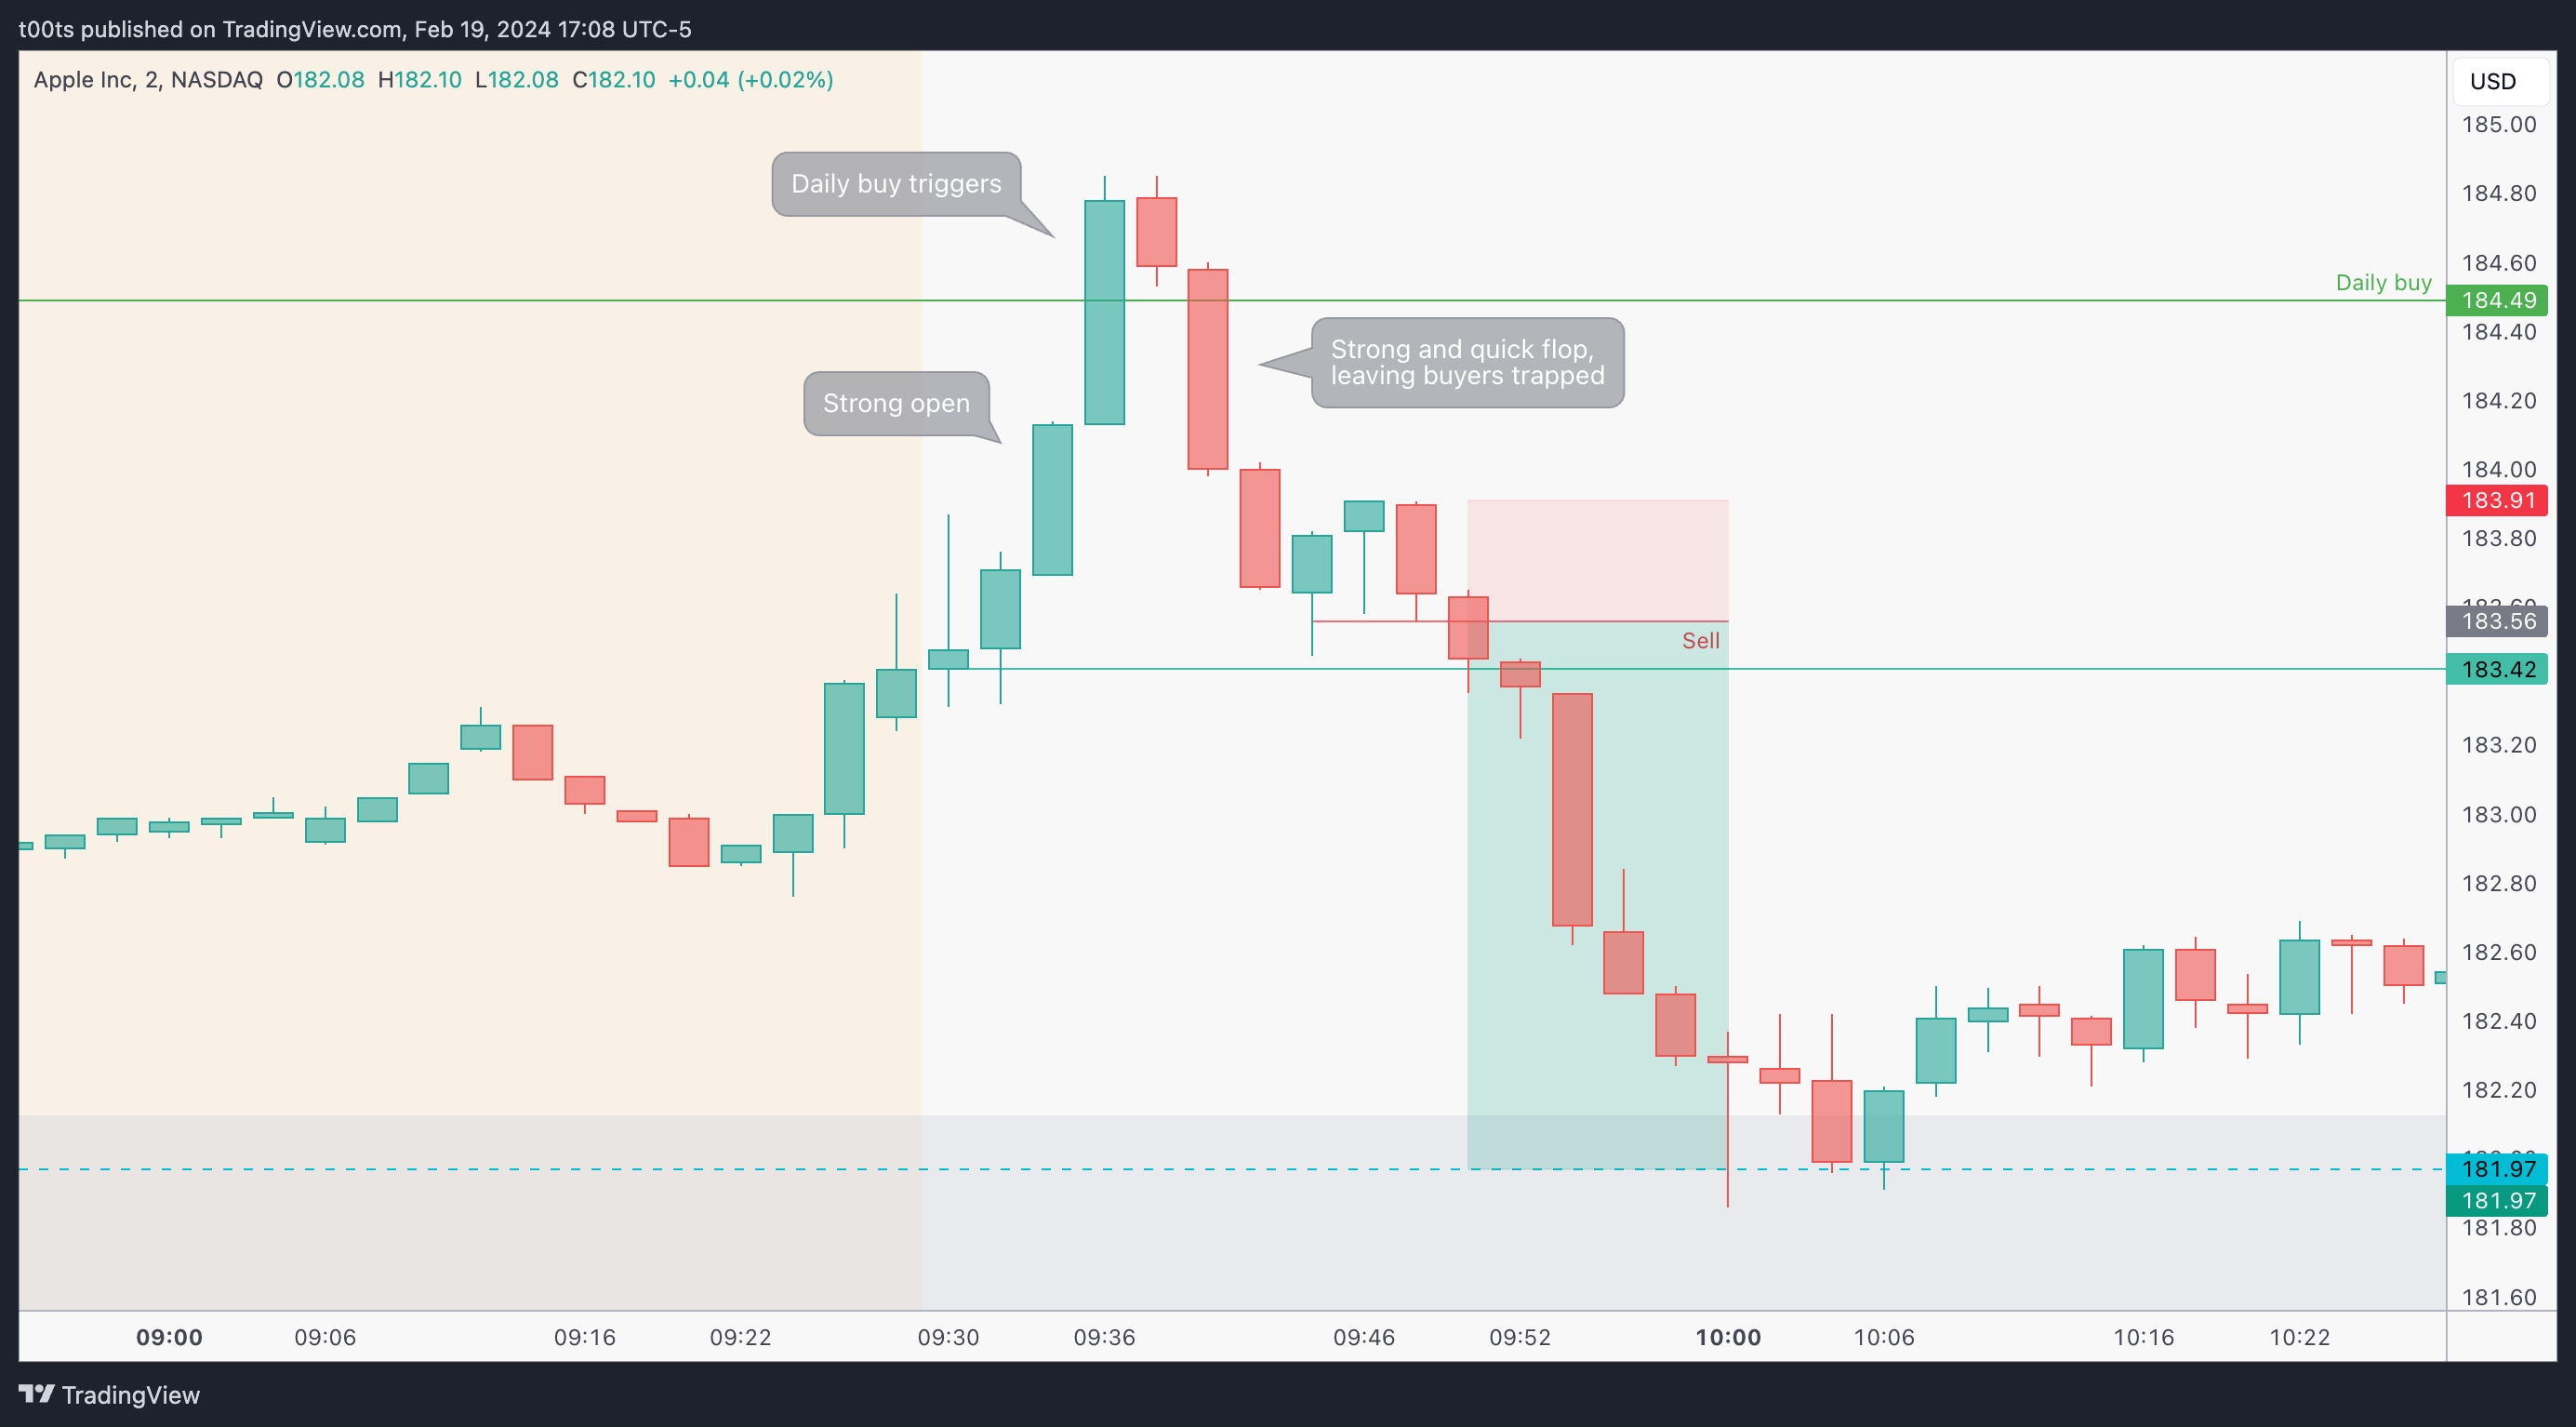
5m chart
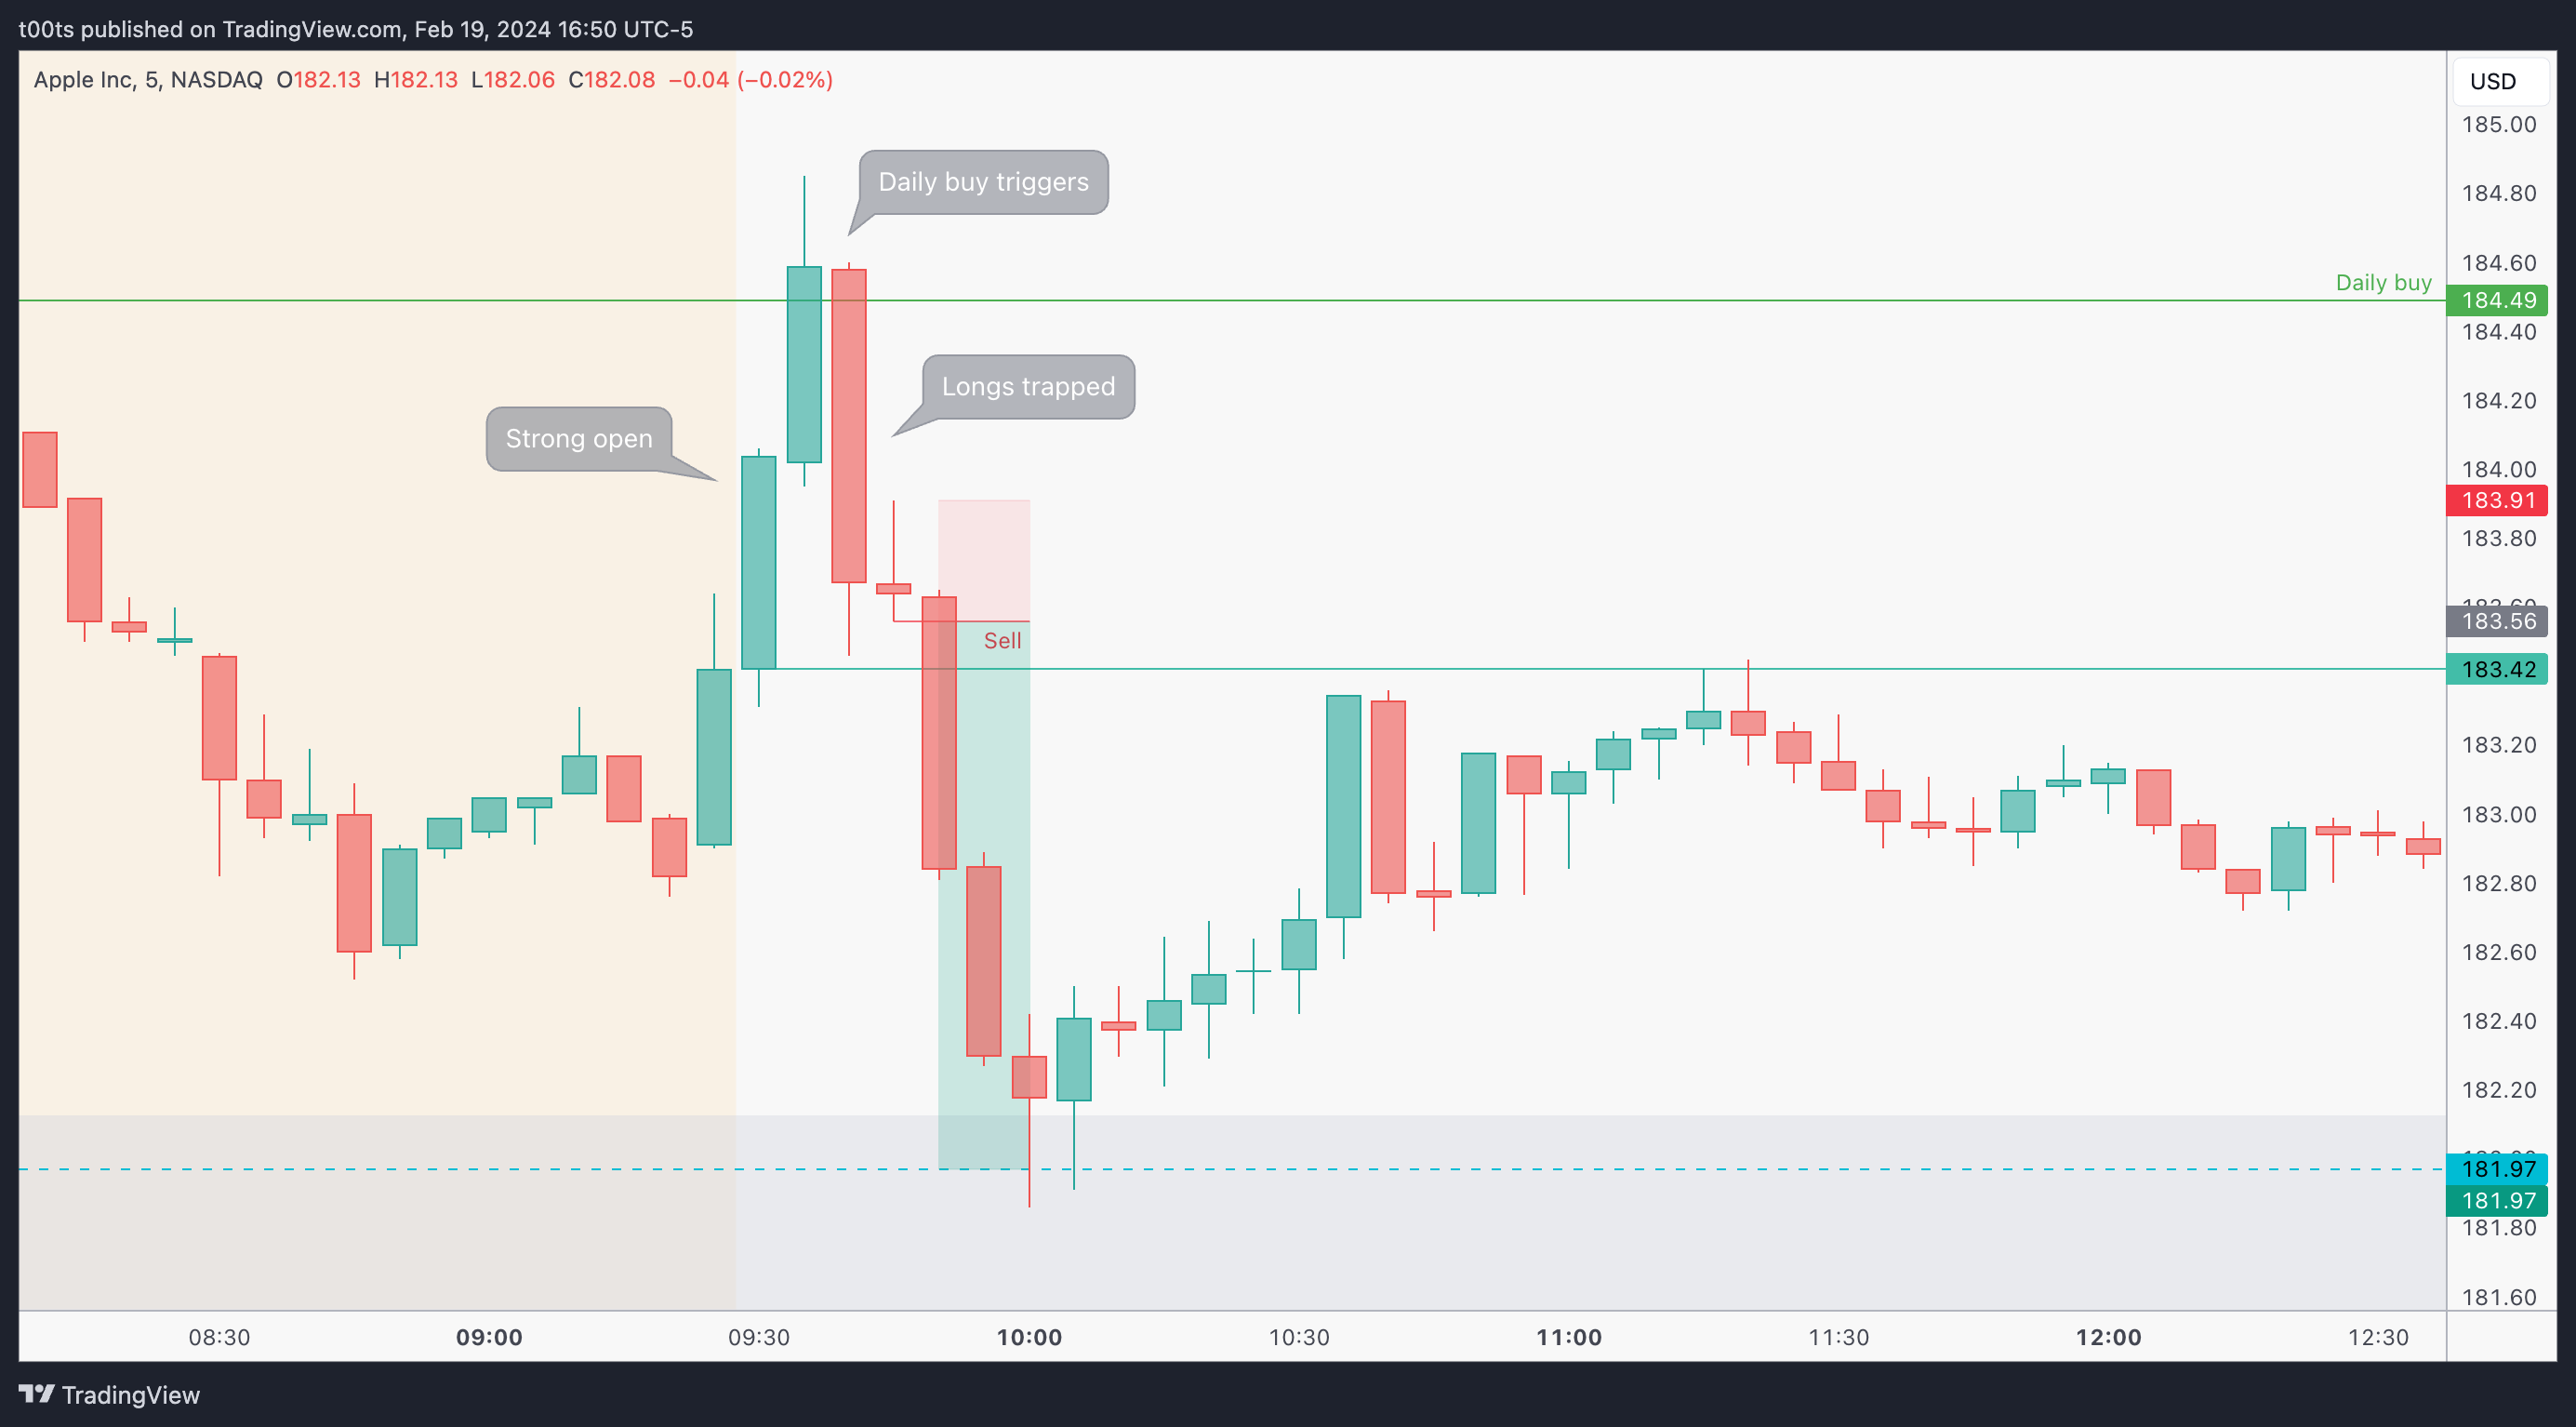
Stock opens up strong and price heads straight up to trigger that daily buy. We never get a reason for entry as price does a 180º turn and pulls back aggressively leaving breakout traders trapped.
We really liked that daily chart with that bullish hammer setting up a potential bounce off the $180 demand area, but remember we were also concerned about the overall weakness in price throughout the pre-market. Now, this strong rejection after triggering the daily buy tells us a story that we don't want to hear. This is not a slight pullback. That bearish 5m bar completely broke down previous bar lows and changes the picture.
We know longs are trapped, but there's nothing to do until that next bar forms. That next bar is a bearish inside bar that sets up a 3-bar play to the downside. While we're still above the opening print, longs are still trapped (judging by this small inside bar), and if price were to trade back down to our demand area and tag the $181.97 level, we're looking at a +4.5R trade.
The 3-bar play setup triggers and the trade works immediately in our favor as the market is starting to pull back due to the SMCI drop. This doesn't benefit all the trapped longs, who are forced to get out further fuelling the drop, leaving us in a very comfortable position all the way to our target. Notice that we're not interested in holding past the level as we're essentially at the demand area we've been talking about, thus a bounce is expected.
2m chart
Leaving a 2 minute chart for reference. Notice how quickly that failure happened. That's what we want to see any time we talk about trapped traders. When it's so aggressive and so quick, some of those longs haven't had the chance to exit yet, they're still considering what to do. The bounce near the opening print is weakand sets up the lower high that will lead to our profitable short trade.
Closing notes
Being able to flip sides quickly is an underrated skill. A lot of traders have their long plan, just as we outlined ours, and when it doesn't trigger they'll just sit there or find another stock and force a trade just to feel productive. This is essentially what happened to me on this NVDA trade. Although I didn't force anything, I got distracted by another stock instead of remaining focused on my main watch.
If you've planned and studied a stock well, stick with it. You're way more likely to understand participant positioning and psychology. This becomes especially interesting when what you've planned for does not happen, as you're more prepared to make quicker decisions and potentially profit off the failure itself.
I am posting one trade writeup every day throughout 2024. I focus on large caps using levels and price action. The subscription is absolutely free and will always be. I will strive to provide value by offering clues and ideas for you to enhance your edge. Let’s grow together!