

Higher timeframe context
While there's not much going on this chart, it has been giving some solid intraday opportunities in the past couple months. Stock is still slightly below its IPO price, but as day traders that won't prevent us from finding potentially profitable setups and trading them. This is an example of a recent profitable setup that, in my opinion, was worth a shot.
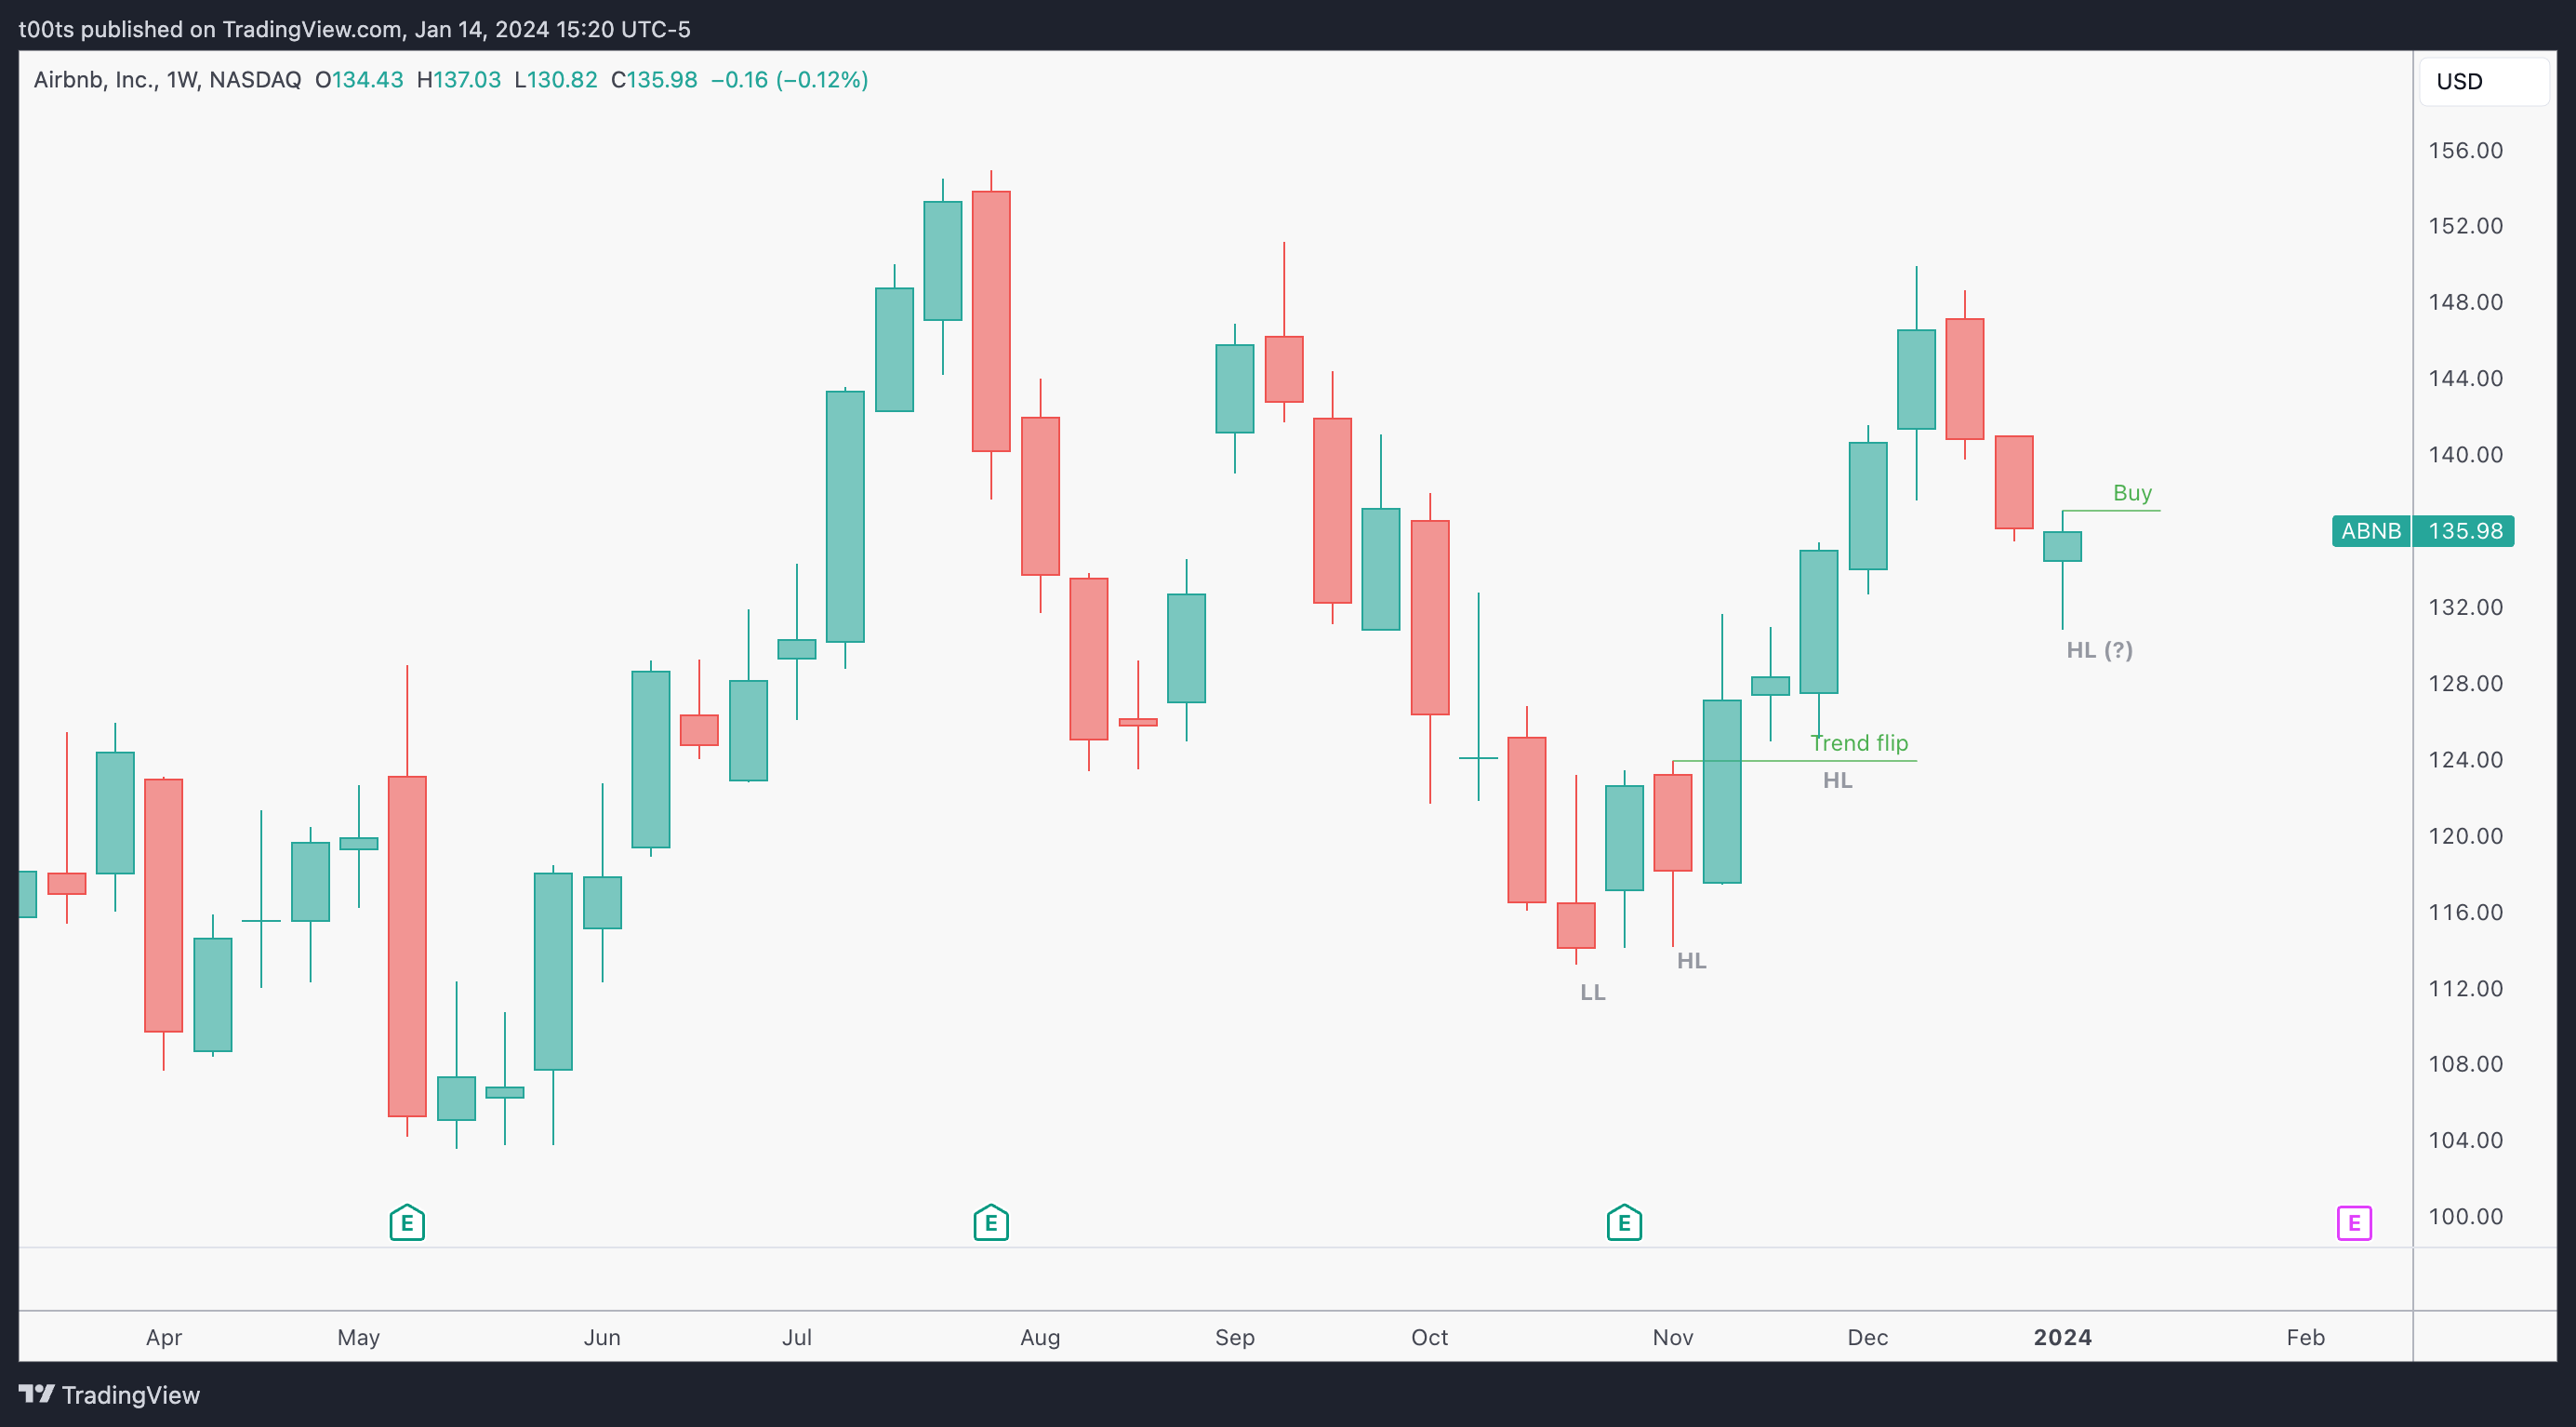
Weekly chart
The last bar of this weekly chart is what caught my attention and made this stock a top watch going into Monday.
Back in November 2023 the short-term downtrend flipped into an uptrend, and now, by the looks of this chart, there's a chance price may have put in a higher low, paving the way for a continuation move higher. The bar itself looks great. It's has almost every element of a textbook bullish reversal bar:
An open near or below the close of the prior bar and green close
A lower tail that is about one-third to one-half the height of the bar and a small or nonexistent upper tail
Not much overlap with the prior bar or bars
If price trades above this weekly bar's highs, there's a good chance we trade higher.
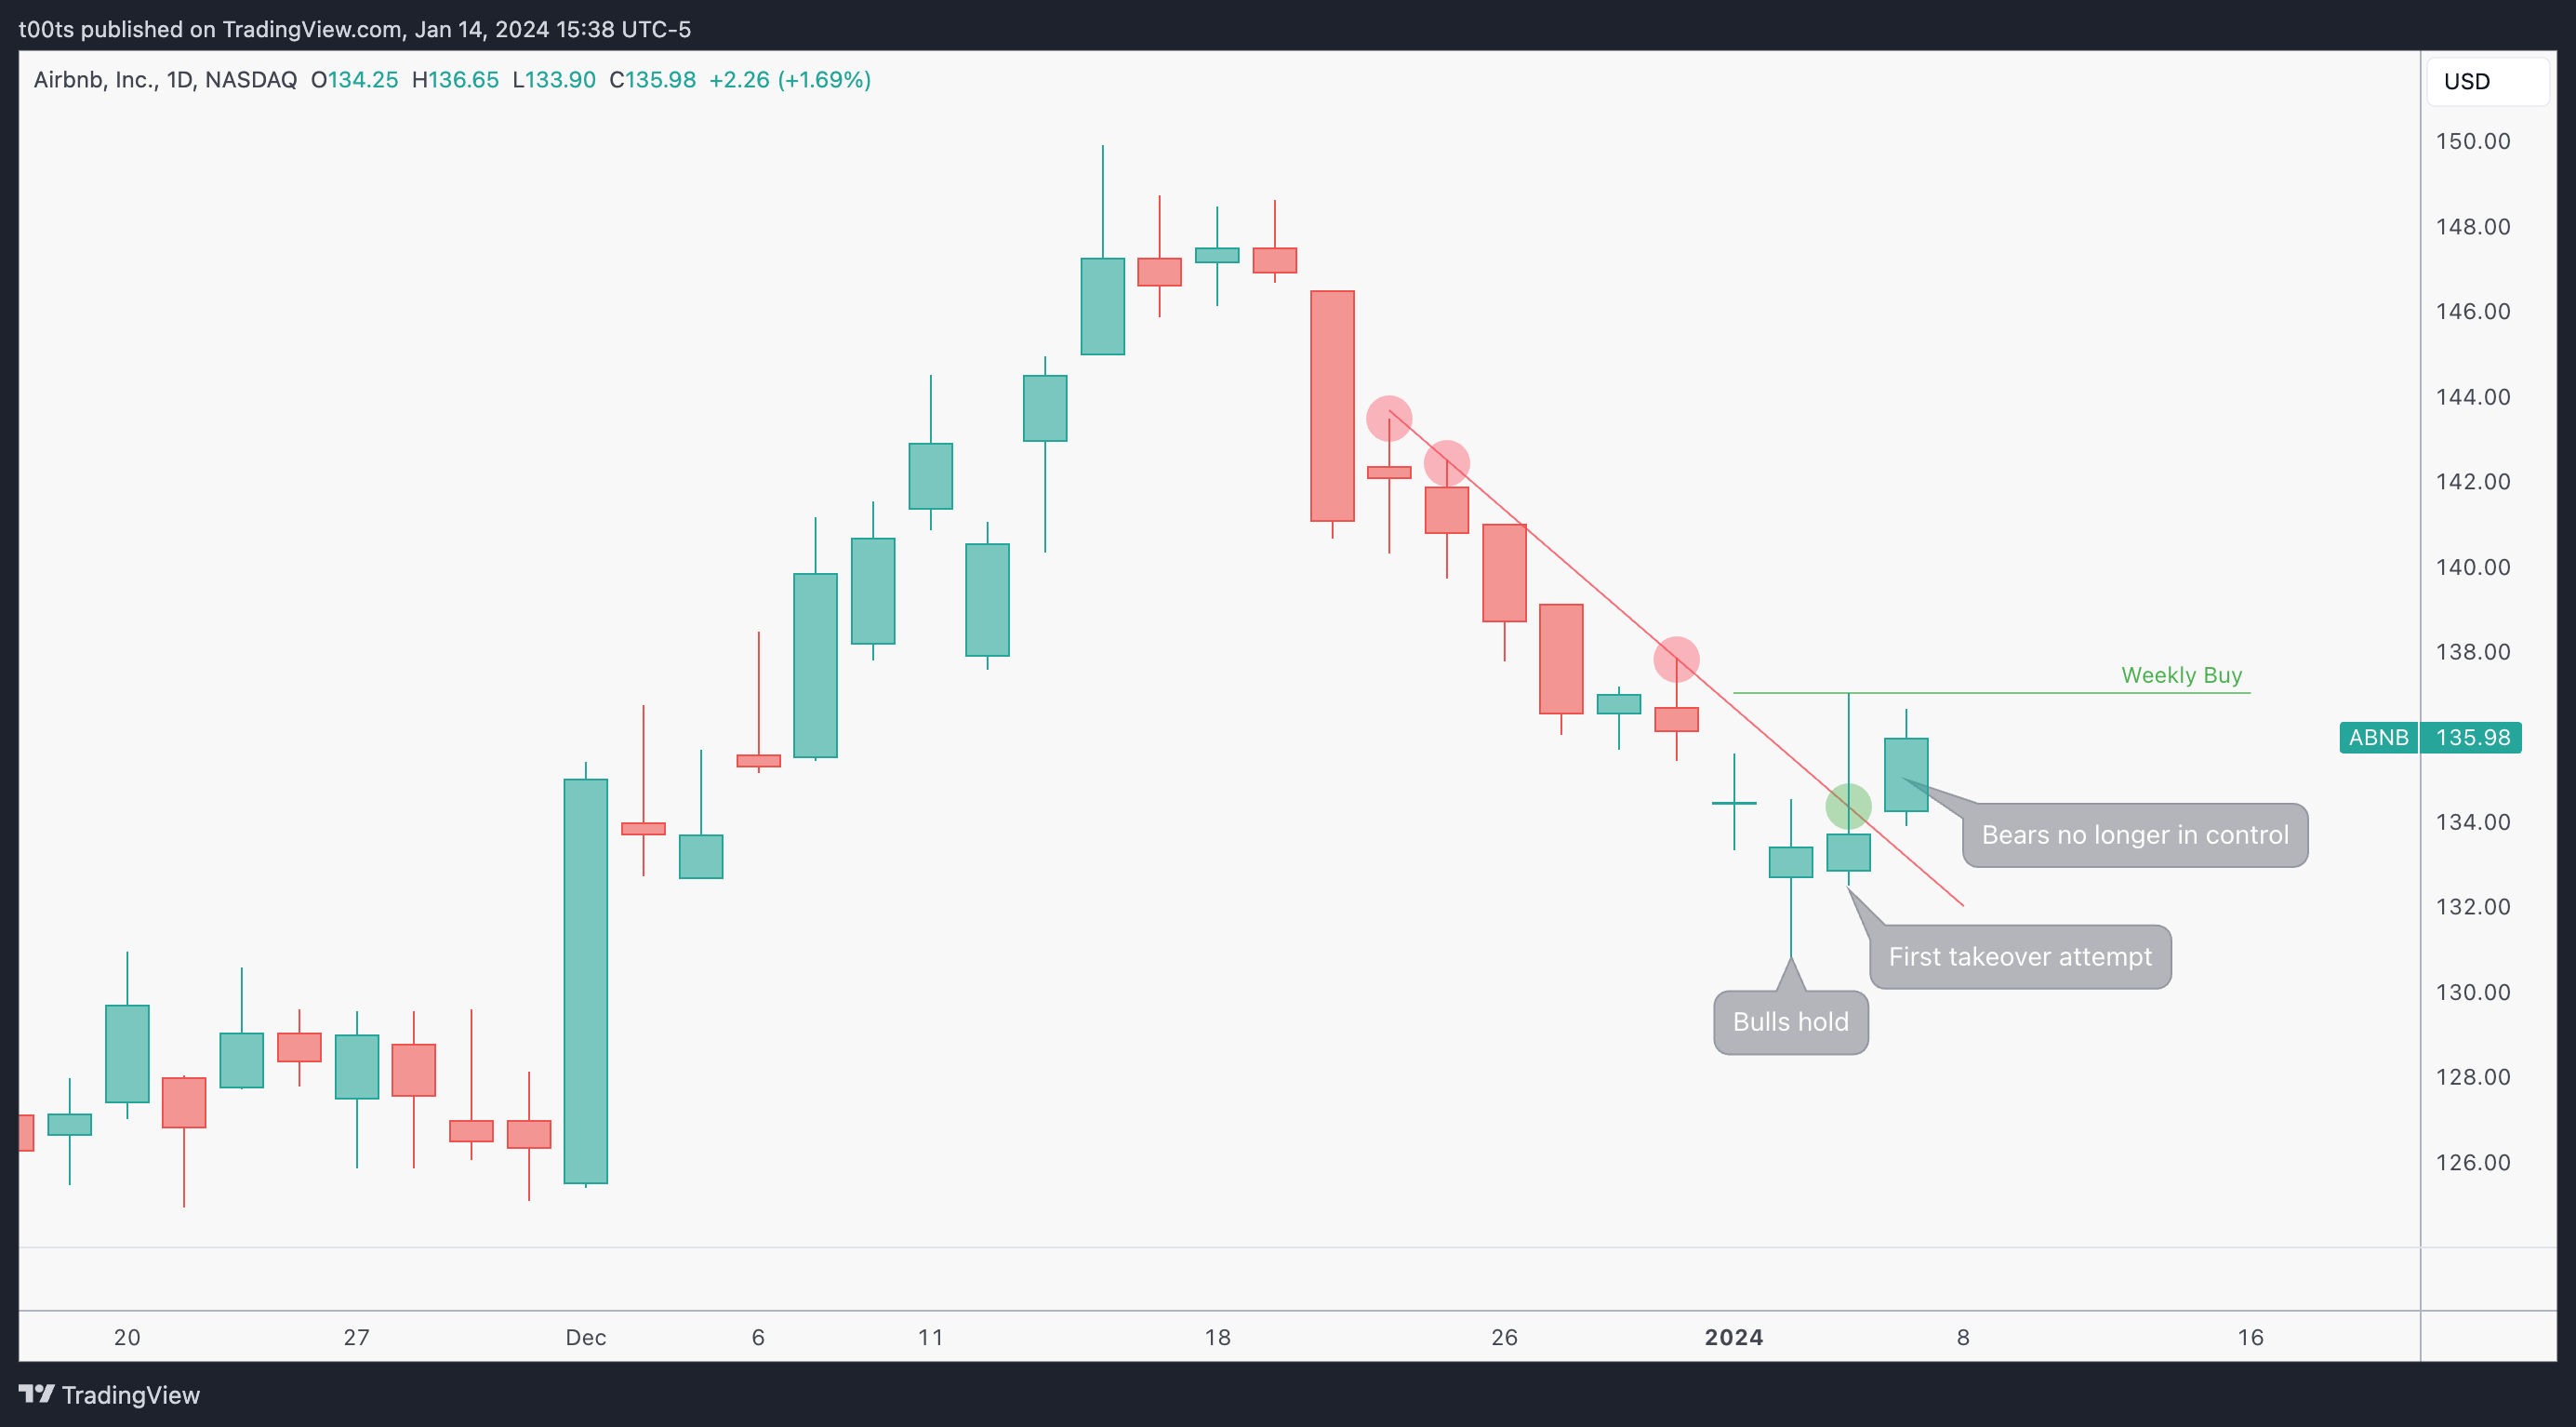
Daily chart
After a slightly aggressive pullback, we can appreciate how sellers are no longer in control. Buyers have managed to break that bearish trendline. It's interesting how the first takeover attempt fails, yet the following day they manage to open with a gap up that holds into the close.
Once again, a trendline break doesn't mean that the trend will reverse. It just means buyers and sellers have reached a point of equilibrium and there's a higher chance of sideways action until either side takes control.
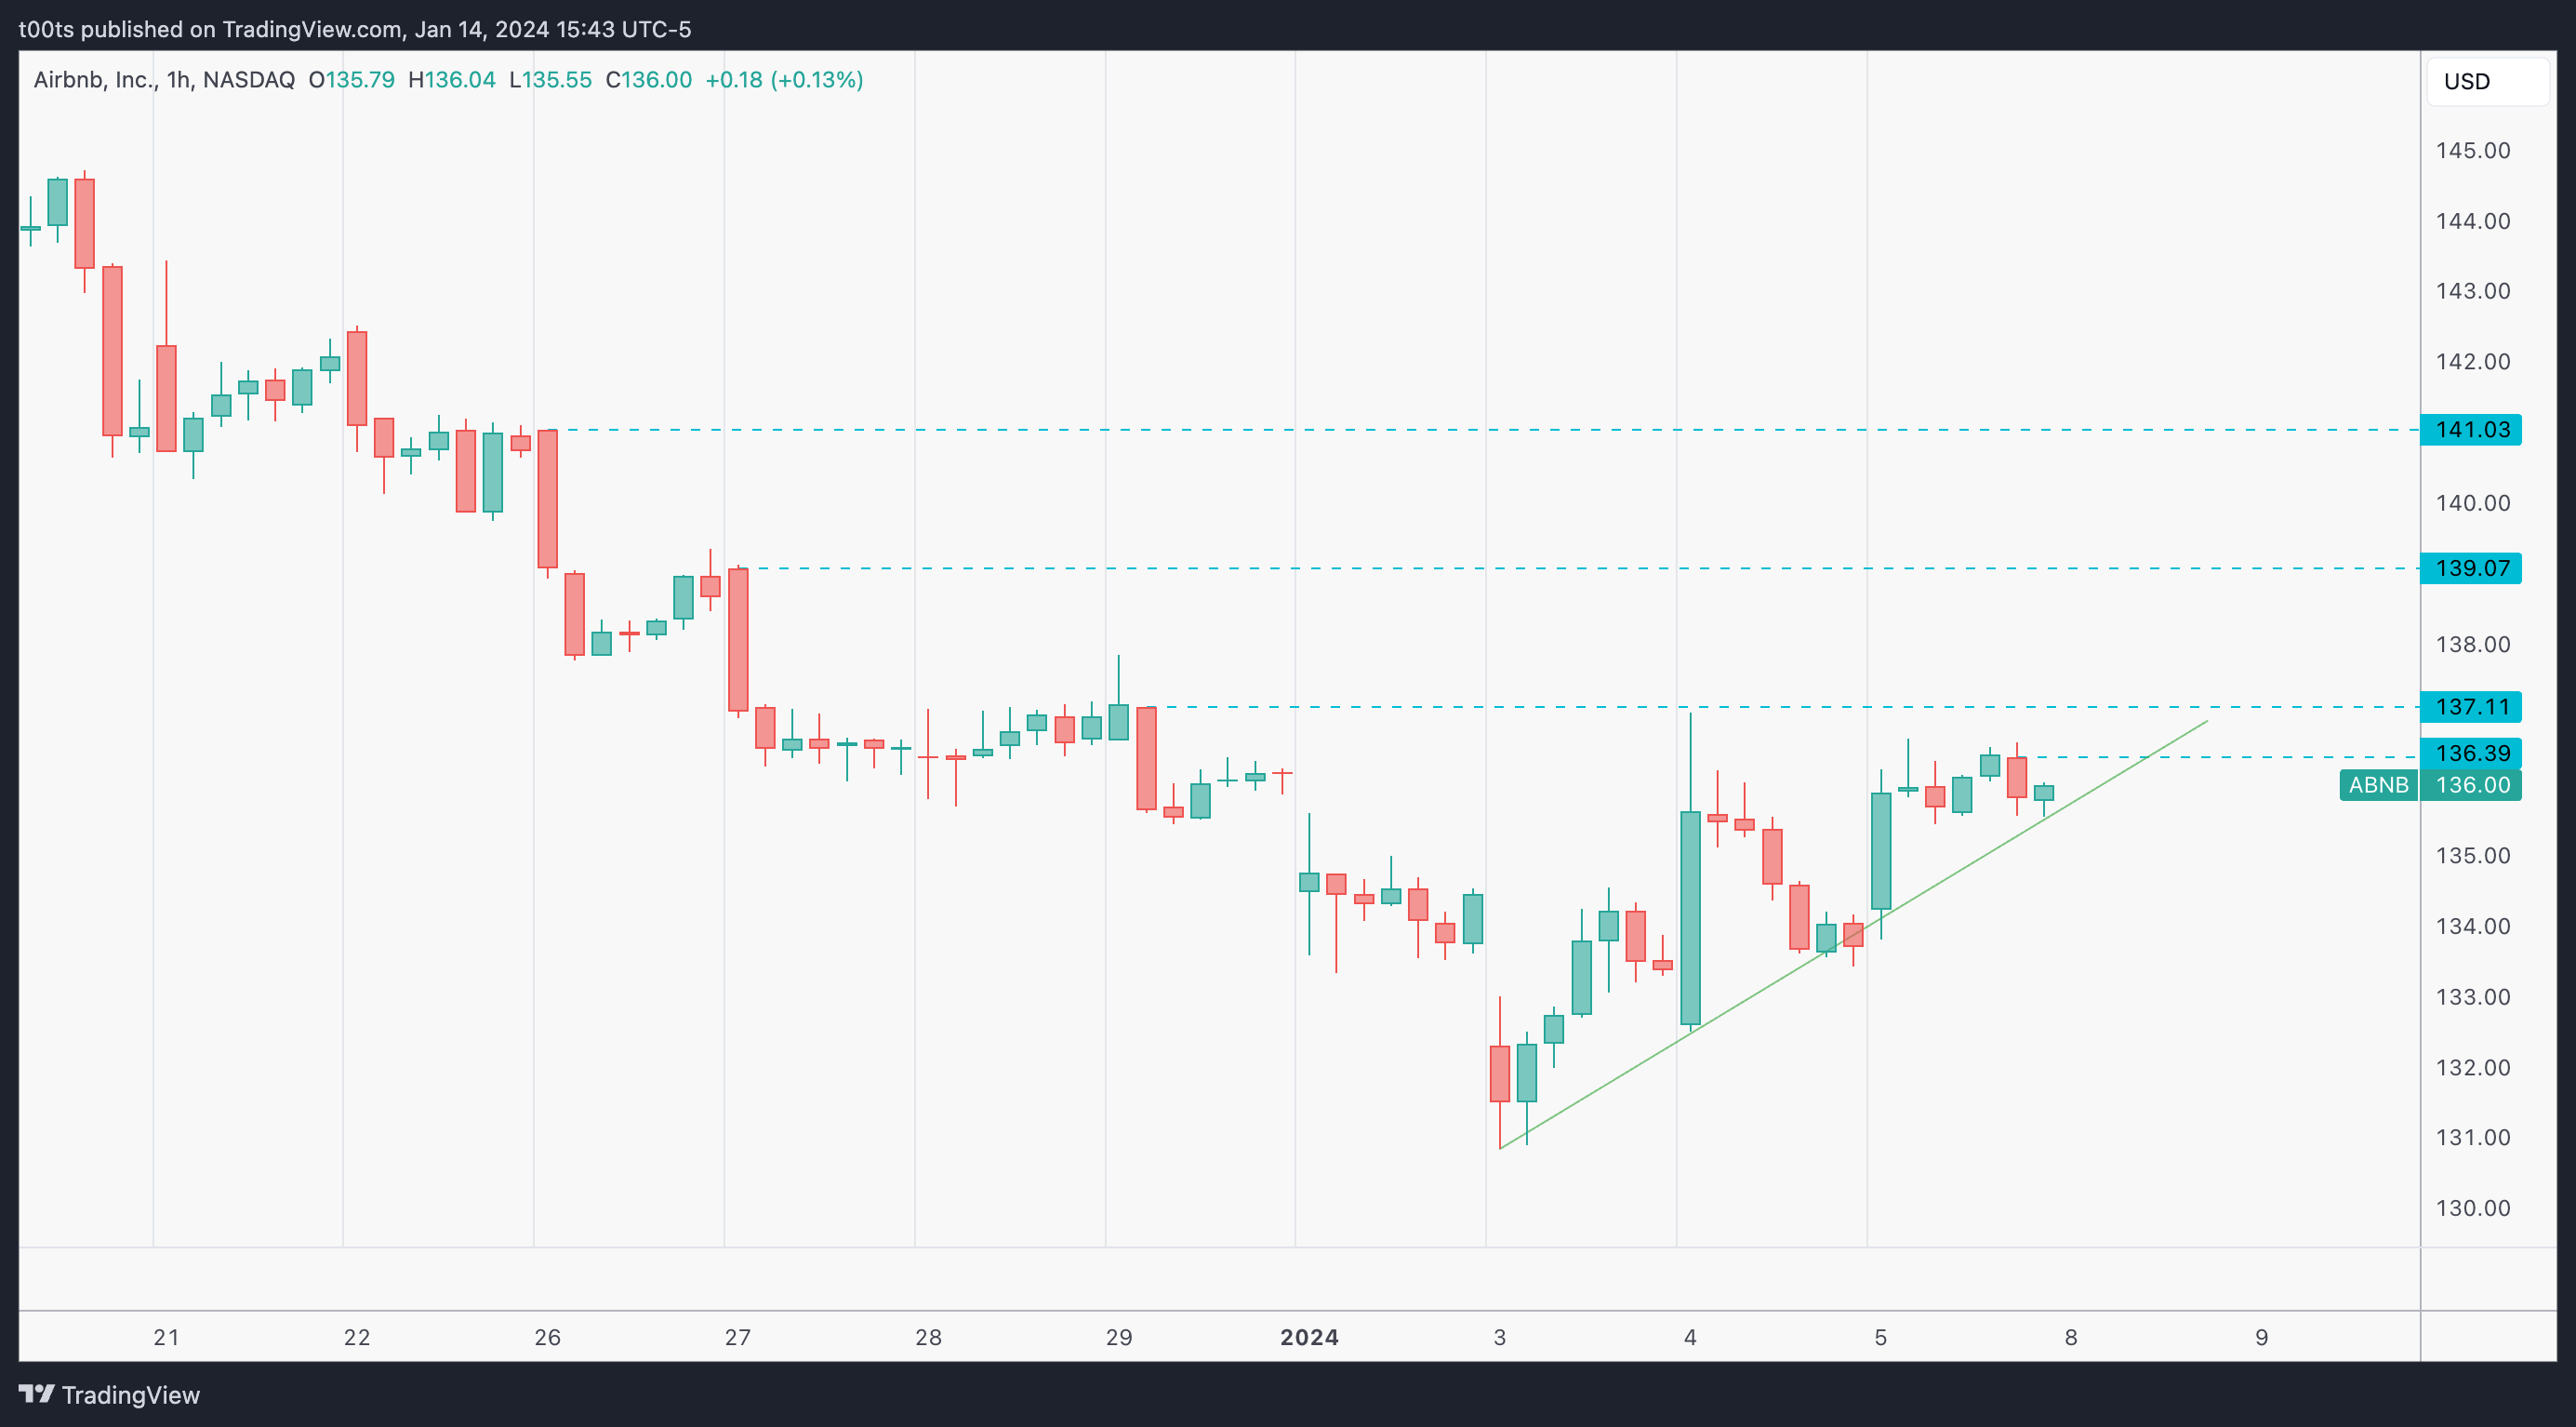
Hourly chart
The first thing we see in this hourly chart is a clean and clear downtrend. The second thing we see is that we’ve been setting some higher lows on the last couple days, creating an “ascending triangle” setup into the $137.11 resistance level above.
While I'm personally not very much into patterns, many traders are, so it's good to keep them in mind. All I'm interested in is the change in trend at a potential weekly higher low.
Pre-market action
There's not much going on in the pre-market. We're very used to getting clearer action in these pre-market charts because most of the stocks we go over are a lot more liquid. In this case, all I want to bring to your attention is that price is set to open above the $137.11 level, which quite conveniently matches our weekly buy trigger level. This makes this stock a clear watch for the day.

The trade
Sometimes you can identify stocks with potential, but intraday moves are clunky. This is a great example of a great setup that traded poorly. Very slow action all day and lots of up's and down's.
I'll present the cues and plan I had for the original trade idea, and then go ahead and break down what really happened throughout the day.
Using our CPT Framework:
Cue(s)
Beautiful bullish reversal bar on the weekly chart
Buyers have taken over on the daily chart
Potential ascending triangle breakout on the hourly chart
Intraday cue: Buy setup forming on a higher low right at the $137.11 level
Plan
The original plan was to trade off of an initial bounce on the $137.11 level. Find a bullish setup near that level to risk against it.
My bullish setups are very simple. A higher low in the smaller timeframes can usually work when the trades are near the open. Failure patterns I like a lot, and of course our well-known 3-bar play.
Trigger
Whatever the bullish setup is, getting triggered.
5m chart
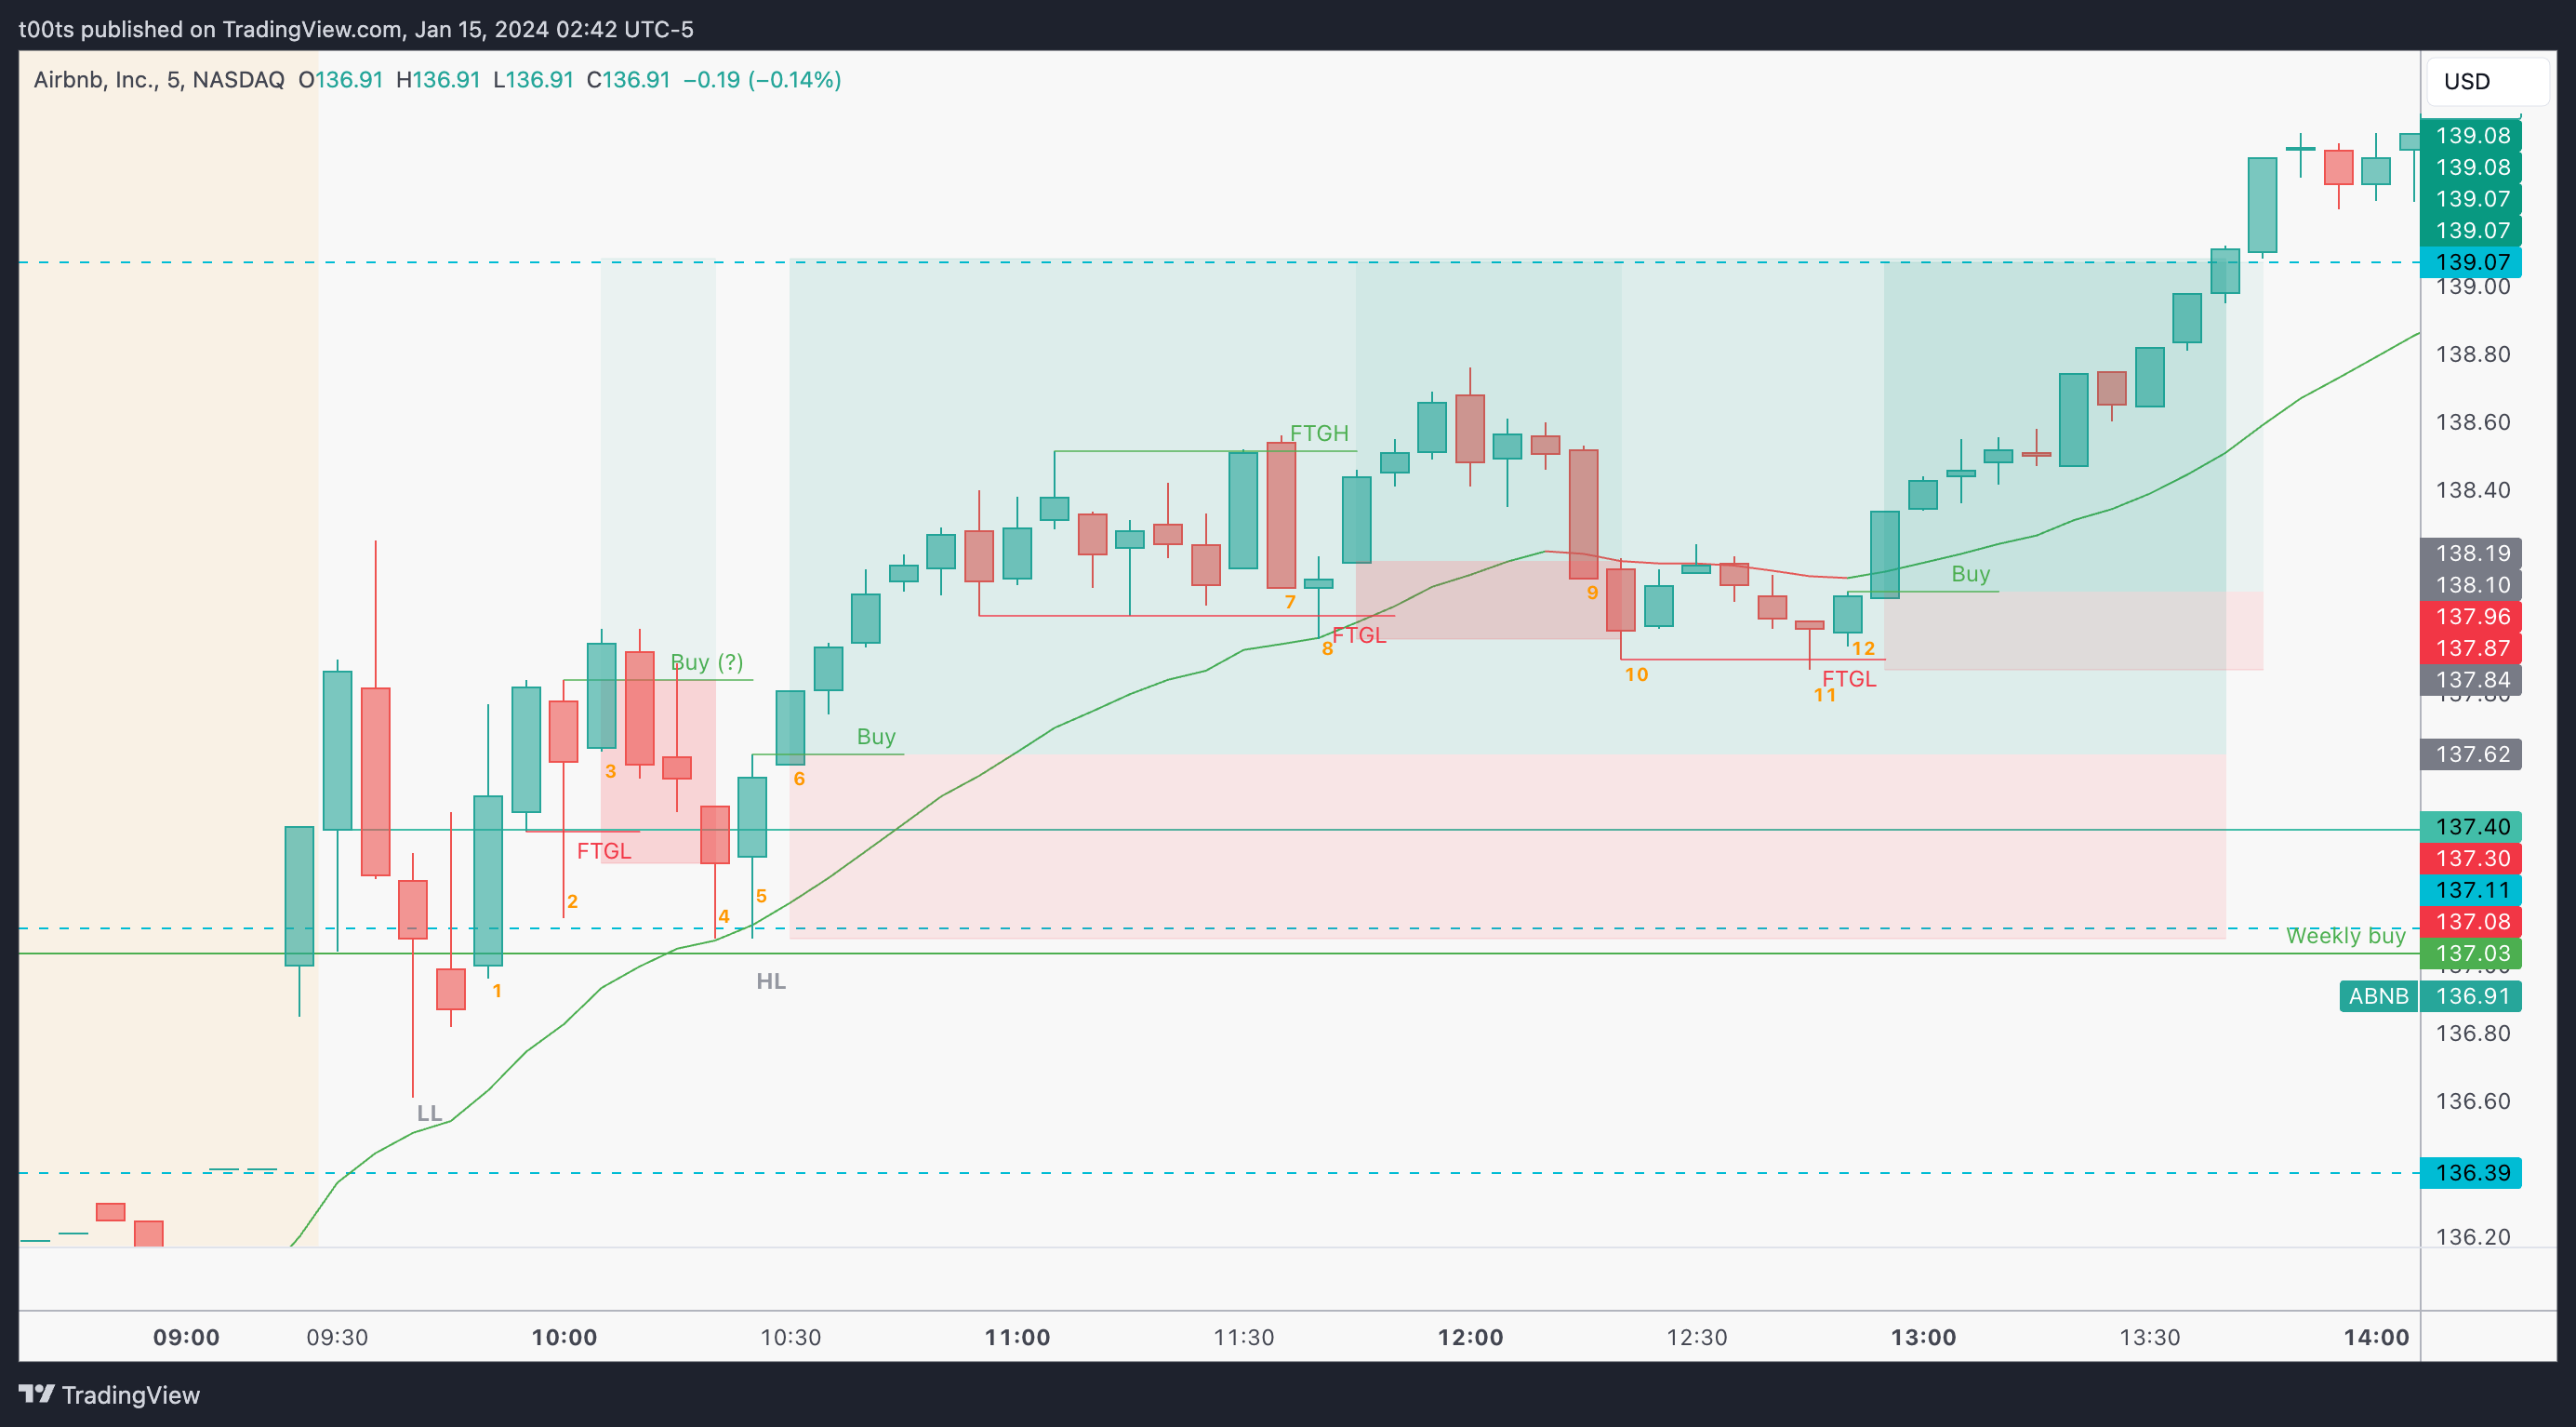
I did get caught up in some 2m early day action, but for the sake of this review, I believe this 5 minute chart is way more helpful and relatable.
Straight off the open, price retests the level and gets pushed back higher. This is an early entry we would've taken on other similar setups, but if you were watching this real time, not only the 2m chart looked very unappealing, but also there was super low volume being traded.
On these less liquid names, observing low volume on the open is a huge red flag if you’re looking to get involved early in the day. It’s always better to wait.
Price quickly turns and sets a new low of the day. Just looking at the gaps between bar closes and opens you can appreciate there was not much liquidity at this time, hence why we skip that opening drive altogether.
On bar 1 we get our first cue that our higher timeframe idea may still be in play. Bulls manage to reclaim the open after that strong rejection on the previous bar.
Bar 2 trades below the opening print and previous bar lows, but fails to close below it. It's a tempting entry because not only price fails to go lower, but it also sets up something like a 3-bar play, although not quite because it's not an inside bar.
Bar 3 triggers the “setup”, and as we see on the chart it traps a few longs. The problems I see with an entry like this are mainly:
You're buying the top of a trading range, which is usually not a good idea.
Your planned risk-to-reward is less than 2:1, which should be the bare minimum to consider a trade.
Bar 4 trades and closes below the opening print again. It's not a strong bearish close but it would've stopped you out if you had taken that entry on bar 3.
Bar 5 is where things start getting interesting. It's a bounce off the opening print and our $137.11 level of interest, with a bullish close above previous bar highs. This gives us our first 5m buy setup that actually makes sense.
Personally, as soon as the trade starts working, I'd move my stop up near the opening print. No point risking all the way down to the level anymore.
Bar 7 scares a lot of people out. You've been sitting on this trade for an hour and suddenly, when it seems it's about to push higher, it fails with a strong bearish engulfing trend bar. Not cool.
You may have trimmed there out of frustration and I would not blame you.
Bar 8 triggers some stops below the range but has a bullish close that leads the way into a new high of day. This bar can be used as another signal bar to long into the $139.07 target, risking its lows. This trade actually fails on bar 10, after bar 9 closes below the 20 EMA we regularly use as trend gauge.
Bar 11 fails to close below bar 10's low, and bulls see that and pick things up on bar 12, which does set up an interesting trade into our target despite being under the EMA. Notice I didn't draw the buy signal on the high of bar 11. One could argue this is somewhat a counter trend trade at this point, so as I usually preach, we wait for a second entry. In this particular case, bar 12 confirms that bulls are indeed interested in bidding price higher.
From there, it was just a matter of holding up until the target.
When price finally hit our target, it doesn’t show any signs of stopping. Not a single pullback. So there was really no reason to sell just yet. I'd like to spend a minute going over what happened next on this last part of the day and how you could hold this trade to maximize gains.
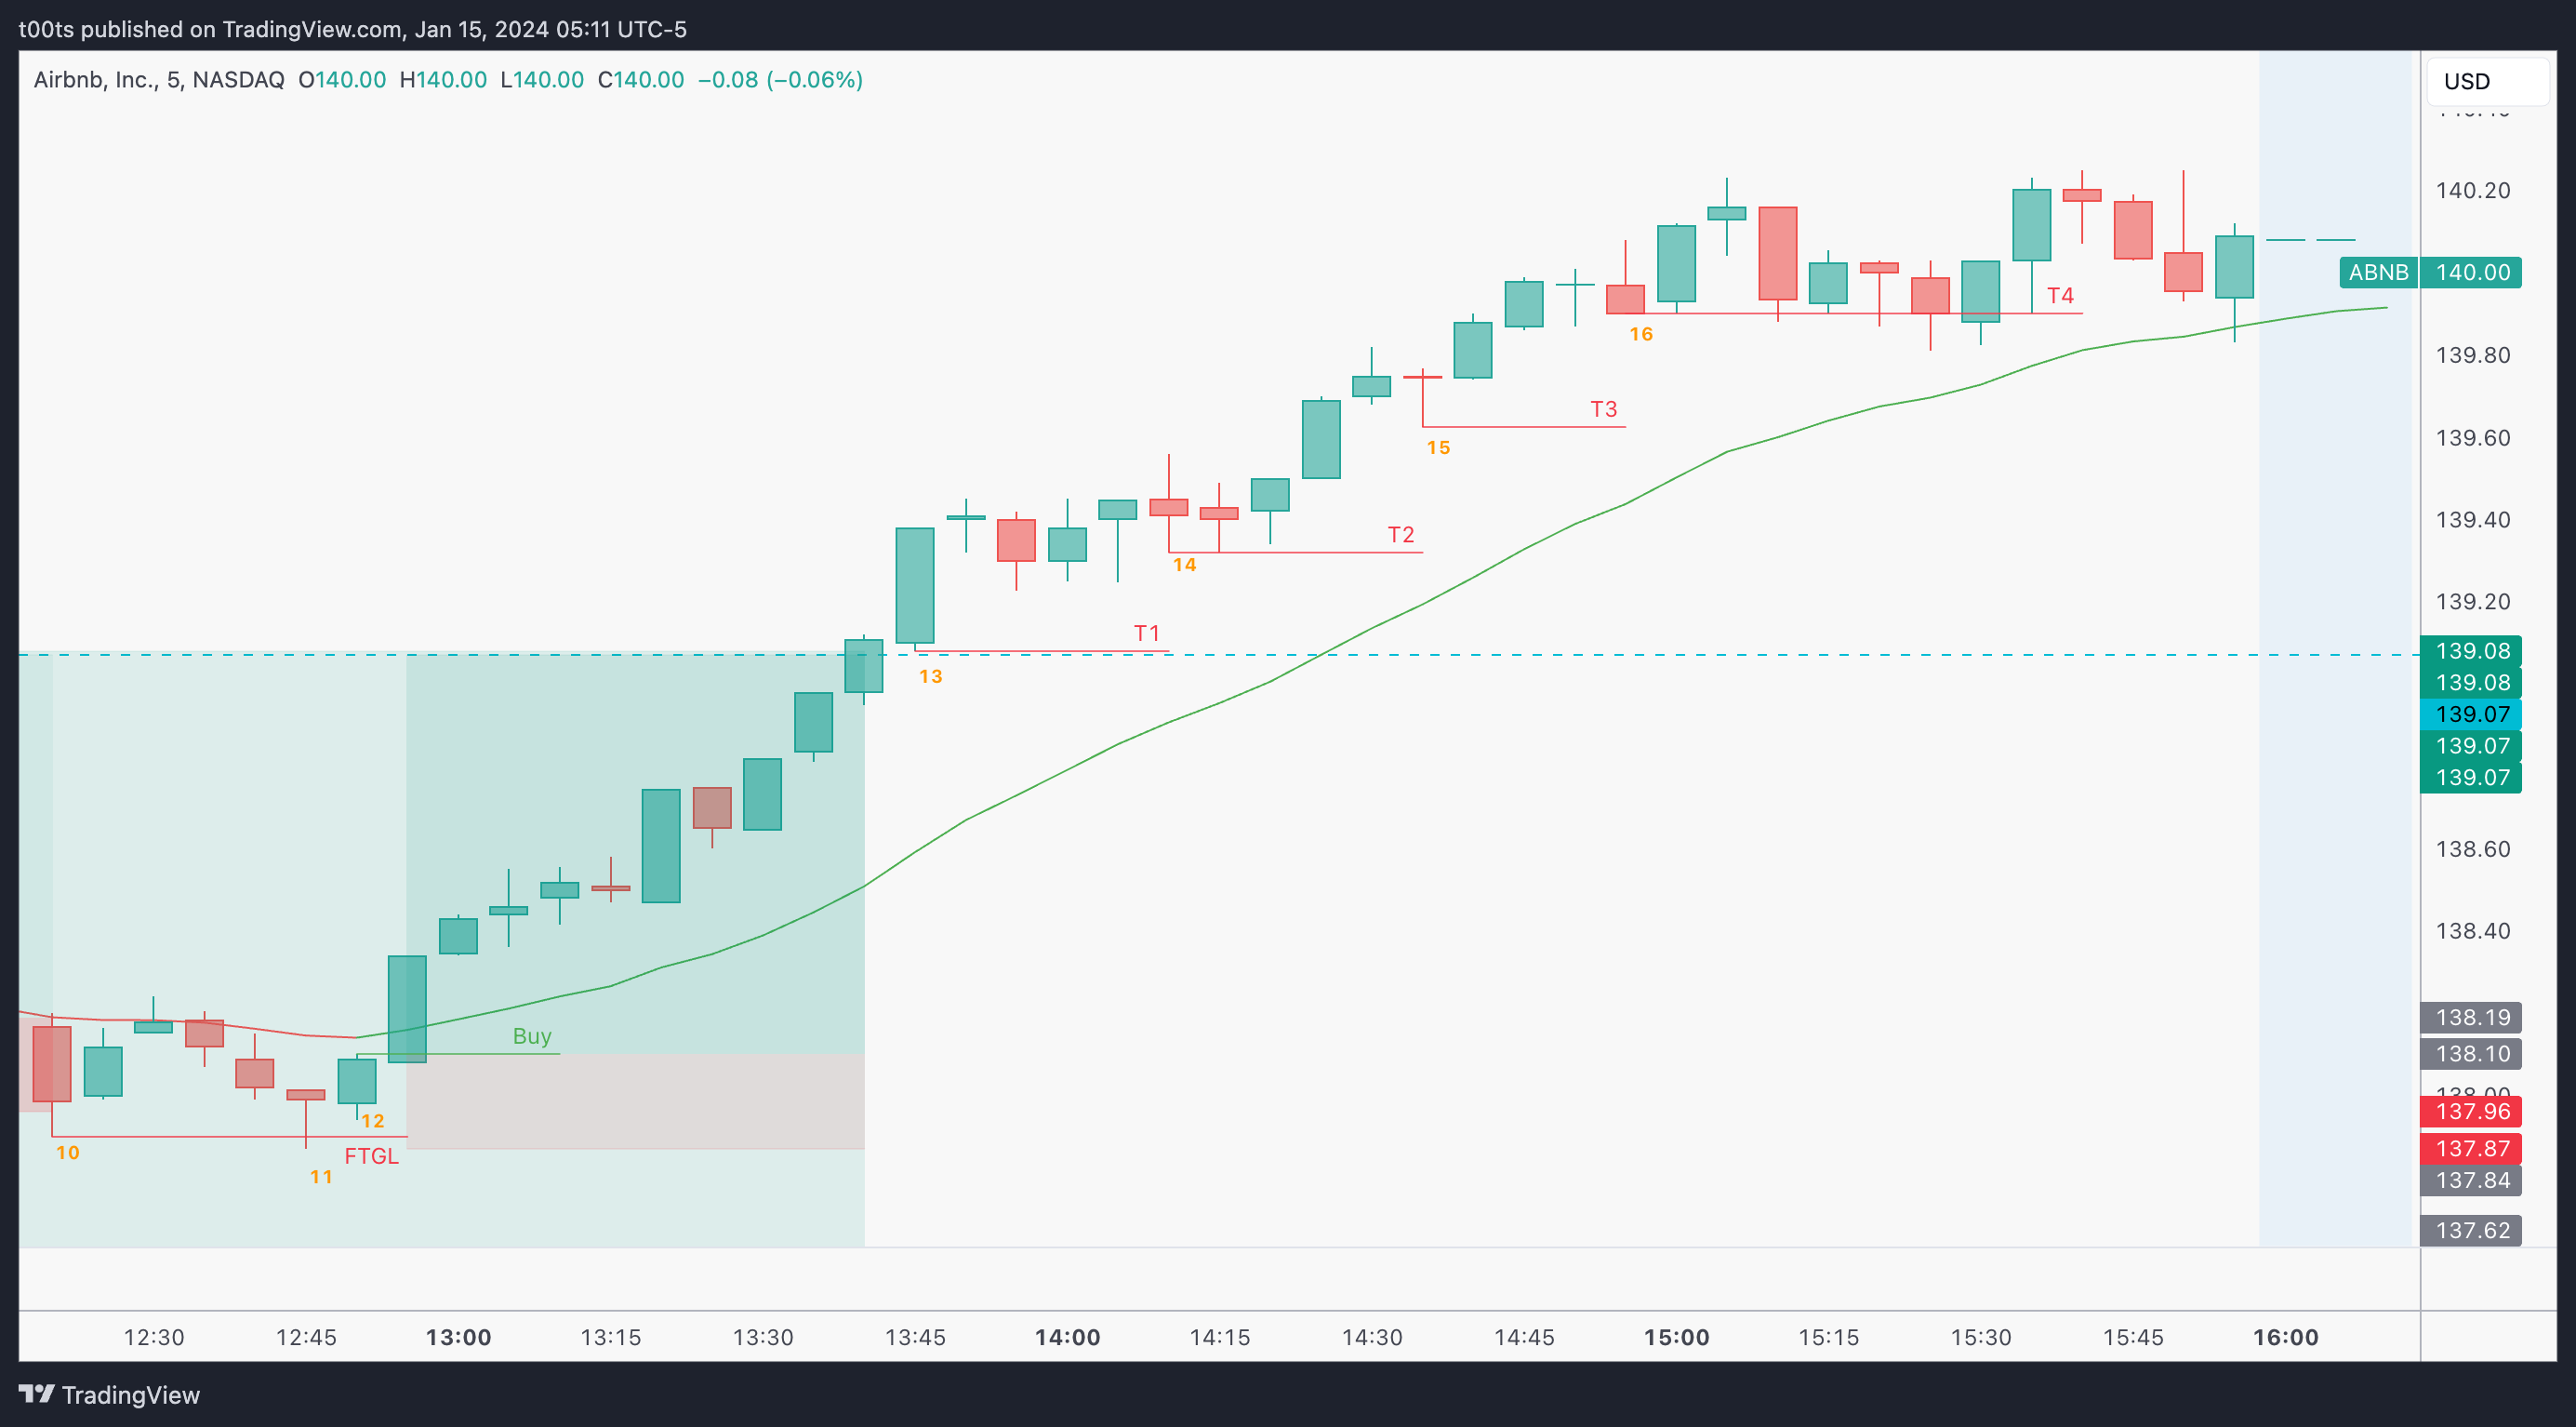
Bar 13 is a bullish trend bar that confirms the breakout. At this point, our trailing stop moves right into that bar's low, which essentially corresponds to the $139.08 target level.
Price consolidates and on bar 14 it fails to go higher. A break below that bar's lows would probably take us down into the level. We're not interested in giving back at this point, so we trail our stop up to those lows. Price never trades below them, and keeps climbing up.
Bar 15 is an interesting doji bar that bulls bid up into the close, so we can use that as our next trail.
Bar 16 fails to go higher again, so just as we did on bar 14, we trail to its lows. These will eventually hit and our trade is now over.
This last push up compensated for those small losses we may have experienced during the first half of the session.
Closing notes
This is a real example of a trade that doesn't work right off the bat and is not an easy hold. This happens more often than you’d think. It’s just as important to stay grounded and have the confidence to trust you thesis, as it is to be flexible and adjust when things are not working.
As I've mentioned before, the confidence to hold these trades comes from the higher timeframes. Zooming out and leaning more into what's going on in the bigger picture makes it easier to sit through choppy intraday moves and hold the trades longer. What's hard is to not do anything stupid in between.
I am posting one trade writeup every day throughout 2024. I focus on large caps using levels and price action. The subscription is absolutely free and will always be. I will strive to provide value by offering clues and ideas for you to enhance your edge. Let’s grow together!